. 2018 Jul 12;174(2):481-496.e19.
doi: 10.1016/j.cell.2018.06.042.

A Genetically Encoded Fluorescent Sensor Enables Rapid and Specific Detection of Dopamine in Flies, Fish, and Mice

Affiliations

A Genetically Encoded Fluorescent Sensor Enables Rapid and Specific Detection of Dopamine in Flies, Fish, and Mice

Fangmiao Sun et al. Cell. .

Abstract

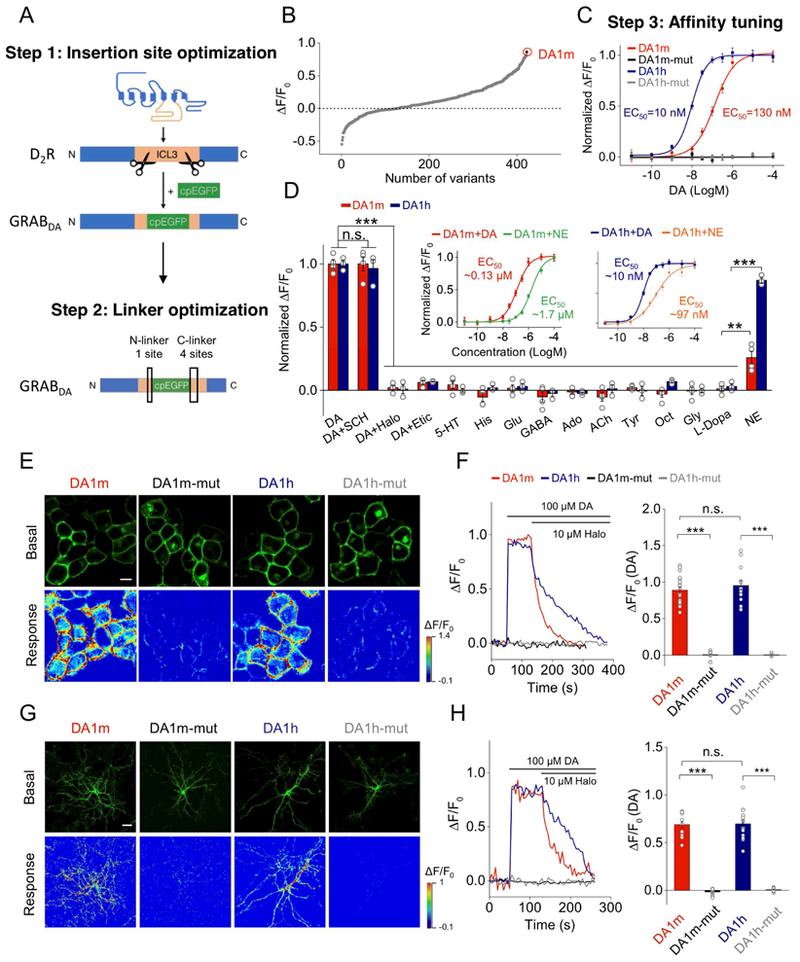
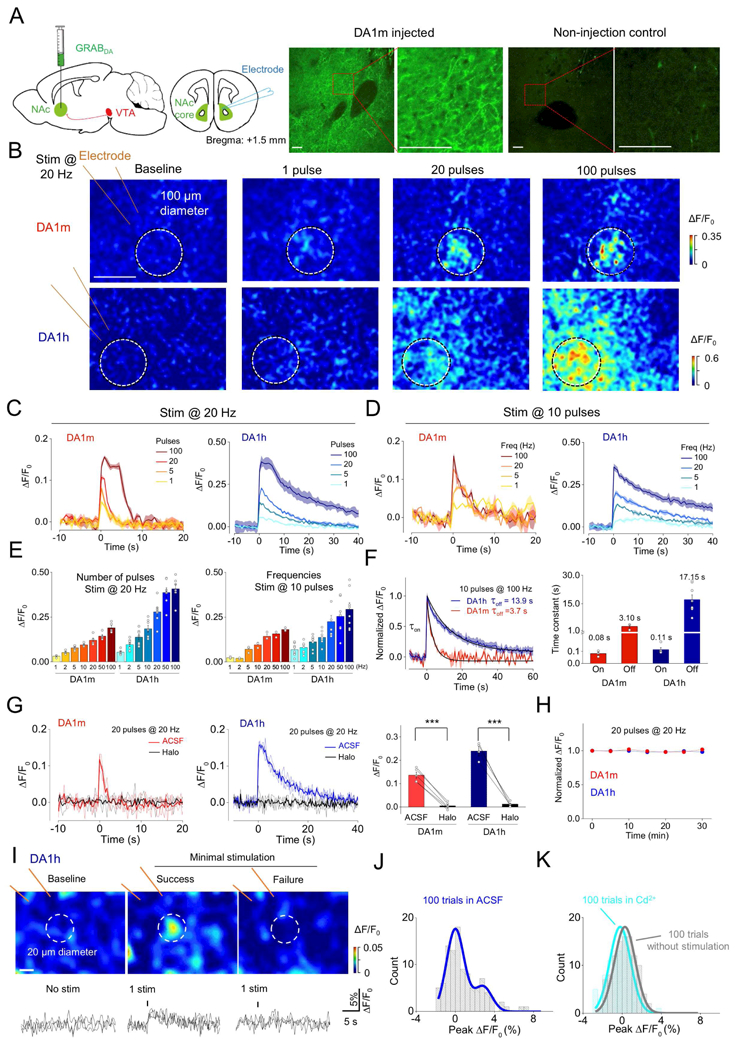
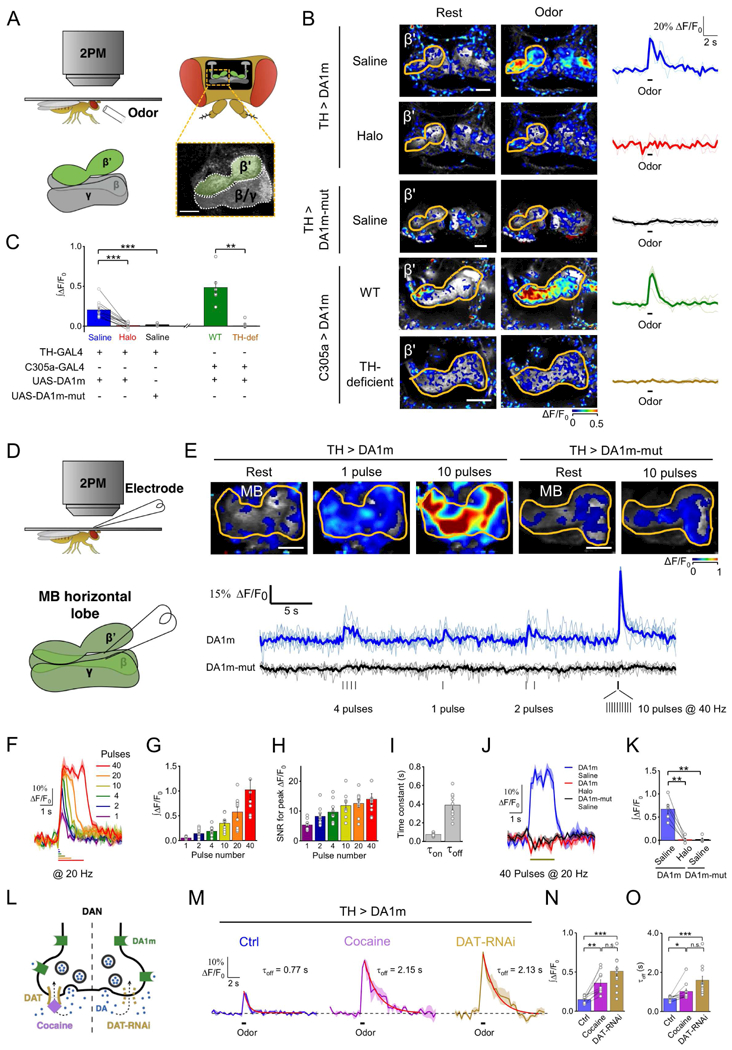
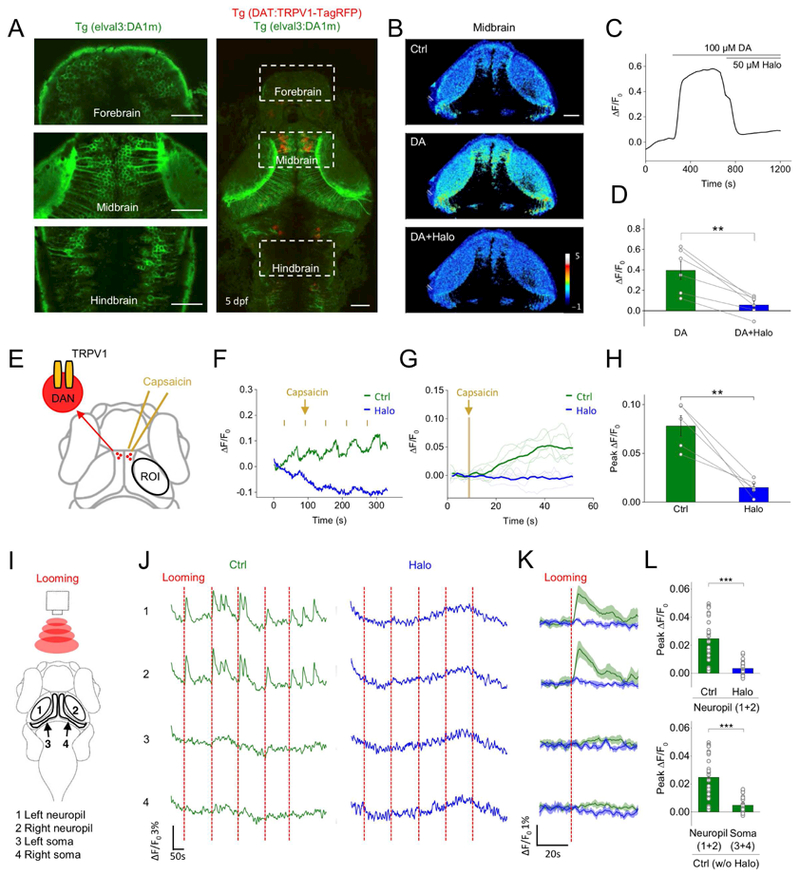
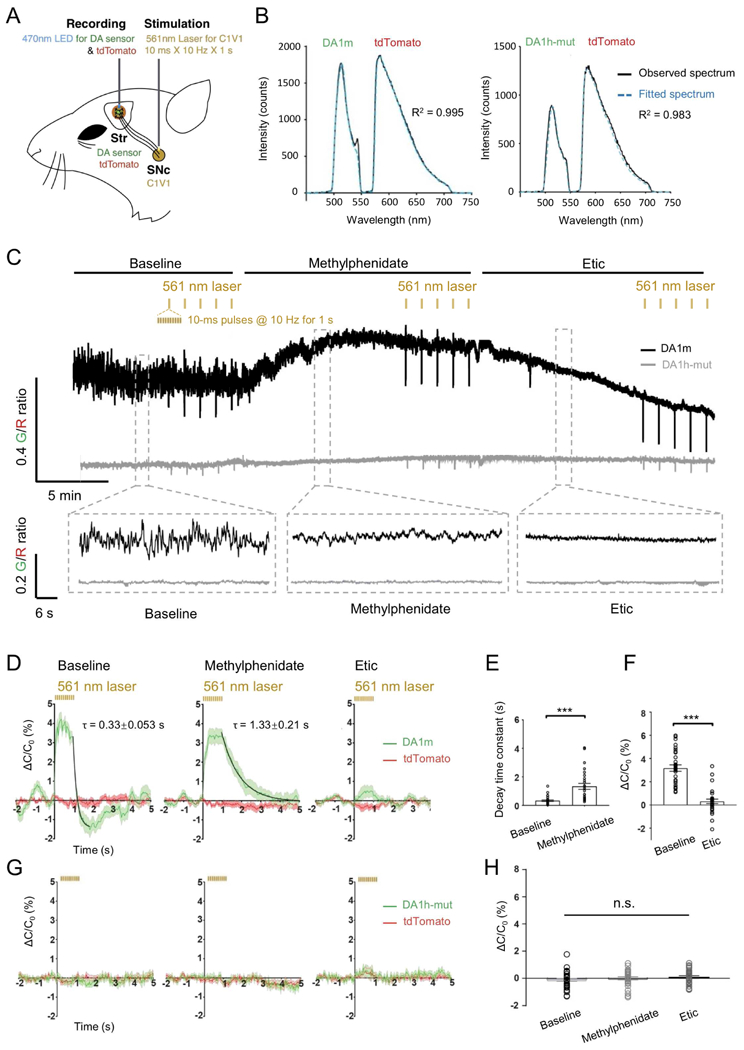
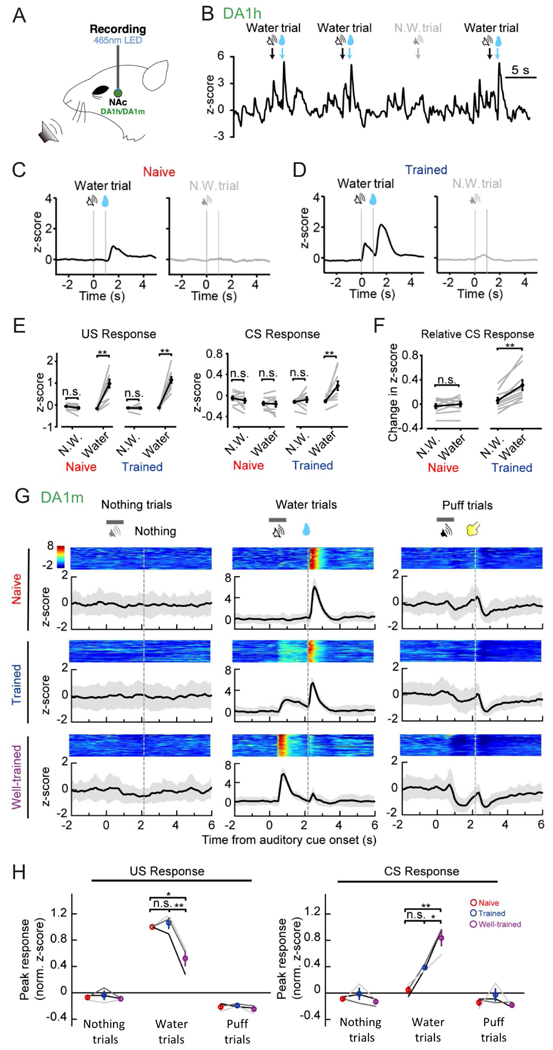
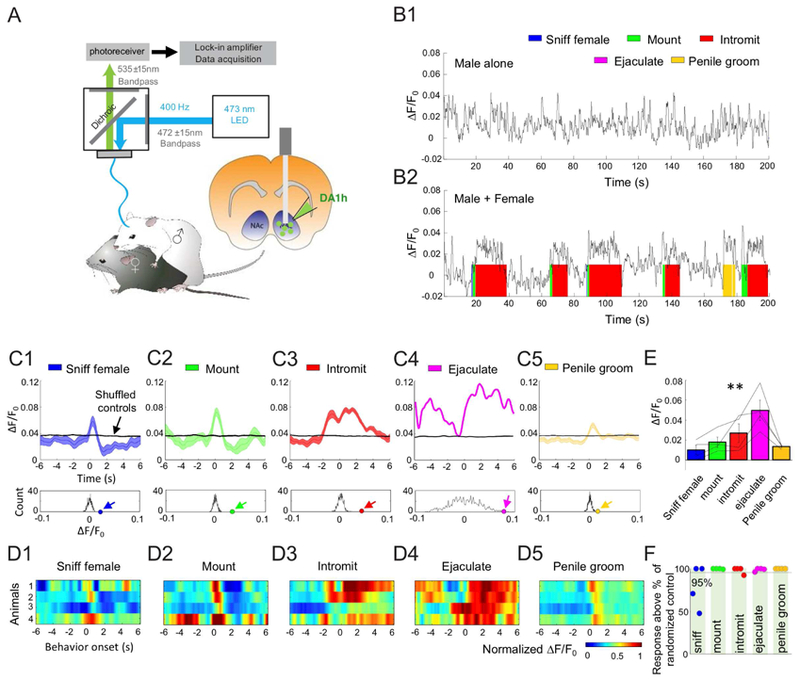
Dopamine (DA) is a central monoamine neurotransmitter involved in many physiological and pathological processes. A longstanding yet largely unmet goal is to measure DA changes reliably and specifically with high spatiotemporal precision, particularly in animals executing complex behaviors. Here, we report the development of genetically encoded GPCR-activation-based-DA (GRABDA) sensors that enable these measurements. In response to extracellular DA, GRABDA sensors exhibit large fluorescence increases (ΔF/F0 ∼90%) with subcellular resolution, subsecond kinetics, nanomolar to submicromolar affinities, and excellent molecular specificity. GRABDA sensors can resolve a single-electrical-stimulus-evoked DA release in mouse brain slices and detect endogenous DA release in living flies, fish, and mice. In freely behaving mice, GRABDA sensors readily report optogenetically elicited nigrostriatal DA release and depict dynamic mesoaccumbens DA signaling during Pavlovian conditioning or during sexual behaviors. Thus, GRABDA sensors enable spatiotemporally precise measurements of DA dynamics in a variety of model organisms while exhibiting complex behaviors.

Keywords: GPCR; GRAB(DA); dopamine; sensor.


Conflict of interest statement

Declaration of Interests

The authors declare competing financial interests. F.S., J.Z., M.J. and Y.L. have filed patent applications whose value might be affected by this publication.

Figures

Figure 1.
Figure 1.. Design, optimization and characterization of GRABDA sensors in cultured HEK293T cells.
(A) Schematic diagrams showing the strategy of insertion site and linker optimization. (B) Optimization of the cpEGFP insertion site within the third intracellular loop (ICL3) of D2R and the linkers between D2R and cpEGFP. The fluorescence responses of variant-expressing cells in response to 100 μM DA application. DA1m, with the highest ΔF/F0, was selected for further optimization. Each point represents the average of at least 3–5 cells. (C) Affinity tuning. Either the T205M single mutation (generating DA1h), or the C118A/S193N double mutations (generating DA1m/h-mut), were introduced into DA1m. The normalized dose-dependent fluorescence responses of various GRABDA-expressing cells in response to DA application are plotted. Each point represents average of 6 wells containing 100–400 cells/well. (D) Normalized fluorescence changes in DA1m (red), DA1h (blue) expressing cells in response to the application of indicated compounds at 1 μM: DA, DA + SCH, DA + Halo, DA + Etic, 5-HT, histamine (His), glutamate (Glu), gamma-aminobutyric acid (GABA), adenosine (Ado), acetylcholine (ACh), tyramine (Tyr), octopamine (Oct), glycine (Gly), or L-DOPA and NE (DA1m: n = 4 wells; DA1h: n = 3 wells; 200–400 cells/well; p > 0.05 for DA1m/h responses induced by DA compared with DA+SCH; p < 0.001 for DA1m/h responses induced by DA compared with DA+Halo, DA+Etic, 5-HT, His, Glu, GABA, Ado, ACh, Tyr, Oct, Gly and L-DOPA; comparing responses induced by NE with L-Dopa, p = 0.004 for DA1m and p <0.001 for DA1h). The insets show the normalized dose-dependent responses of DA1m- or DA1h-expressing cells to DA and NE application (n = 6 wells/group with 200–400 cells/well). (E and F) Expression of GRABDA sensors in HEK293T cells. (E) Representative basal fluorescence Intensity (without DA) and responses to 100 μM DA. (F) Representative traces and group analysis of fluorescence changes in GRABDA-expressing cells in response to 100 μM DA followed by 10 μM Halo (DA1m: n = 18 cells from 4 cultures (18/4); DA1m-mut: n = 15/3; DA1h: n = 14/3; DA1h-mut: n = 14/3; p < 0.001 between DA1m and DA1m-mut; p < 0.001 between DA1h and DA1h-mut; p = 0.42 between DA1m and DA1h). (G and H) Similar to (E and F), except that GRABDA sensors are expressed in cultured neurons (DA1m: n = 13/7; DA1m-mut: n = 14/5; DA1h: n = 16/4; DA1h-mut: n = 10/5; p < 0.001 between DA1m and DA1m-mut; p < 0.001 between DA1h and DA1h-mut; p = 0.88 between DA1m and DA1h). Scale bars, 10 μm (E), 30 μm (G). Values with error bars indicate mean ± SEM. Students’ t-test performed; n.s., not significant; **, p < 0.01; ***, p < 0.001. See also Fig. S1–2.
Figure 2.
Figure 2.. Release of endogenous DA measured in acute mouse brain slices.
(A) Left two panels, schematic of the experimental protocol for expressing GRABDA sensors and imaging DA dynamics in mouse brain slices containing NAc. Right, the immunoreactive signals of GFP in NAc slices from either DA1m injected or non-injection control mice. Red squares in left panel indicate expanded region in right panel. Scale bars, 100 μm. (B) Representative pseudocolor images of fluorescence responses in DA1m- or DA1h-expressing neurons following 20 Hz electrical stimulation containing the indicated pulse numbers. White circles represent the ROI selected for analysis. Scale bar, 100 μm. (C-D) Representative fluorescence responses of DA1m- and DA1h-expressing neurons following 20 Hz electrical stimuli containing the indicated pulse numbers (C), or a 10 pulse train electrical stimulation at the indicated frequencies (D). Each trace is the average of 3 trials in one slice. (E) Group analysis of the fluorescence response to electrical stimuli at different pulse numbers or frequencies (pulses: DA1m: n = 5 slices from 3 mice; DA1h: n = 7 slices from 4 mice; frequencies: DA1m: n = 3 slices from 2 mice; DA1h: n = 8 slices from 4 mice). (F) Representative traces (left) and group analysis (right) of the normalized fluorescence changes and kinetics in DA1m- and DA1h-expressing neurons to 10 electrical pulses delivered at 100 Hz. The rising (on) and decaying (off) phases are fitted and summarized on the right. (DA1m: n = 3 slices from 2 mice; DA1h: n = 5–8 slices from 3 mice). (G) Representative traces (left and middle, with 3 individual trials and the averaged trials) and group analysis (right) of DA1m- and DA1h-expressing neurons to 20 electrical pulses at 20 Hz, in control solution (ACSF) or solution containing 10 μM Halo (DA1m: n = 5 slices from 4 mice, p < 0.001 comparing ACSF with Halo; DA1h: n = 6 slices from 4 mice, p < 0.001 comparing ACSF with Halo). (H) The fluorescence changes in DA1m- and DA1h-expressing neurons to multiple trains of electrical stimuli with an interval of 5 min. The fluorescence changes induced by the first train were used to normalize the data in each slice (DA1m: n = 3 slices form 2 mice; DA1h: n = 6 slices from 3 mice). (I) Top: representative pseudocolor images of fluorescence responses during minimal stimulation (left, baseline; middle, success trial; right, failure trial). White circles represent ROI with ~20 μm diameter. Bottom, 3 exemplar trials for each condition, with the dashed lines indicating the stimulation. The data were processed with 3 × binning. Scale bar, 10 μm. (J) The distribution of peak ΔF/F0 of DA1h-expressing neurons in 100 minimal stimulation trials in ACSF. (K) Comparison of the distribution of peak ΔF/F0 in 100 trials without stimulation (gray) in ACSF and with stimulation in ACSF containing Cd2+ (light blue) from the same slice. Values with error bars or shaded areas indicate mean ± SEM. Student’s t-test performed; ***, p < 0.001. See also Fig. S3–4 and Movie S1.
Figure 3.
Figure 3.. In vivo imaging of DA dynamics in the Drosophila brain.
(A) Schematic for odor stimulation during two-photon microscopy in drosophila. (B and C) Fluorescence changes of DA1m or DA1m-mut expressing flies to 1 sec odor stimulation. (B) Representative pseudocolor images, single trial traces (light) and averaged traces (bold) from one fly. (C) Group analysis (TH > DA1m: n = 12 flies; TH > DA1m-mut: n = 5 flies; C305a > DA1m WT flies: n = 6 flies; C305a > DA1m TH-deficient flies: n = 6 flies; p < 0.001 for TH > DA1m in saline compared with Halo; p < 0.001 for TH > DA1m compared with TH > DA1m-mut in saline; p = 0.002 for C305a > DA1m in WT flies compared with TH-deficient flies). (D) Schematic depicting in vivo electrical stimulation in which an electrode was positioned near the DA1m-expressing DANs in order to evoke DA release. (E) Top, representative pseudocolor images of TH > DA1m and TH > DA1m-mut flies in response to multiple trains of electrical pulses. Bottom, single-trial traces (light) and 6-trial averaged traces (bold) from one fly with indicated genotypes. Each vertical tick indicates 1-ms electrical pulse. (F-I) Electrical stimulation of TH > DA1m flies. (F) Representative traces, (G) group analysis of integrated signal, (H) signal-to-noise ratios (SNR), and (I) kinetics of responses to electrical pulses (n = 9 flies/group). (J-K) Fluorescence changes in TH > DA1m and TH > DA1m-mut flies in response to 40 pulses electrical stimuli (at 20 Hz), in normal saline or in saline containing 10 μM Halo (TH > DA1m: n = 5 flies; TH > DA1m-mutt: n = 5 flies; p = 0.004 for responses of TH > DA1m in saline compared with Halo; p = 0.007 for responses of TH > DA1m in saline compared with TH > DA1m-mut in saline). (J) Representative traces and (K) group analysis. (L-O) Fluorescence changes in TH > DA1m flies in response to 1-s odor stimulation, in saline, saline containing 3 μM cocaine or when the DAT expression in DAN was impaired by DAT-RNAi. (L) Schematic of the experimental design. (M) Representative traces fitted with a single-exponential function (red traces), with the decay time constants shown. (N and O) The group analysis of integrals and the decay time constants (TH > DA1m: n = 10 flies; TH > DA1m, DAT-RNAi: n = 11 flies; between control and cocaine groups, p = 0.002 for integrals and p = 0.025 for decay time constants; between control and DAT-RNAi groups, p < 0.001 for both integrals and decay time constants; between cocaine and DAT-RNAi groups, p = 0.095 for integrals and p = 0.053 for decay time constants). Averaged traces shaded with ± SEM are shown in (F), (J), and (M). Values with error bars indicate mean ± SEM. Student’s t-test performed; n.s., not significant; *, p < 0.05; **, p < 0.01; ***, p < 0.001. Scale bars in (B) and (E), 25 μm. See also Fig. S4–5 and Movie S2.
Figure 4.
Figure 4.. Monitoring in vivo DA release in transgenic zebrafish.
(A) Fluorescence images of a transgenic zebrafish larvae expressing DA1m (green) pan-neuronally and TRPV1-TagRFP (red) in DANs with expanded views of DA1m-expressing neurons in indicated brain regions (left). (B-D) DA1m-expressing neurons to 100 μM DA followed by 50 μM Halo (n = 6 fishes; p = 0.002 between DA and DA+Halo). (B) Representative pseudocolor images, (C) traces and (D) group analysis. (E) Schematic of chemogenetic activation of TRPV1-expressing DANs by capsaicin. The fluorescence signals in the tectal neurons (within ROI) were analyzed. (F-H) Fluorescence changes of DA1m-expressing neurons to 5-trial capsaicin application, in control solution (green) or solution containing 50 μM Halo (blue). Representative traces encompassing 5 sequential stimulation trials and corresponding averaged traces from one fish are shown in F and G. (H) Group analysis (n = 5 fish; p = 0.006 between control and Halo). (I) Schematic for visual stimulation in which red expanding dots were projected in front of the larva. The fluorescence responses in neuropil (1 and 2) and soma (3 and 4) regions of the optic tectum were analyzed, respectively. (J-L) Fluorescence changes of DA1m-expressing neurons from each region during visual stimulation in control solution (green) or solution containing 50 μM Halo (blue). Vertical dashed red line, 3-s looming stimulation. Representative traces encompassing 5 sequential stimulation trials and the corresponding averaged traces from one fish are shown in J and K. Group analysis is shown in L (n = 30 trials from 3 fish for each condition; p < 0.001 in two panels). Scale bars in (A) and (B), 50 μm. Values with error bars indicate mean ± SEM. Student’s t-test performed; **, p < 0.01; ***, p < 0.001.
Figure 5.
Figure 5.. Striatal DA dynamics measured in freely moving mice during optogenetic stimulation of the SNc.
(A) Schematic depicting the dual-color optical recordings of DA1m-/DA1h-mut- and tdTomato-expressing neurons in the dorsal striatum during simultaneous optogenetic C1V1 stimulation of DANs in the SNc. (B) Representative frames of the emission spectra of DA1m/DA1h-mut and tdTomato co-expressed in the dorsal striatum. Black traces show the measured spectrum; the blue dashed traces show the fitting curves generated by a linear unmixing algorithm. (C) Representative traces showing the ratio of DA1m (black) or DA1h-mut (gray) to tdTomato coefficients in a freely moving mouse (top panel) and enlarged traces (bottom panel) in the baseline (left), 5 min after the i.p. injection of methylphenidate (10 mg/kg, middle), and 5 min after the i.p. injection of Etic (2 mg/kg, right). Black lines above indicate the time of compound administration. Yellow ticks indicate the time of optogenetic stimulation. (D and G) Averaged fluorescence changes from DA1m/DA1h-mut (green) expressed in the dorsal striatum during optogenetic stimulation of DANs in the SNc by C1V1 under indicated conditions (n = 30 trials from 6 hemispheres of 3 mice for each condition). Baseline (left), after the i.p. injection of methylphenidate (middle), and after the i.p. injection of Etic (right). The off kinetics were fitted with a single-exponential function (black traces). ΔC/C0% represents the percent change of the fluorescence coefficient of each fluorophore (see methods for details). 5 data points (measured at 0.12 s, 0.32 s, 0.52 s, 0.72 s, and 0.92 s after the onset of the stimulation pulse train) were excluded to remove the stimulation artifacts. (E) Comparison of the decay time constants of C1V1-evoked DA1m fluorescence responses between baseline group and methylphenidate group. (F and H) Comparison of the magnitude of C1V1-evoked DA1m/DA1h-mut fluorescence changes between different groups. Values with error bars indicate mean ± SEM. Student’s t-test performed; n.s., not significant; ***, p < 0.001.
Figure 6.
Figure 6.. Dopamine release in NAc measured during various training phases of an auditory Pavlovian conditioning task.
(A) Schematic for fiber photometry recording of GRABDA-expressing neurons from the NAc of a head-fixed mouse during auditory Pavlovian conditioning task. (B) Exemplar trace of DA1h signals from a trained mouse, encompassing four sequential trials. The timings of cues (CS) or water reward (US) are indicated above. (C and D) Exemplar time-aligned DA1h signals from a mouse in (C) naïve and (D) trained sessions. Note emergence of DA response to reward-predictive cue after training. (E) Group analysis of DA1h responses to water (US, left) and cue (CS, right) of both naïve and trained mice (n = 9 mice; US response: naïve N.W.: p = 0.084; naïve water: p = 0.0020; trained N.W.: p = 0.56; trained water: p = 0.0020; CS response: naïve N.W.: p = 0.37; naïve water: p = 1.0000; trained N.W.: p = 0.043; trained water: p = 0.0020). (F) Direct comparison of baseline-subtracted DA1h signals to cue (CS) (naïve: p = 0.43; trained: p = 0.0020). (G) Exemplar time-aligned pseudocolor images and averaged traces (mean shaded with ± SD) from a mouse in naïve, trained and well-trained sessions. (H) Group analysis of the normalized peak z-scores of DA1m signals to US and CS in different sessions. Each trace (coded with specific gray value) represents data from one animal (n = 3 mice; water trial US responses: p = 0.7638 between naive and trained, p = 0.0125 between naive and well-trained, p = 0.0080 between trained and well-trained; water trial CS responses: p = 0.1032 between naive and trained, p = 0.0067 between naive and well-trained, p = 0.0471 between trained and well-trained). Values with error bars indicate mean ± SEM. Signed rank test performed in (E) and (F); n.s., not significant; **, p < 0.01. Post-hoc Tukey’s test was performed in (H); n.s., not significant; *, p < 0.05; **, p < 0.01.
Figure 7.
Figure 7.. Acute DA release in the NAc measured during male sexual behaviors.
(A) Schematic depicting fiber photometry recording of DA1h-expressing neurons from the NAc of a male mouse during sexual behaviors. (B1 and B2) Representative fluorescence changes (B1) before female introduction and (B2) during sexual behaviors. The colored shades indicate different behavioral events. (C1–C5) Top, representative post-event histograms (PETHs, mean shaded with ± SEM) showing the DA1h signal aligned to onsets of various behavioral events from one mouse. Black lines show averaged PETHs of 1000× randomized controls. Bottom, the distributions of mean ΔF/F0 of randomized controls. Colored dots and arrows indicate the actual mean ΔF/F0 during the behaviors. (D1–D5) Heat map showing the PETHs of all 4 animals during various behaviors. For each animal, ΔF/F0 is normalized with the maximum value during ejaculation. (E) Group data summarizing the mean ΔF/F0 during various behaviors of all 4 animals. Error bar: ±SEM. One-way ANOVA with repeated measures. Among behaviors: F(3, 4) = 5.96. p = 0.01. (F) Each dot indicates the mean ΔF/F0 value during one behavior of one animal in reference to the values of randomized controls. Most dots are at 100%, indicating that the mean ΔF/F0 is higher than 100% of the 1000× shuffled controls. See also Fig. S6.

References

    1. Aso Y, Hattori D, Yu Y, Johnston RM, Iyer NA, Ngo TT, Dionne H, Abbott LF, Axel R, Tanimoto H , et al. (2014). The neuronal architecture of the mushroom body provides a logic for associative learning. Elife 3, e04577. - PMC - PubMed
    1. Bainton RJ, Tsai LT, Singh CM, Moore MS, Neckameyer WS, and Heberlein U (2000). Dopamine modulates acute responses to cocaine, nicotine and ethanol in Drosophila. Curr Biol 10, 187–194. - PubMed
    1. Balaji J, and Ryan TA (2007). Single-vesicle imaging reveals that synaptic vesicle exocytosis and endocytosis are coupled by a single stochastic mode. Proceedings of the National Academy of Sciences 104, 20576. - PMC - PubMed
    1. Balleine BW, Delgado MR, and Hikosaka O (2007). The role of the dorsal striatum in reward and decision-making. J Neurosci 27, 8161–8165. - PMC - PubMed
    1. Barnea G, Strapps W, Herrada G, Berman Y, Ong J, Kloss B, Axel R, and Lee KJ (2008). The genetic design of signaling cascades to record receptor activation. Proceedings of the National Academy of Sciences 105, 64–69. - PMC - PubMed

Publication types

MeSH terms