Review
. 2018 Sep;34(9):653-665.
doi: 10.1016/j.tig.2018.06.001. Epub 2018 Jul 11.

Single-Cell Multi-omics: An Engine for New Quantitative Models of Gene Regulation

Affiliations
Review

Single-Cell Multi-omics: An Engine for New Quantitative Models of Gene Regulation

Jonathan Packer et al. Trends Genet. 2018 Sep.

Abstract

Cells in a multicellular organism fulfill specific functions by enacting cell-type-specific programs of gene regulation. Single-cell RNA sequencing technologies have provided a transformative view of cell-type-specific gene expression, the output of cell-type-specific gene regulatory programs. This review discusses new single-cell genomic technologies that complement single-cell RNA sequencing by providing additional readouts of cellular state beyond the transcriptome. We highlight regression models as a simple yet powerful approach to relate gene expression to other aspects of cellular state, and in doing so, gain insights into the biochemical mechanisms that are necessary to produce a given gene expression output.


Figures

Figure 1
Figure 1. Regression modeling for CRISPR loss of function screens
a) A simplified version of Dixit et al.’s [42] regression model for analyzing CRISPR loss of function (LoF) screen data with a single cell RNA-seq readout. Gene expression, measured by log counts of unique molecular identifiers (UMIs) constitutes a cell’s phenotype, while observations of which sgRNAs were received by each cell serve as a proxy for the cell’s genotype of CRISPR edits. The regression coefficient matrix β represents the effects of LoF in the sgRNA target genes on downstream gene expression. The model is fit using LASSO (l1-regularized) regression, which encourages the coefficient matrix to be sparse (containing only a limited number of non-zero entries). In practice, the genotype and regression coefficient matrices are typically augmented with columns for experimental covariates, such as a biological replicate id, and cell-specific covariates, such as cell cycle status. Another potential adjustment to the model is to first cluster cells using a dimensionality reduction technique such as t-stochastic neighbor embedding (t-SNE) and then simplify the phenotype matrix to encode the assignment of cells to clusters instead of full gene expression profiles. b) Schematic of the CROP-seq [45] vector, which avoids the barcode swapping problem encountered by most other CRISPR screen vectors. The sgRNA is transcribed by RNA pol III from a U6 promoter. The U6 promoter and sgRNA are placed within the 3′ UTR of a puromycin resistance gene, which is transcribed by RNA pol II from an EF-1α promoter. This mRNA is recovered by sc-RNA-seq, allowing the set of sgRNAs received by each cell to be recorded. This is only a proxy for the cell’s true genotype however, as Cas9 is not guaranteed to make a loss of function edit on both alleles of a target site. c) Interpretation of the regression coefficients. If LoF in gene X decreases expression of gene Y, then functional gene X activates gene Y, and vice versa.
Figure 2
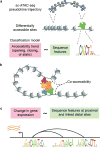
Figure 2. Regression modeling for single cell ATAC-seq
a) Sites that feature differential chromatin accessibility between sub-populations of cells in a sc-ATAC-seq experiment can be identified using pseudotime analysis or other dimensionality reduction methods. A classification model can then be used to identify sequence features that are predictive of a site being differentially accessible. Potential classifiers include a simple logistic regression model that uses transcription factor binding motifs from a database as its features, or a more complex convolutional neural network model that learns sequence features de novo. b) Data from Pliner et al. [82] suggested that distal regulatory elements and gene promoters that are accessible in the same single cells in sc-ATAC-seq data are statistically more likely to be proximal to each other in 3D space that element pairs with uncorrelated accessibility patterns. Pliner et al. developed an algorithm, Cicero, that uses co-accessibility patterns in sc-ATAC-seq data to infer the target promoters of distal regulatory elements. These distal-to-promoter links can also be directly measured using assays such as ChIA-PET [–91], promoter capture HiC [–94], and HiChIP [95,96]. c) Given a map of distal element to promoter links, one could construct a regression model that predicts gene expression based on sequence features in a gene’s promoter and distal element “neighborhood.”
Figure 3
Figure 3. Spatial gene expression analysis with in situ hybridization and sc-RNA-seq
A cartoon illustrating the analytical approach used by Halpern et al. [125], who profiled murine liver lobules with RNA FISH and sc-RNA-seq. Liver lobules are hexagonal structures with a central vein and portal veins at each vertex (shown as circles in the figure). The spatial axis of interest is the relative distance of a cell from the central vs. portal vein. Halpern et al. profiled the spatial expression patterns of a handful of “landmark genes” with FISH. The position of cells from sc-RNA-seq on the central-to-portal axis was imputed based on their expression of these landmark genes. Given the imputed cell positions, the spatial gene expression patterns of novel genes without FISH data could be estimated. Some genes, such as Hamp and Igfbp2 featured non-monotonic expression patterns, peaking in the middle between the pericentral and periportal regions.

References

    1. Macosko EZ, et al. Highly Parallel Genome-wide Expression Profiling of Individual Cells Using Nanoliter Droplets. Cell. 2015;161:1202–1214. - PMC - PubMed
    1. Shekhar K, et al. Comprehensive Classification of Retinal Bipolar Neurons by Single-Cell Transcriptomics. Cell. 2016;166:1308–1323.e30. - PMC - PubMed
    1. Joost S, et al. Single-Cell Transcriptomics Reveals that Differentiation and Spatial Signatures Shape Epidermal and Hair Follicle Heterogeneity. Cell Syst. 2016;3:221–237.e9. - PMC - PubMed
    1. Baron M, et al. A Single-Cell Transcriptomic Map of the Human and Mouse Pancreas Reveals Inter- and Intra-cell Population Structure. Cell Systems. 2016;3:346–360.e4. - PMC - PubMed
    1. Campbell JN, et al. A molecular census of arcuate hypothalamus and median eminence cell types. Nat Neurosci. 2017;20:484–496. - PMC - PubMed