. 2018 Sep:93:76-88.
doi: 10.1016/j.jaut.2018.06.006. Epub 2018 Jul 13.

Soluble antigen arrays disarm antigen-specific B cells to promote lasting immune tolerance in experimental autoimmune encephalomyelitis

Affiliations

Soluble antigen arrays disarm antigen-specific B cells to promote lasting immune tolerance in experimental autoimmune encephalomyelitis

Brittany L Hartwell et al. J Autoimmun. 2018 Sep.

Abstract

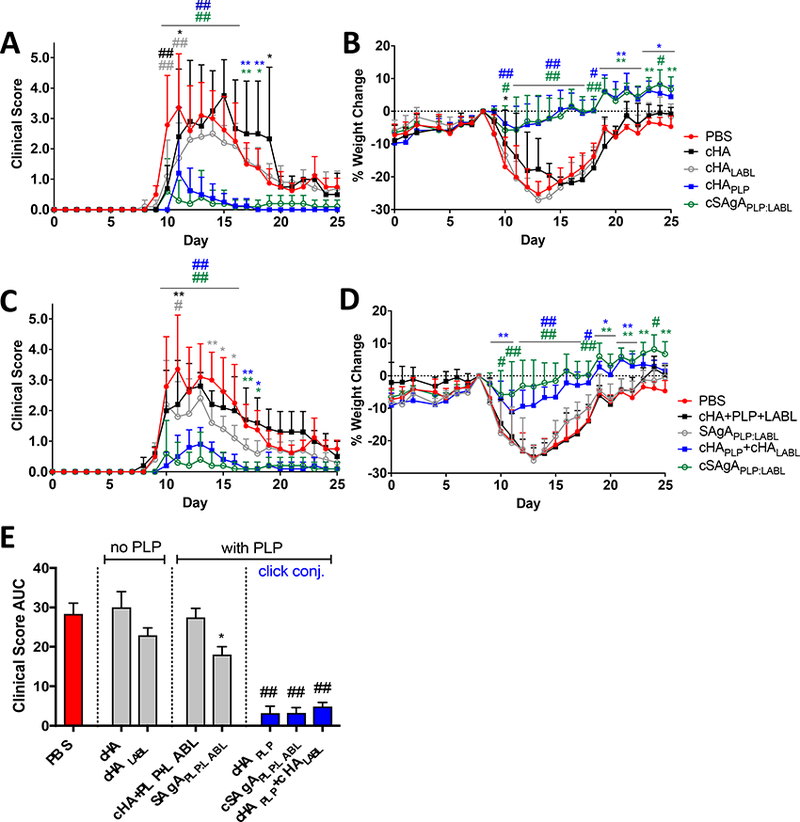
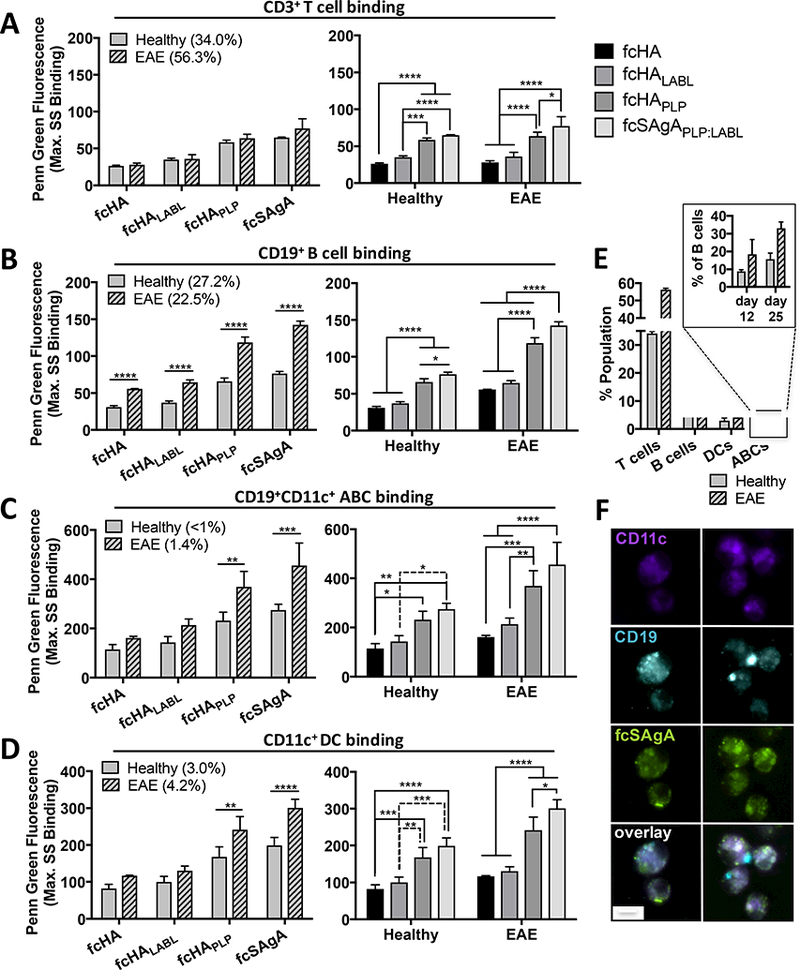
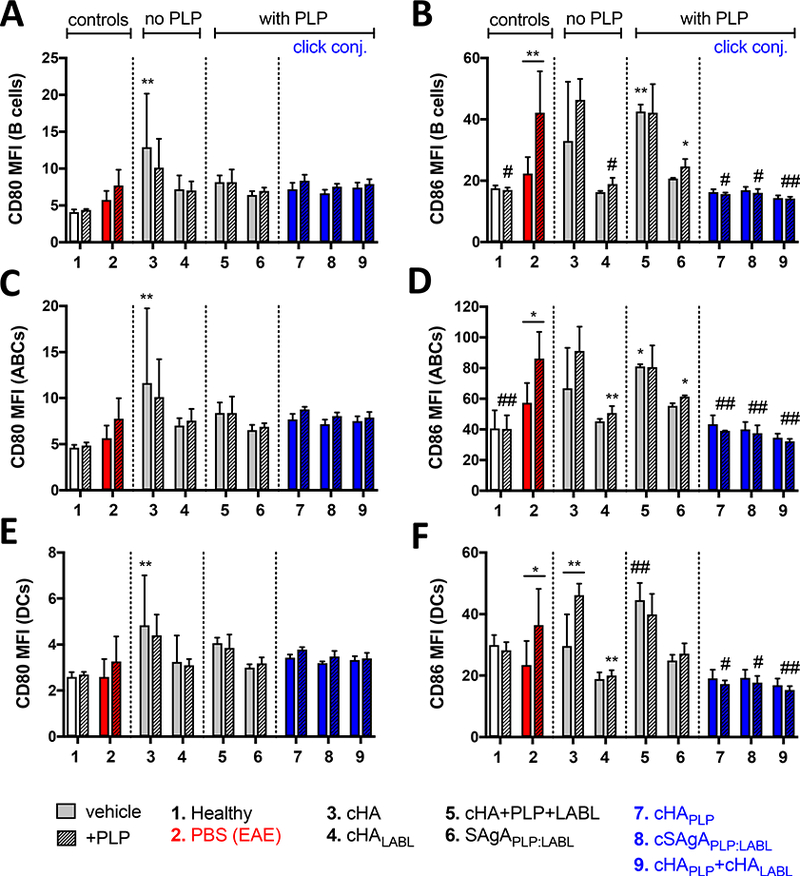
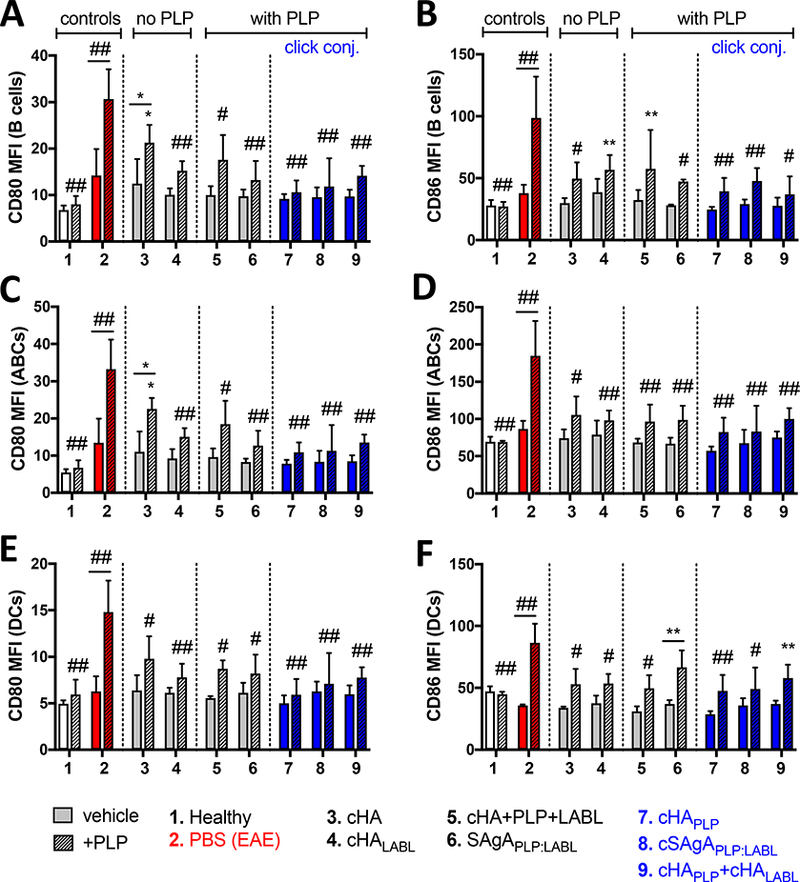
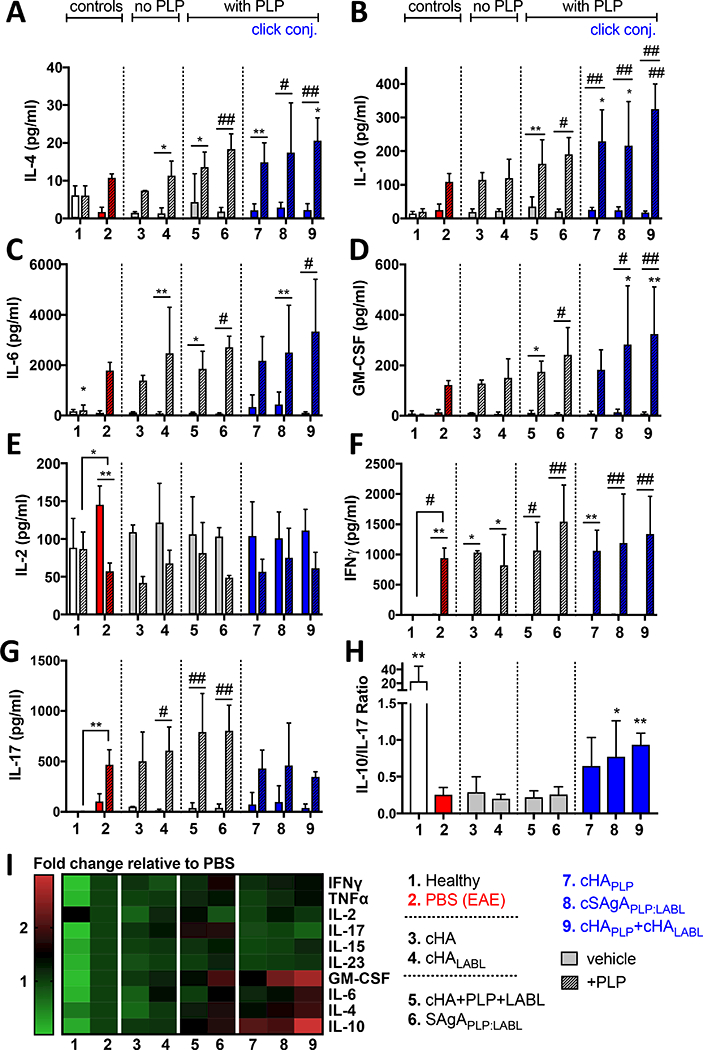
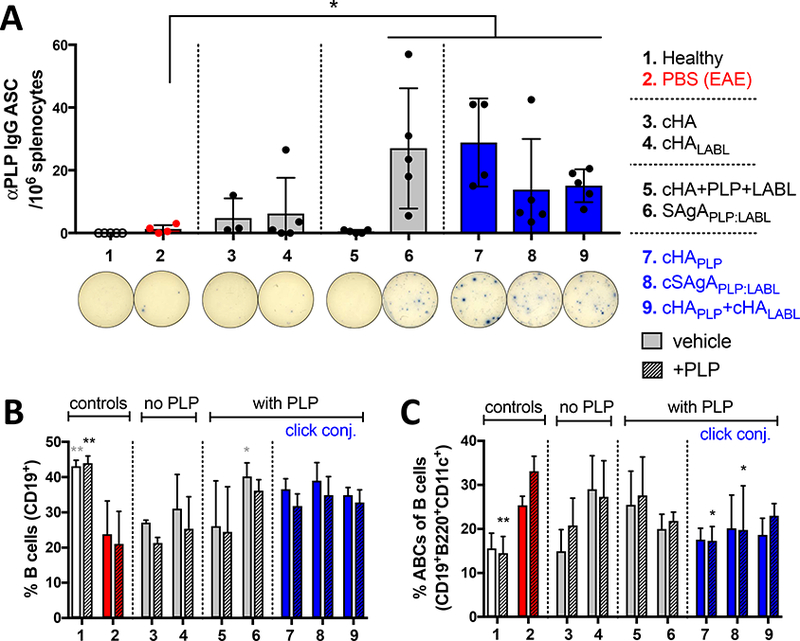
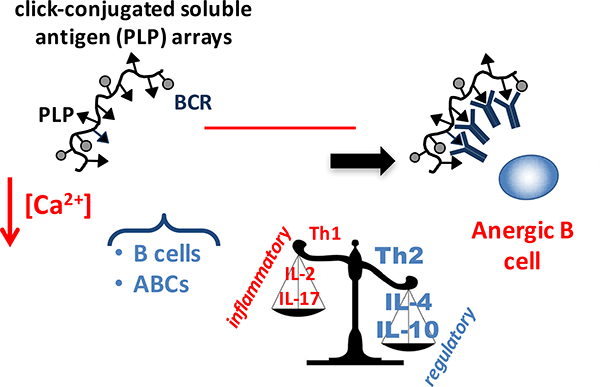
Autoreactive lymphocytes that escape central immune tolerance may be silenced via an endogenous peripheral tolerance mechanism known as anergy. Antigen-specific therapies capable of inducing anergy may restore patients with autoimmune diseases to a healthy phenotype while avoiding deleterious side effects associated with global immunosuppression. Inducing anergy in B cells may be a particularly potent intervention, as B cells can contribute to autoimmune diseases through multiple mechanisms and offer the potential for direct antigen-specific targeting through the B cell receptor (BCR). Our previous results suggested autoreactive B cells may be silenced by multivalent 'soluble antigen arrays' (SAgAs), which are polymer conjugates displaying multiple copies of autoantigen with or without a secondary peptide that blocks intracellular cell-adhesion molecule-1 (ICAM-1). Here, key therapeutic molecular properties of SAgAs were identified and linked to the immunological mechanism through comprehensive cellular and in vivo analyses. We determined non-hydrolyzable 'cSAgAs' displaying multivalent 'click'-conjugated antigen more potently suppressed experimental autoimmune encephalomyelitis (EAE) compared to hydrolyzable SAgAs capable of releasing conjugated antigen. cSAgAs restored a healthy phenotype in disease-specific antigen presenting cells (APCs) by inducing an anergic response in B cells and a subset of B cells called autoimmune-associated B cells (ABCs) that act as potent APCs in autoimmune disease. Accompanied by a cytokine response skewed towards a Th2/regulatory phenotype, this generated an environment of autoantigenic tolerance. By identifying key therapeutic molecular properties and an immunological mechanism that drives SAgA efficacy, this work guides the design of antigen-specific immunotherapies capable of inducing anergy.

Keywords: Antigen-specific B cells; Autoimmune-associated B cells; Autoimmunity; EAE; Tolerance.


Conflict of interest statement

CONFLICT OF INTEREST

C.J.B. is a co-founder and Chairman of the Board of Orion BioScience. Orion has licensed the rights to patents claiming soluble antigen arrays.

Figures

Figure 1.
Figure 1.
EAE in vivo response to click conjugates (cHA, cHALabl, cHAPLP, and cSAgAPLP:LABL) as measured by A) clinical disease score and B) percent weight loss. EAE in vivo response to groups containing both PLP and LABL (cHA+PLP+LABL, SAgAPLP:LABL, cHAPLP+cHALABL, and cSAgAPLP:LABL) as measured by C) clinical disease score and D) percent weight loss. Data represent mean ± SD (n=5); statistical significance compared to PBS negative control was determined by two-way ANOVA. E) Cumulative EAE in vivo response as measured by clinical disease score area under the curve (AUC) derived from subfigures A and C. Data represent mean ± SEM (n=5); statistical significance compared to PBS negative control was determined by ordinary one-way ANOVA followed by Dunnett’s post hoc test. (*p<0.05, **p<0.01, #p<0.001, ##p<0.0001, color coded according to group)
Figure 2.
Figure 2.
Click conjugate binding (max. SS fluorescence) in EAE versus healthy splenocyte subpopulations isolated at peak of disease (day 12), determined by flow cytometry: A) T cells (CD3+CD19), B) B cells (CD19+), C) autoimmune-associated B cells (ABCs) (CD19+CD11c+), and D) dendritic cells (DCs) (CD11c+). E) Relative subpopulation composition (% total isolated splenocytes) in healthy versus EAE splenocytes at peak of disease; subset shows ABCs as % of gated B cells on day 12 and 25. Data represent mean ± SD (n=3); statistical significance was determined by two-way ANOVA followed by Sidak’s or Tukey’s post hoc test (*p<0.05, **p<0.01, ***p<0.001, ****p<0.0001). F) Fluorescence microscopy shows high fcSAgAPLP:LABL binding (green) on EAE splenocytes that co-express CD11c (violet) and CD19 (blue), identified as ABCs. Real time binding images of live cells were captured using the M04S plate and CellASIC Onyx Microfluidics platform on an Olympus IX81 inverted Epifluorescence microscope. Magnification: 60X air. Scale bar equals 10 μm.
Figure 3.
Figure 3.
CD80/CD86 costimulatory marker expression in splenocytes isolated from EAE mice at peak of disease (day 12) followed by 72h ex vivo treatment with groups 3–9 in the presence or absence of PLP (25 μM) antigen rechallenge, determined by flow cytometry: A/B) B cells (CD19+), C/D) ABCs (CD19+B220+CD11c+), and E/F) DCs (CD11c+). Data represent mean ± SD (n=3). Statistical significance compared to PBS negative control was determined by two-way ANOVA followed by Dunnett’s post hoc test; statistical significance between +/− PLP (underlined) was determined by two-way ANOVA followed by Sidak’s post hoc test (*p<0.05, **p<0.01, #p<0.001, ##p<0.0001). MFI = mean fluorescent intensity.
Figure 4.
Figure 4.
CD80/CD86 costimulatory marker expression in splenocytes isolated from EAE mice on day 25 following in vivo treatment with groups 3–9 and 72h ex vivo antigen rechallenge +/− PLP (25 μM), determined by flow cytometry: A/B) B cells (CD19+), C/D) ABCs (CD 19+B220+CD 11c+), and E/F) DCs (CD11c+). Data represent mean ± SD (n=3). Statistical significance compared to PBS negative control was determined by two-way ANOVA followed by Dunnett’s post hoc test; statistical significance between +/− PLP (underlined) was determined by two-way ANOVA followed by Sidak’s post hoc test (*p<0.05, **p<0.01, #p<0.001, ##p<0.0001). MFI = mean fluorescent intensity.
Figure 5.
Figure 5.
Cytokine response in EAE splenocytes isolated on day 25 following in vivo treatment of EAE mice with groups 3–9 and rechallenged ex vivo +/− PLP (25 μM) for 120h: A) IL-4, B) IL-6, C) IL-10, D) GM-CSF, E) IL-2, F) IFNy, G) IL-17, H) ratio of IL-10 to IL-17 in presence of PLP (Treg:Th17 balance), I) heat map of all cytokine responses in presence of PLP (fold change relative to PBS control). Data represent mean ± SD (n=5). Statistical significance compared to PBS negative control was determined by two-way ANOVA (A-G) or ordinary one-way ANOVA (H) followed by Dunnett’s post hoc test; statistical significance between +/− PLP (underlined) was determined by twoway ANOVA followed by Sidak’s post hoc test (*p<0.05, **p<0.01, #p<0.001).
Figure 6.
Figure 6.
B cell composition and humoral response in EAE splenocytes isolated on day 25 following in vivo treatment of EAE mice with groups 3–9, compared to healthy and PBS negative controls: A) ELISPOT for PLP IgG antibody secreting cells (ASC) per 106 splenocytes, showing representative wells. Data represent mean ± SD (n=5). B/C) Splenocyte composition following in vivo treatment and 72h ex vivo antigen rechallenge +/− PLP (25 μM), determined by flow cytometry: B) % B cells (CD19+) overall, and C) % ABCs (CD19+B220+CD11c+) of gated B cells. Data represent mean ± SD (n=3). Statistical significance compared to PBS negative control was determined by paired t-test (A) or two-way ANOVA followed by Dunnett’s post hoc test (B,C) (*p<0.05, **p<0.01).
Figure 7.
Figure 7.
Schematic showing proposed therapeutic mechanism: Click-conjugated soluble antigen arrays containing PLP (cSAgAPLP:LABL, cHAPLP, and cHAPLP+cHALABL) target EAE-specific B cells and autoimmune-associated B cells (ABCs) through high avidity binding that is driven by the antigen (PLP) for the B cell receptor (BCR). The molecule is retained on the cell surface and through continuous engagement and clustering of BCR, induces B cell anergy, resulting in reduced ability to mobilize calcium and impaired BCR signaling. This leads to downregulated expression of costimulatory markers CD80 and CD86 (critical ‘signal 2’ for antigenic T cell activation) and is accompanied by a shift from a Th1/Th17 to a Th2/Treg weighted cytokine response (context ‘signal 3’ for antigenic T cell activation). Thus, the induced anergic B cell phenotype produces APCs without the capacity to activate T cells against autoantigen and results in an environment of autoantigenic tolerance.

References

    1. Kontos S; Grimm AJ; Hubbell JA, Engineering antigen-specific immunological tolerance. Curr. Opin. Immunol 2015, 35, 80–88. - PubMed
    1. Mueller DL; Jenkins MK; Schwartz RH, Clonal expansion versus functional clonal inactivation: a costimulatory signalling pathway determines the outcome of T cell antigen receptor occupancy. Annu. Rev. Immunol 1989, 7 (1), 445–480. - PubMed
    1. Feldmann M; Steinman L, Design of effective immunotherapy for human autoimmunity. Nature 2005, 435 (7042), 612. - PubMed
    1. Miller SD; Turley DM; Podojil JR, Antigen-specific tolerance strategies for the prevention and treatment of autoimmune disease. Nat. Rev. Immunol 2007, 7 (9), 665. - PubMed
    1. Mueller DL, Mechanisms maintaining peripheral tolerance. Nat. Immunol 2010,11 (1), 21–27. - PubMed

Publication types

MeSH terms