

Dynamics of the Pollen Sequestrome Defined by Subcellular Coupled Omics
- PMID: 30007911
- PMCID: PMC6130014
- DOI: 10.1104/pp.18.00648
Dynamics of the Pollen Sequestrome Defined by Subcellular Coupled Omics
Abstract
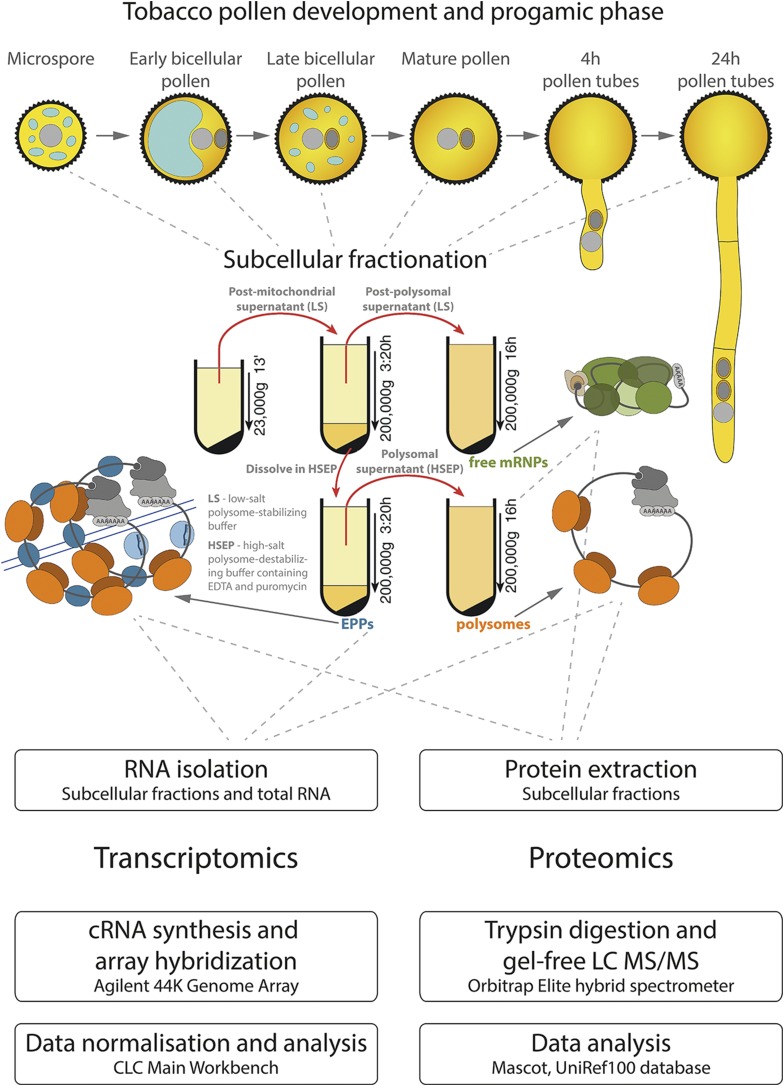
Reproduction success in angiosperm plants depends on robust pollen tube growth through the female pistil tissues to ensure successful fertilization. Accordingly, there is an apparent evolutionary trend to accumulate significant reserves during pollen maturation, including a population of stored mRNAs, that are utilized later for a massive translation of various proteins in growing pollen tubes. Here, we performed a thorough transcriptomic and proteomic analysis of stored and translated transcripts in three subcellular compartments of tobacco (Nicotiana tabacum), long-term storage EDTA/puromycin-resistant particles, translating polysomes, and free ribonuclear particles, throughout tobacco pollen development and in in vitro-growing pollen tubes. We demonstrated that the composition of the aforementioned complexes is not rigid and that numerous transcripts were redistributed among these complexes during pollen development, which may represent an important mechanism of translational regulation. Therefore, we defined the pollen sequestrome as a distinct and highly dynamic compartment for the storage of stable, translationally repressed transcripts and demonstrated its dynamics. We propose that EDTA/puromycin-resistant particle complexes represent aggregated nontranslating monosomes as the primary mediators of messenger RNA sequestration. Such organization is extremely useful in fast tip-growing pollen tubes, where rapid and orchestrated protein synthesis must take place in specific regions.
© 2018 American Society of Plant Biologists. All rights reserved.
Figures
Similar articles
-
Cytoskeleton-associated large RNP complexes in tobacco male gametophyte (EPPs) are associated with ribosomes and are involved in protein synthesis, processing, and localization.J Proteome Res. 2009 Apr;8(4):2015-31. doi: 10.1021/pr8009897. J Proteome Res. 2009. PMID: 19714881
-
Analysis of Exocyst Subunit EXO70 Family Reveals Distinct Membrane Polar Domains in Tobacco Pollen Tubes.Plant Physiol. 2017 Mar;173(3):1659-1675. doi: 10.1104/pp.16.01709. Epub 2017 Jan 12. Plant Physiol. 2017. PMID: 28082718 Free PMC article.
-
Transcriptome and Metabolome Analyses Reveal a Complex Stigma Microenvironment for Pollen Tube Growth in Tobacco.Int J Mol Sci. 2024 Nov 14;25(22):12255. doi: 10.3390/ijms252212255. Int J Mol Sci. 2024. PMID: 39596319 Free PMC article.
-
Developmental biology of dispersed pollen grains.Int J Dev Biol. 2020;64(1-2-3):7-19. doi: 10.1387/ijdb.190166ks. Int J Dev Biol. 2020. PMID: 32659021 Review.
-
Proteomics of pollen development and germination.J Proteome Res. 2007 Dec;6(12):4556-63. doi: 10.1021/pr070474y. Epub 2007 Oct 25. J Proteome Res. 2007. PMID: 17958392 Review.
Cited by
-
Characterization of ALBA Family Expression and Localization in Arabidopsis thaliana Generative Organs.Int J Mol Sci. 2021 Feb 6;22(4):1652. doi: 10.3390/ijms22041652. Int J Mol Sci. 2021. PMID: 33562109 Free PMC article.
-
Bioimaging insights into structural pathways of cell-to-cell communication within the male (MGU) and female (FGU) germ units of Arabidopsis thaliana.Plant Cell Rep. 2025 Feb 14;44(3):56. doi: 10.1007/s00299-025-03441-w. Plant Cell Rep. 2025. PMID: 39953194 Free PMC article.
-
LARP6C orchestrates posttranscriptional reprogramming of gene expression during hydration to promote pollen tube guidance.Plant Cell. 2021 Aug 31;33(8):2637-2661. doi: 10.1093/plcell/koab131. Plant Cell. 2021. PMID: 34124761 Free PMC article.
-
Possible molecular mechanisms of persistent pollen tube growth without de novo transcription.Front Plant Sci. 2022 Nov 24;13:1020306. doi: 10.3389/fpls.2022.1020306. eCollection 2022. Front Plant Sci. 2022. PMID: 36507386 Free PMC article.
-
Transformation of Seed Non-Transmissible Hop Viroids in Nicotiana benthamiana Causes Distortions in Male Gametophyte Development.Plants (Basel). 2021 Nov 6;10(11):2398. doi: 10.3390/plants10112398. Plants (Basel). 2021. PMID: 34834761 Free PMC article.
References
-
- Autran D, Baroux C, Raissig MT, Lenormand T, Wittig M, Grob S, Steimer A, Barann M, Klostermeier UC, Leblanc O, et al. (2011) Maternal epigenetic pathways control parental contributions to Arabidopsis early embryogenesis. Cell 145: 707–719 - PubMed
-
- Barbez E, Kubeš M, Rolčík J, Béziat C, Pěnčík A, Wang B, Rosquete MR, Zhu J, Dobrev PI, Lee Y, et al. (2012) A novel putative auxin carrier family regulates intracellular auxin homeostasis in plants. Nature 485: 119–122 - PubMed
Publication types
MeSH terms
Substances
LinkOut - more resources
Full Text Sources
Other Literature Sources
Molecular Biology Databases
