. 2018 Jul 16;17(1):97.
doi: 10.1186/s12943-018-0846-5.

Transcriptome reprogramming by cancer exosomes: identification of novel molecular targets in matrix and immune modulation

Affiliations

Transcriptome reprogramming by cancer exosomes: identification of novel molecular targets in matrix and immune modulation

Fatima Qadir et al. Mol Cancer. .

Abstract

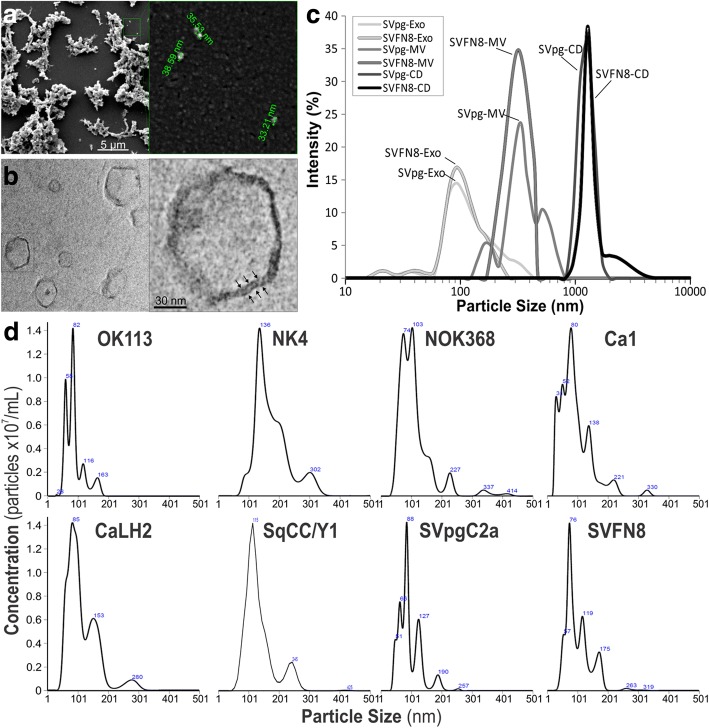
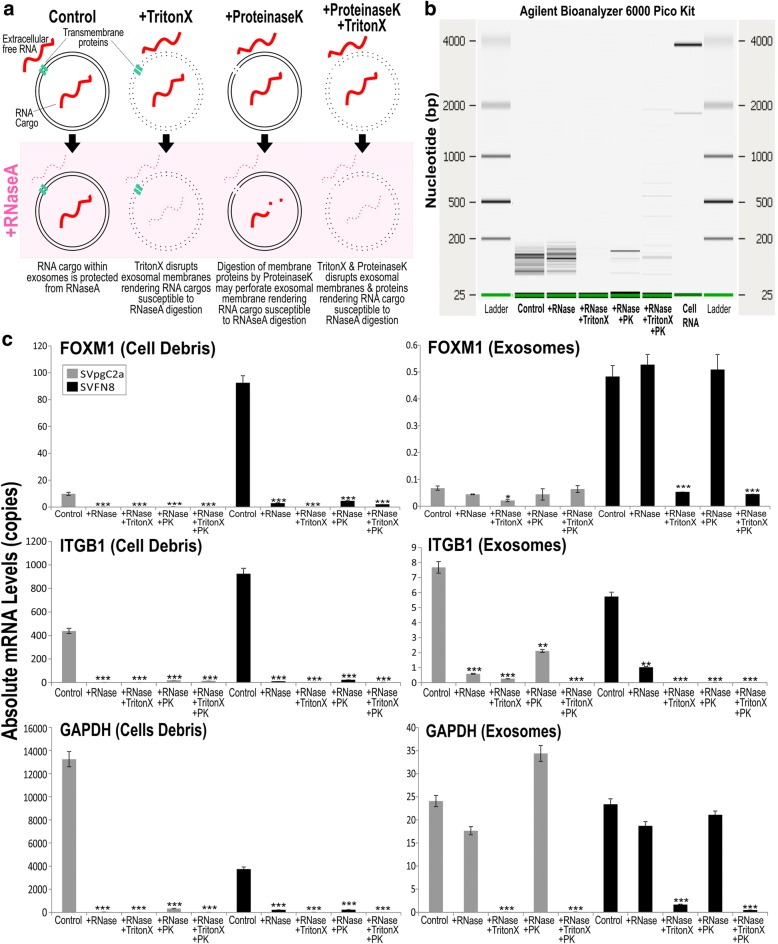
Background: Exosomes are extracellular vesicles released by almost all cell types, including cancer cells, into bodily fluids such as saliva, plasma, breast milk, semen, urine, cerebrospinal fluid, amniotic fluid, synovial fluid and sputum. Their key function being intercellular communication with both neighbouring as well as distant cells. Cancer exosomes have been shown to regulate organ-specific metastasis. However, little is known about the functional differences and molecular consequences of normal cells responding to exosomes derived from normal cells compared to those derived from cancer cells.

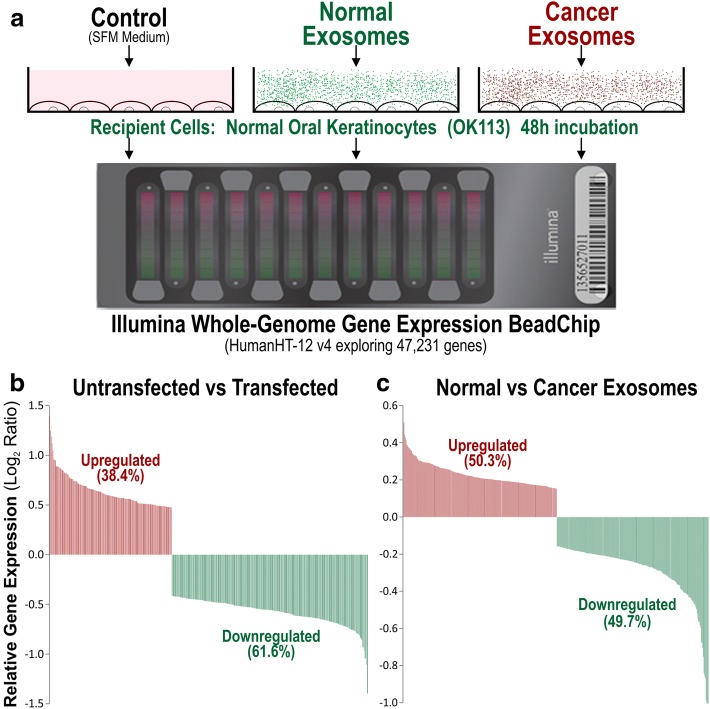
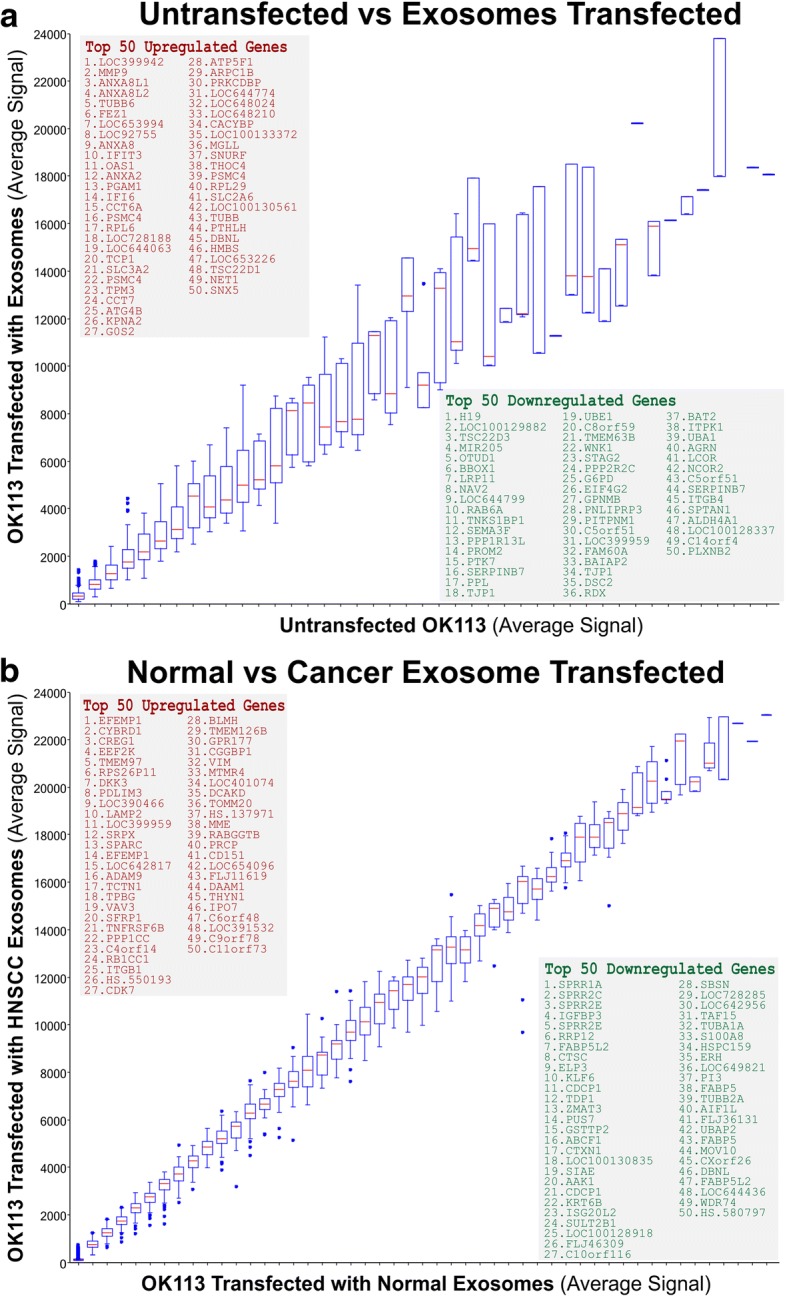
Methods: Here, we characterised and compared the transcriptome profiles of primary human normal oral keratinocytes (HNOK) in response to exosomes isolated from either primary HNOK or head and neck squamous cell carcinoma (HNSCC) cell lines.

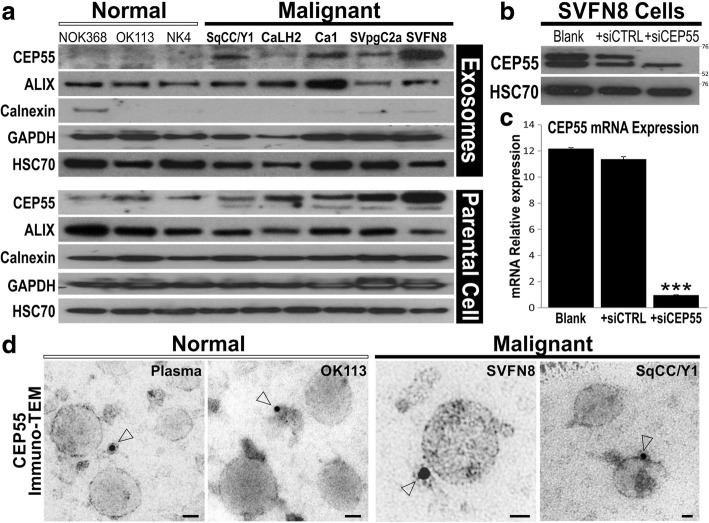
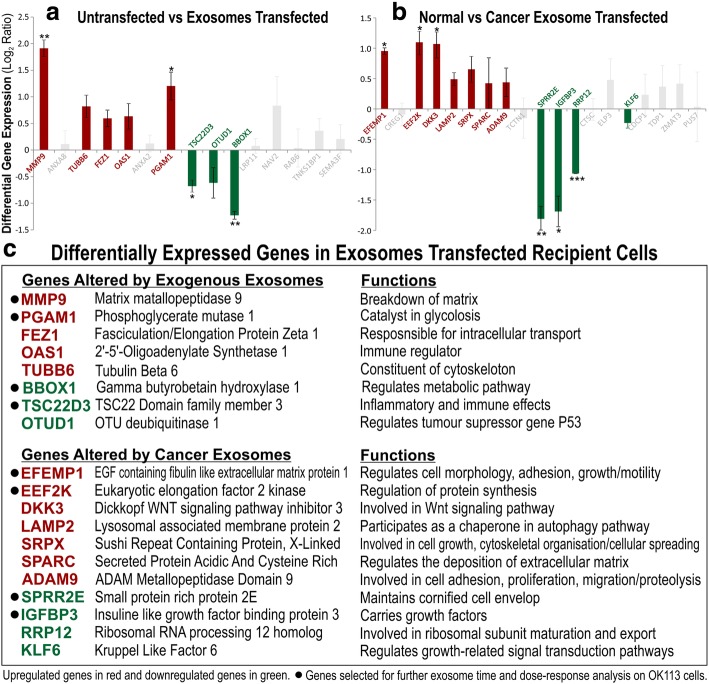
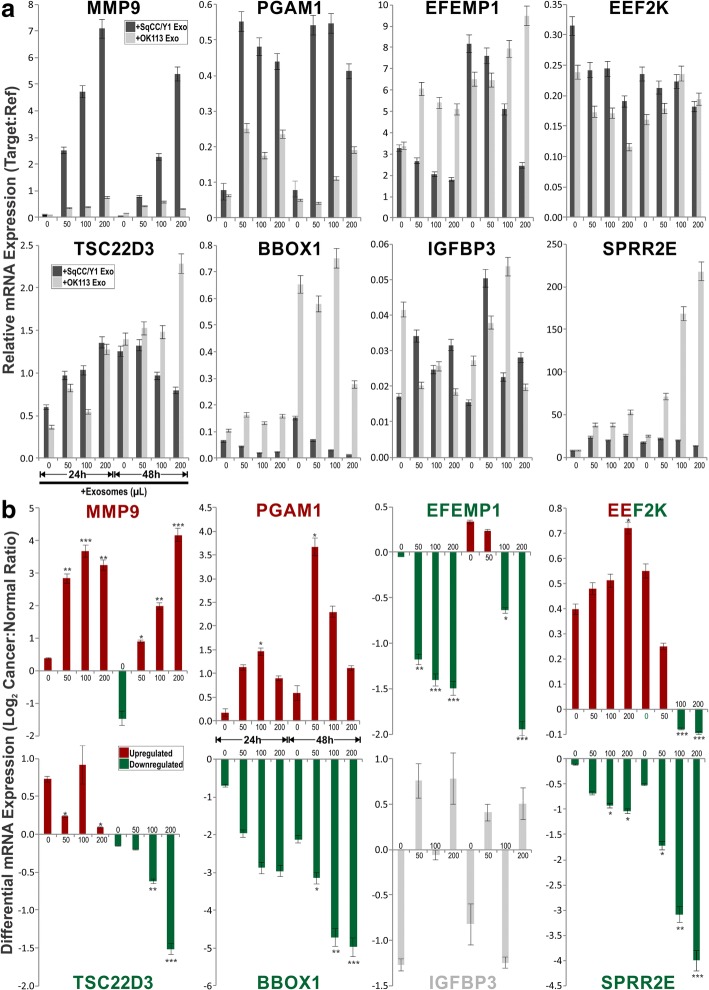
Results: In recipient HNOK cells, we found that regardless of normal or cancer derived, exosomes altered molecular programmes involved in matrix modulation (MMP9), cytoskeletal remodelling (TUBB6, FEZ1, CCT6A), viral/dsRNA-induced interferon (OAS1, IFI6), anti-inflammatory (TSC22D3), deubiquitin (OTUD1), lipid metabolism and membrane trafficking (BBOX1, LRP11, RAB6A). Interestingly, cancer exosomes, but not normal exosomes, modulated expression of matrix remodelling (EFEMP1, DDK3, SPARC), cell cycle (EEF2K), membrane remodelling (LAMP2, SRPX), differentiation (SPRR2E), apoptosis (CTSC), transcription/translation (KLF6, PUS7). We have also identified CEP55 as a potential cancer exosomal marker.

Conclusions: In conclusion, both normal and cancer exosomes modulated unique gene expression pathways in normal recipient cells. Cancer cells may exploit exosomes to confer transcriptome reprogramming that leads to cancer-associated pathologies such as angiogenesis, immune evasion/modulation, cell fate alteration and metastasis. Molecular pathways and biomarkers identified in this study may be clinically exploitable for developing novel liquid-biopsy based diagnostics and immunotherapies.

Keywords: Biomarkers; CEP55; ESCRT, exosomes; Extracellular vesicles; FOXM1; Reprogramming.


Conflict of interest statement

Ethics approval and consent to participate

Not applicable.

Consent for publication

Not applicable.

Competing interests

The authors declare that they have no competing interests.

Publisher’s Note

Springer Nature remains neutral with regard to jurisdictional claims in published maps and institutional affiliations.

Figures

Fig. 1
Fig. 1
Physical characterisation of exosomal size and concentrations. a scanning electron microscopy at low magnification (left panel) and a subset showing high magnification (right panel) showing approximate diameters of each particle. b Transmission electron microscopy at low magnification (left panel) and a subset showing high magnification (right panel), note the arrows indicating lipid-bilayer membrane structure. c Zetasizer measurements on exosomes (Exo), microvesicles (MV) and cell debris (CD) fractions of two cell lines SVpgC2a and SVFN8. d NanoSight particle analysis on exosomes derived from 3 normal primary human oral keratinocytes (OK113, NK4 and NOK368) and 5 malignant (Ca1, CaLH2, SqCC/Y1, SVpgC2a and SVFN8) HNSCC cell lines. Numbers indicated within the diagram indicates the peak size (nm)
Fig. 2
Fig. 2
Differential expression of CEP55 in normal and cancer derived exosomes. a Immunoblotting for exosomal proteins in normal (NOK368, OK113, NK4) and malignant (SqCC/Y1, CaLH2, Ca1, SVpgC2a, SVFN8) cell-derived exosomes (top panel) and parental cells (bottom panel). ALIX, exosomal protein; Calnexin, endosomal protein; GAPDH and HSC70 were used as loading controls. b Verification of CEP55 antibody specificity using siRNA on SVFN8 cell line which expresses high levels of CEP55. HSC70 was used as a loading control. c RT-qPCR confirmed that siCEP55, but not siCTRL, significantly (***P < 0.001) knocked down the mRNA of CEP55 in SVFN8. d CEP55 protein localisation studying using immunogold-transmission electron microscopy on exosomes derived from normal human plasma, OK113, SVFN8 and SqCC/Y1 as indicated. Open arrow heads indicate CEP55 protein gold labels (< 15 nm diameter including the halo around each black dot). Scale bars represent 30 nm
Fig. 3
Fig. 3
RNA cargo of exosomes is protected from RNase. a schematics showing that RNA molecules are protected within intact exosomal membranes which is resistant to RNase activity. TritonX disrupts exosomal membranes and thereby rendering RNA cargos susceptible to RNase digestion. Digestion of membrane ProteinaseK may perforate membrane proteins thereby rendering RNA cargo susceptible to RNase digestion. b Exosomal RNA quantification and quality confirmation (using Agilent BioAnalyzer 6000 Pico Kit) showing that majority of exosomal RNA are below 200 bp and are resistant to RNase digestion until addition of TritonX and/or ProteinaseK. c RT-qPCR confirmed differential mRNA sorting into exosomes. FOXM1, but not ITGB1, were found to be specifically packaged within exosomes (therefore resistant to RNase digestion). FOXM1 (isoform B) is constitutively overexpressed in SVFN8 cell line. ***P < 0.001 indicates statistically different from control
Fig. 4
Fig. 4
Genome-wide gene expression analysis on normal primary human oral keratinocytes transfected by normal or cancer-derived exosomes. a OK113 cells were transfected by equal concentration (2 × 1010 particles/well) of each type of exosomes for 48 h prior to microarray analysis using Illumina Human HT-12 v4 Gene Expression BeadChip, exploring 47,231 genes. b Within the top 400 differentially expressed genes (P < 10− 20), exosome (both normal and cancer) exposure led to larger proportion of downregulated genes (61.6%) compared with upregulated genes (38.4%) in recipient cells. c Within the top 400 differentially expressed genes (P < 10− 2), cancer and normal exosomes induced almost equal proportion (50.3 vs 49.7%) of differentially expressed genes in recipient cells
Fig. 5
Fig. 5
Genome-wide differential gene expression analysis on normal primary human oral keratinocytes transfected by normal or cancer-derived exosomes. a Correlation box-whisker plot between untransfected vs exosome (including both normal and cancer exosomes) transfected gene expression profiles. b Correlation box-whisker plot between normal vs cancer exosome transfected gene expression profiles. Insets showing top 50 upregulated and top 50 downregulated genes, respectively
Fig. 6
Fig. 6
Verification of candidate gene differential expression using RT-qPCR on recipient OK113 cells. a Each bar represents differential mean ± SEM gene expression (Log2 Ratio) of 8 exosomes (NOK368, OK113, NK4, SqCC/Y1, CaLH2, Ca1, SVpgC2a, SVFN8)-transfected OK113 compared with untransfected OK113. b Each bar represents differential mean ± SEM gene expression (Log2 Ratio) of 5 cancer exosomes (SqCC/Y1, CaLH2, Ca1, SVpgC2a, SVFN8)-transfected OK113 vs 3 normal exosomes (NOK368, OK113, NK4)-transfected OK113. Coloured bars (red for upregulated and green for downregulated genes) represent differential expression patterns correlated with results obtained by microarray experiments in Fig. 5. Grey bars represent insignificant and/or discordance expression patterns with results obtained by microarray. Statistical t-test *P < 0.05, **P < 0.01 and ***P < 0.001. c table listing all validated candidate genes with brief description of their putative functions. Further 8 genes were selected for exosome time and dose-response analysis on OK113 cells in Fig. 7
Fig. 7
Fig. 7
Exosome time and dose-response effects on candidate genes (selected from Fig. 6) analysis on primary normal human oral keratinocytes (OK113). OK113 cells were transfected by different doses (0, 50, 100, 200 μL) of exosomes derived from either OK113 or SqCC/Y1 HNSCC cells. Transfected OK113 cells were harvested at two time points (24 h and 48 h) and RT-qPCR were performed to measure each target gene relative expression. a Each bar represents mean ± SEM of relative gene expression (target:reference genes) at each exosome transfection time and dose as indicated. b Each bar, derived from data presented in panel a, represents mean ± SEM of differential gene expression (Log2 Cancer:Normal Ratio) between SqCC/Y1:OK113 exosome transfected OK113 cells at each time and dose of exosomes. Statistical t-test *P < 0.05, **P < 0.01 and ***P < 0.001

Similar articles

Cited by

References

    1. Choi DS, Kim DK, Kim YK, Gho YS. Proteomics of extracellular vesicles: exosomes and ectosomes. Mass Spectrom Rev. 2015;34:474–490. doi: 10.1002/mas.21420. - DOI - PubMed
    1. Valadi H, Ekstrom K, Bossios A, Sjostrand M, Lee JJ, Lotvall JO. Exosome-mediated transfer of mRNAs and microRNAs is a novel mechanism of genetic exchange between cells. Nat Cell Biol. 2007;9:654–659. doi: 10.1038/ncb1596. - DOI - PubMed
    1. Thakur BK, Zhang H, Becker A, Matei I, Huang Y, Costa-Silva B, Zheng Y, Hoshino A, Brazier H, Xiang J, et al. Double-stranded DNA in exosomes: a novel biomarker in cancer detection. Cell Res. 2014;24:766–769. doi: 10.1038/cr.2014.44. - DOI - PMC - PubMed
    1. Baietti MF, Zhang Z, Mortier E, Melchior A, Degeest G, Geeraerts A, Ivarsson Y, Depoortere F, Coomans C, Vermeiren E, et al. Syndecan-syntenin-ALIX regulates the biogenesis of exosomes. Nat Cell Biol. 2012;14:677–685. doi: 10.1038/ncb2502. - DOI - PubMed
    1. Hemler ME. Tetraspanin functions and associated microdomains. Nat Rev Mol Cell Biol. 2005;6:801–811. doi: 10.1038/nrm1736. - DOI - PubMed

Publication types

MeSH terms