. 2018 Jul 10;11(1):142-156.
doi: 10.1016/j.stemcr.2018.06.003. Epub 2018 Jun 28.

Low Cell-Matrix Adhesion Reveals Two Subtypes of Human Pluripotent Stem Cells

Affiliations

Low Cell-Matrix Adhesion Reveals Two Subtypes of Human Pluripotent Stem Cells

Leqian Yu et al. Stem Cell Reports. .

Abstract

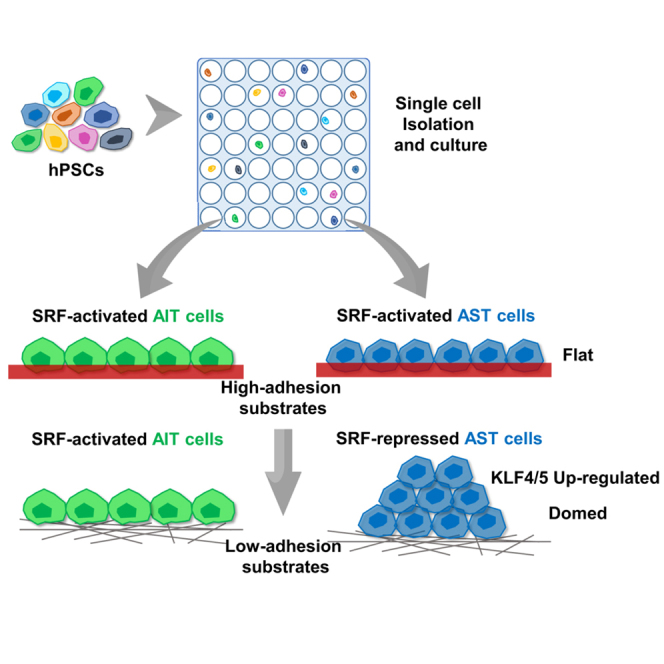
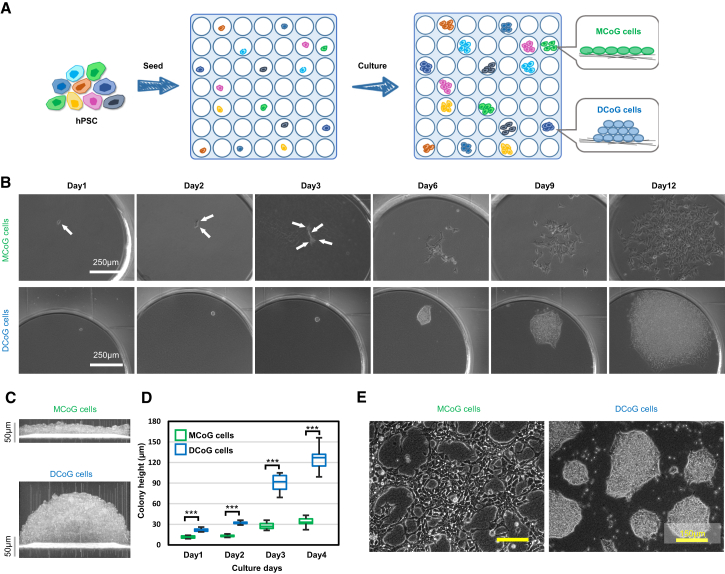
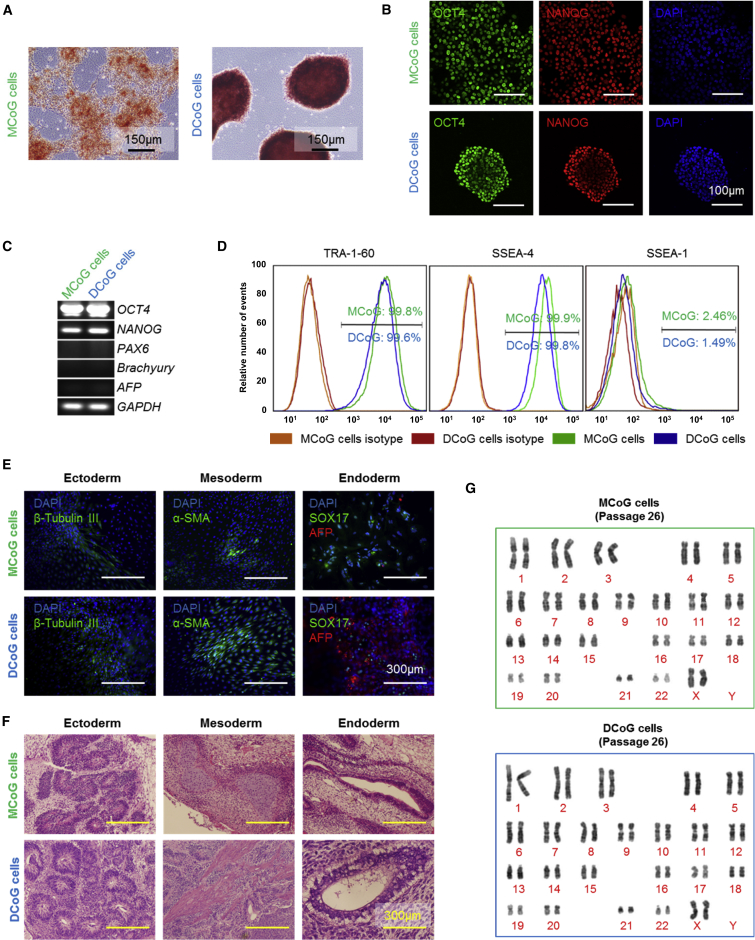
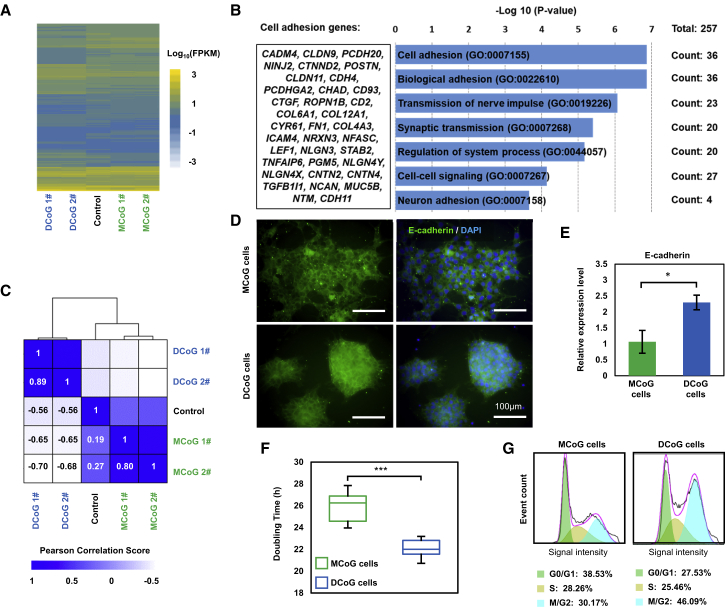
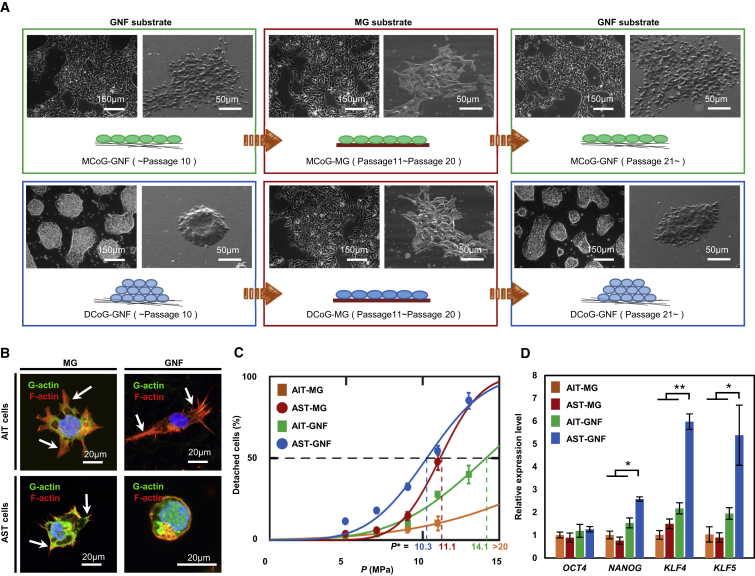
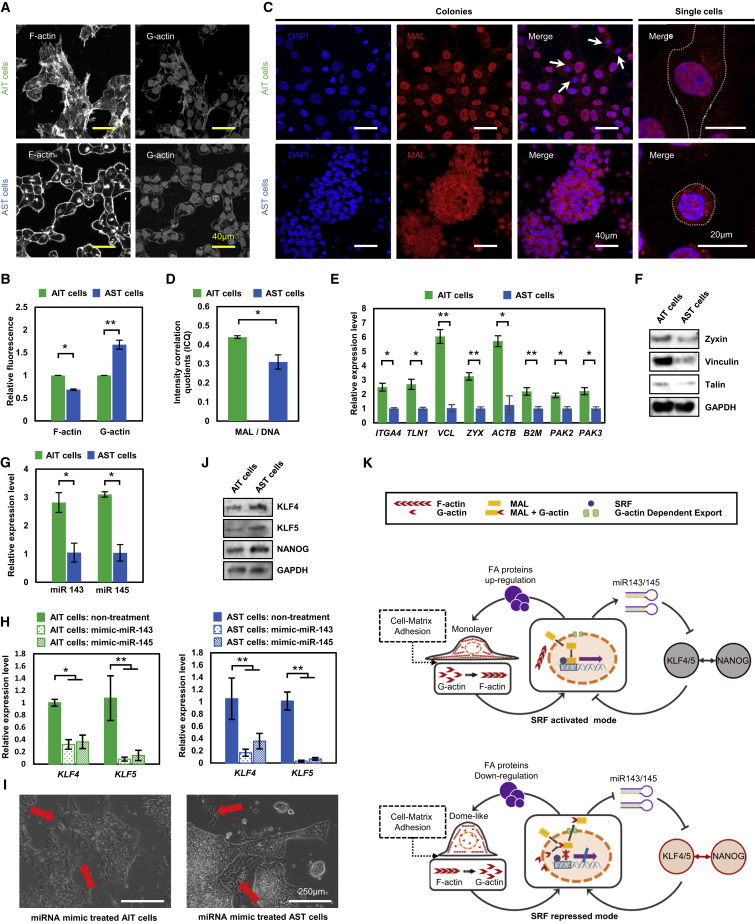
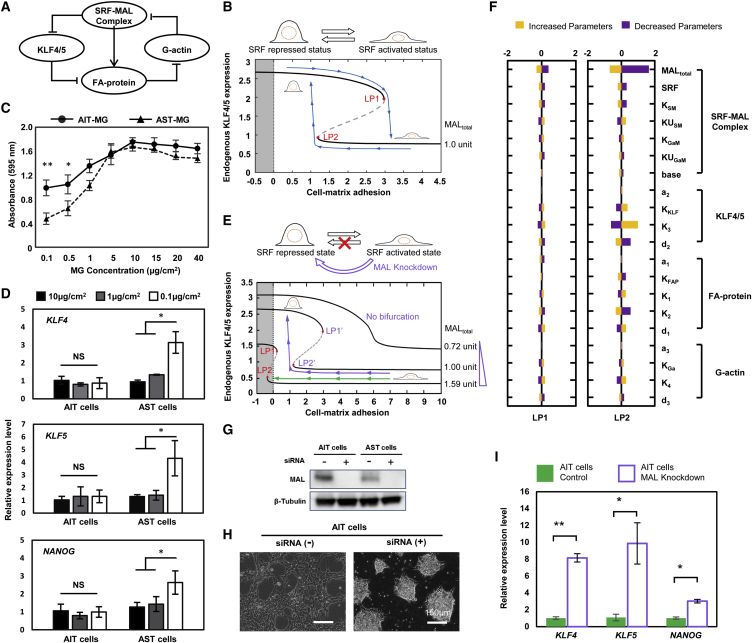
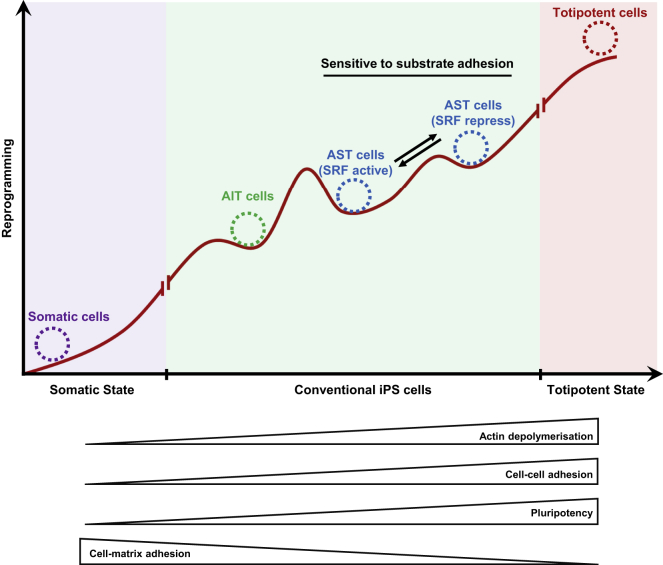
We show that a human pluripotent stem cell (hPSC) population cultured on a low-adhesion substrate developed two hPSC subtypes with different colony morphologies: flat and domed. Notably, the dome-like cells showed higher active proliferation capacity and increased several pluripotent genes' expression compared with the flat monolayer cells. We further demonstrated that cell-matrix adhesion mediates the interaction between cell morphology and expression of KLF4 and KLF5 through a serum response factor (SRF)-based regulatory double loop. Our results provide a mechanistic view on the coupling among adhesion, stem cell morphology, and pluripotency, shedding light on the critical role of cell-matrix adhesion in the induction and maintenance of hPSC.

Keywords: cell-matrix adhesion; heterogeneity; human pluripotent stem cells; mathematical model; nanofiber; serum response factor; single-cell culture; stem cell morphology.


Figures

None
Graphical abstract
Figure 1
Figure 1
Two Subtypes of Clones Exist in an hPSC Population (A) Schematic representation of single-cell dissociation and culture strategy. In the following figures, green represents MCoG cells and blue represents DCoG cells. (B) Single hPSCs grew into multicellular clones during the culture course from day 1 to 12. These clones demonstrated two types of morphologies: flat monolayer cells (top panel) and domed-multilayer cells (bottom panel). To prevent single-cell apoptosis, ROCK inhibitor (10 μM) was added on the first 5 days and removed from day 6. White arrows indicate the individual cells. (C) Cross-section images of colonies of two types of cells were observed by optical coherence tomography (OCT) microscopy system in real time. (D) The colony height of MCoG and DCoG cells on culture days 1, 2, 3, and 4 (ROCK inhibitor was removed from day 2) (mean ± SD, n = 10 independent biological replicates, ∗∗∗p < 0.001). Colonies height were measured by OCT microscopy system. (E) The bright-field images of two types of clones after 27 passages on GNF substrate, showing maintained morphologies, respectively. See also Figures S1 and S2.
Figure 2
Figure 2
The Two Types of Cells Are Both Pluripotent (A) The images indicated that both MCoG and DCoG cells formed colonies and expressed AP. (B) NANOG and OCT4 were expressed both in MCoG and DCoG cells after 26 passages. (C) RT-PCR analysis of expression of pluripotency genes (OCT4 and NANOG) and differentiation genes (PAX6, ectoderm; BRACHYURY, mesoderm; and AFP, endoderm) in MCoG and DCoG cells. (D) Flow cytometric analysis of pluripotency markers in MCoG and DCoG cells. The 50,000 cells analyzed express high levels of hPSC-specific cell surface markers (TRA-1-60, SSEA-4) and low levels of differentiation-specific cell surface markers (SSEA-1). (E) Embryoid bodies formed by MCoG and DCoG cells differentiated into the three germ layers: ectoderm (β-tubulin), mesoderm (α-SMA), and endoderm (SOX17 and AFP). (F) Teratomas formed by MCoG and DCoG cells in severe combined immunodeficiency mice, containing tissues that are representative of all three embryonic germ layers. (G) Normal karyotype exhibited in both MCoG and DCoG cells. See also Figure S3.
Figure 3
Figure 3
The Differences between the Two Types of Cells (A) Heatmap showing the expression levels (log10 transformed FPKM value) of standard PSC population (Control) compared with MCoG and DCoG cells. (B) Gene ontology (GO) categories significantly enriched for genes downregulated in DCoG cells compared with MCoG cells. The genes with fold change > 2 and p < 0.05 were analyzed, and the genes of the top 1 enriched term are listed in the left column. (C) Heatmap showing the hierarchically clustered correlation matrix resulting from comparing the expression values for each samples (MCoG and DCoG cells, and standard PSC population). Data are correlated using Pearson correlation. (D) Immunofluorescence images of MCoG and DCoG cells cultured on GNF substrates on day 3. E-Cadherin is expressed and surrounds the cell body. (E) Relative expression of E-cadherin in MCoG and DCoG cells cultured on GNF substrates on day 3 (mean ± SD, n = 3 independent experiments, p < 0.05). (F) Doubling time of MCoG and DCoG cells from 10 passages (n = 10 passages, ∗∗∗p < 0.001). (G) Increased S and M/G2 phases population in DCoG cells. The cell cycles of MCoG and DCoG cells are analyzed by flow cytometric analysis (50,000 cells were analyzed) after propidium iodide staining. To avoid the interference of ROCK inhibitor on cell adhesion, data in this figure were obtained more than 48 hr after withdrawal of the ROCK inhibitor from cell cultures. See also Figure S4 and Table S1.
Figure 4
Figure 4
Substrate Regulates Cell Shape and Gene Expression (A) Morphology change of MCoG cells and DCoG cells on different substrates during long-term passage. In each condition, the left panel is the phase contrast image and the right panel is the SEM image. (B) Immunofluorescence images of single AIT and AST cells on the MG and GNF substrates, respectively. White arrows indicate cells engaged in spreading. (C) Fraction of detached cells plotted as a function of hydrodynamic pressure P. Data points were fitted with the cumulative distribution function of normal distribution, and the critical pressure P was determined as the required pressure at which 50% of cells were detached (mean ± SE, n ≥ 500 cells). Four conditions are investigated: AIT cells on MG (orange), AST cells on MG (red), AIT cells on GNF (green), and AST cells on GNF (blue). (D) Relative expression of hPSC-specific genes in AIT and AST cells on MG and GNF substrates (mean ± SD, n ≥ 3 independent experiments, p < 0.05, ∗∗p < 0.01). To avoid the interference of ROCK inhibitor on cell adhesion, data in this figure were obtained more than 48 hr after withdrawal of the ROCK inhibitor from cell cultures. See also Figure S5.
Figure 5
Figure 5
A Regulatory Circuitry in AST and AIT Cells (A) Immunofluorescence images of F-actin and G-actin in AIT and AST cells on the GNF substrate. Confocal microscopy images show the basal surface. (B) Quantification of F-actin and G-actin levels 2 hr after seeding. Total integrated fluorescence of phalloidin (anti-F-actin) and DNaseI (anti-G-actin) was normalized to the fluorescence of AIT cells (mean ± SD, n = 3 independent biological replicates, p < 0.05, ∗∗p < 0.01). (C) MAL localization in AIT and AST at the colony and single-cell levels. White arrows indicate dividing cells with a disassembled nuclear membrane and MAL distributed in the whole cell bodies. (D) The intensity correlation quotients (ICQ) indicating the colocalization of MAL and the nucleus in AIT and AST cells (mean ± SD, n = 3 independent biological replicates, p < 0.05). (E) Relative expression of focal adhesion genes with 2-fold or larger changes in AIT and AST cells. These genes were selected from 84 genes involved in cellular adhesion (mean ± SD, n = 3 independent experiments, p < 0.05, ∗∗p < 0.01). (F) Western blot of SRF targeted focal adhesion proteins: zyxin, vinculin, and talin in AIT and AST cells. (G) Relative expression of miRNA143 and miRNA145 in AIT and AST cells (mean ± SD, n = 3 independent experiments, p < 0.05). (H) The relative expression of KLF4 and KLF5 in AIT and AST cells under self-renewal conditions at 48 hr after transfection of miRNA-mimic-miR143 and 145 (mean ± SD, n = 3 independent biological replicates, p < 0.05, ∗∗p < 0.01). (I) Phase contrast images of AIT and AST cells at 72 hr after miR143/145-mimic transfection. The cells undergoing differentiation could be observed (red arrows), and the AST cells formed heterogeneous colonies with both flat and domed morphology. Scale bars, 250 μm. (J) Western blot analysis of KLF4, KLF5, and NANOG expression in AIT and AST cells on GNF substrates. (K) SRF-based double-loop-coupling cell morphology, adhesion property, and the expression of KLF4/5 and NANOG. To avoid the interference of ROCK inhibitor on cell adhesion, data in this figure were obtained more than 48 hr after withdrawal of the ROCK inhibitor from cell cultures. See also Figure S6.
Figure 6
Figure 6
Positive Feedback Loop Makes a Bi-stable Switch (A) The core regulatory network of the SRF-mediated double loop, comprising KLF4/5, MAL-SRF complex, focal adhesion proteins, and G-actin. (B) Bifurcation diagram of the KLF4/5 expression level as a function of the cell-matrix adhesion, for a MAL expression level approximately corresponding to that of the AST cells. Solid black lines represent stable cell states, with the SRF-repressed state in the upper branch and the SRF-activated state in the lower branch. For cell-matrix adhesion between the two limiting points LP1 and LP2, the cell can be in either of the two stable states. With changes of cell-matrix adhesion, the cell can switch between the two states reversibly. The region of negative substrate adhesion (gray bar) is unreachable. Blue line indicates the transition of AST cells. (C) AIT and AST cell adhesion curves on Matrigel-coated substrates with gradient of coating concentrations (0.1–40 μg/cm2) (mean ± SD, n = 4 independent biological replicates, p < 0.05, ∗∗p < 0.01). (D) Relative expression of KLF4, KLF5, and NANOG in AIT and AST cells on Matrigel-coated substrates with three different coating concentrations (0.1, 1, and 10 μg/cm2) (mean ± SD, n = 3 independent experiments, p < 0.05, NS, not significant). (E) Bifurcation diagrams of KLF4/5 expression level as a function of cell-matrix adhesion. The three diagrams correspond to the three values of MAL expression level indicated on the right. For a MAL expression level approximately that of an AIT cell (1.59 unit), the cell cannot switch to the upper branch by just changing the cell-matrix adhesion. With reduced total MAL expression, the upper branch can become reachable. Below a critical value (0.72 unit) of MAL expression, there is no bi-stability and the properties of the cell change smoothly. Green line indicates the irreversible transition of AIT cells. Violet line indicates the reversible transition of the small interfering RNA (siRNA)-treated AIT cells. (F) The relative change of the position of the two limiting points LP1 and LP2, when each of the 20 parameters in the model is increased or decreased by 15%. (G) Western blot result indicated the interference efficiency of MAL protein in AIT and AST cells. (H) siRNAs were transfected with lipofection. Suspended AIT cells were treated with siRNA for 2 hr, and then seeded on the GNF substrate. These cells formed a dome-like morphology after MAL siRNA transfection. Samples with only addition of liposome were used as a control. (I) Relative expression of KLF4, KLF5, and NANOG in AIT cells on low-adhesion GNF substrate with or without siRNA treatment (mean ± SD, n = 3 independent biological replicates, p < 0.05, ∗∗p < 0.01). To avoid the interference of ROCK inhibitor on cell adhesion, data in this figure were obtained more than 48 hr after withdrawal of the ROCK inhibitor from cell cultures. See also Figure S7.
Figure 7
Figure 7
Barrier between AIT and AST Cells

References

    1. Bartel D.P., Lee R., Feinbaum R. MicroRNAs: genomics, biogenesis, mechanism, and function. Cell. 2004;116:281–297. - PubMed
    1. Caiazzo M., Okawa Y., Ranga A., Piersigilli A., Tabata Y., Lutolf M.P. Defined three-dimensional microenvironments boost induction of pluripotency. Nat. Mater. 2016;15:344–352. - PubMed
    1. Chan K.K.-K., Zhang J., Chia N.-Y., Chan Y.-S., Sim H.S., Tan K.S., Oh S.K.-W., Ng H.-H., Choo A.B.-H. KLF4 and PBX1 directly regulate NANOG expression in human embryonic stem cells. Stem Cells. 2009;27:2114–2125. - PubMed
    1. Chen T., Yuan D., Wei B., Jiang J., Kang J., Ling K., Gu Y., Li J., Xiao L., Pei G. E-Cadherin-mediated cell–cell contact is critical for induced pluripotent stem cell generation. Stem Cells. 2010;28:1315–1325. - PubMed
    1. Chowdhury F., Li Y., Poh Y.-C., Yokohama-Tamaki T., Wang N., Tanaka T.S. Soft substrates promote homogeneous self-renewal of embryonic stem cells via downregulating cell-matrix tractions. PLoS One. 2010;5:e15655. - PMC - PubMed

Publication types