

Modeling the Influence of Social Ties and Transportation Choice on Access to Oral Healthcare for Older Adults
- PMID: 30008491
- PMCID: PMC6039129
- DOI: 10.1016/j.apgeog.2018.05.005
Modeling the Influence of Social Ties and Transportation Choice on Access to Oral Healthcare for Older Adults
Abstract
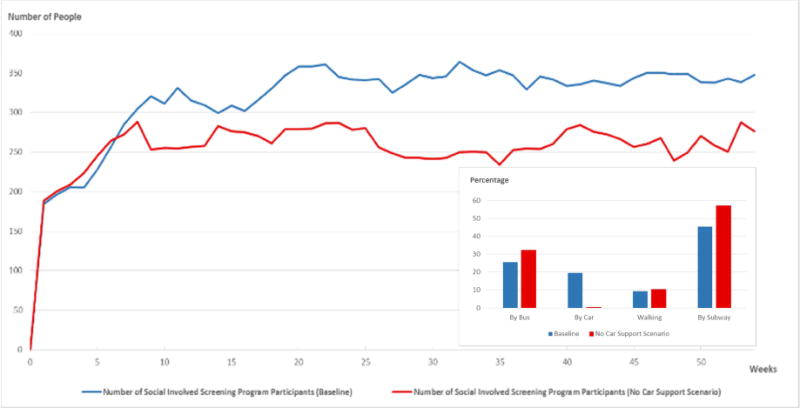
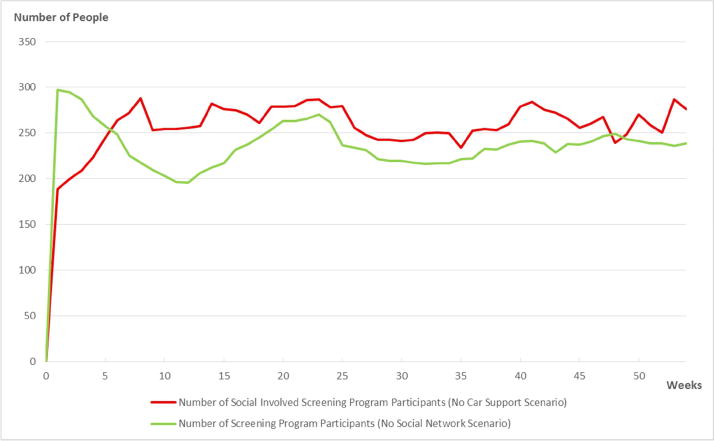
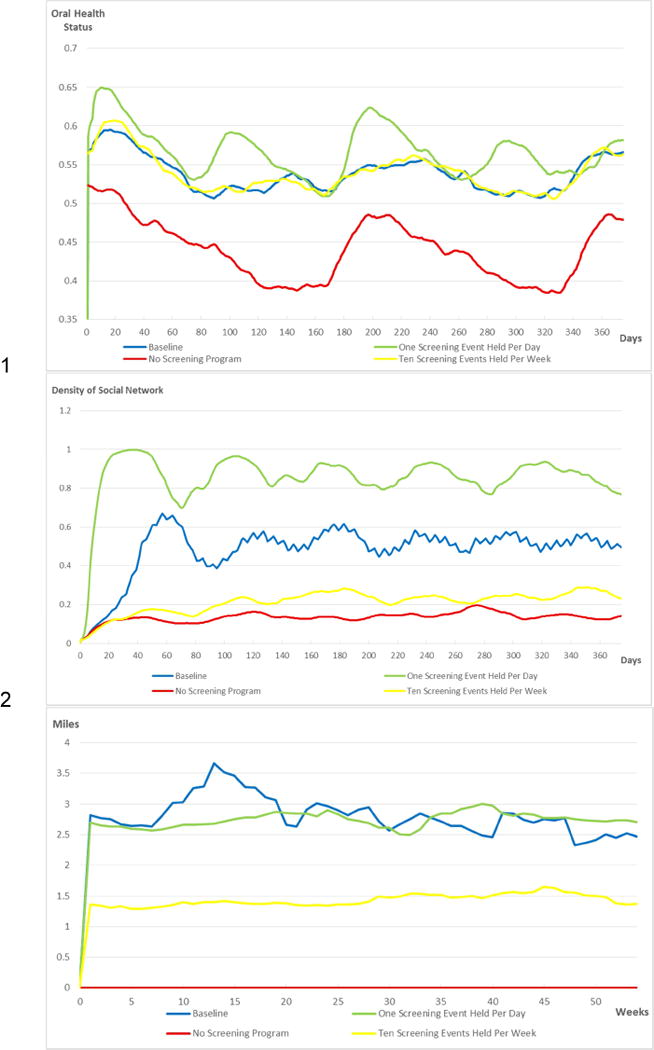
The current U.S. demographic shift toward an older population and the importance of intervening before conditions become severe warrant a concerted effort to ease the burden of access to healthcare for older adults. With regard to oral healthcare, more integrated services for older adults are needed to effectively serve their complex medical and dental needs. Using an agent-based simulation model, this paper examines the influence of social ties and transportation mode choices on opportunities for older adults to participate in community-based preventive screening events and access needed oral healthcare. This approach accounts for the heterogeneity of behavior that arises for a population exhibiting diversity in terms of social factors, including socioeconomic means and social support. In the context of older adults living in urban environments, the availability of different transportation modes ought to be taken into consideration. To explore alternative scenarios for the accessibility of preventive screening events offered at senior centers in northern Manhattan, an agent-based model (ABM) was created with a geographic information system (GIS) to simulate the influence of social ties and transportation choices on older adults seeking preventive screening services and oral healthcare. Results of simulation experiments indicate preferences for public transportation and inequities in accessibility that may be mitigated with social support. This simulation model offers a way to explore social support as an important factor in making transportation mode choices that mediate oral healthcare accessibility and thus oral health outcomes for older adults.
Keywords: Agent-based modeling; Geographic information science; Healthcare accessibility; Multi-modal transportation analysis; Social influence.
Figures


References
-
- Aurenhammer F, Klein R, Lee DT. Voronoi Diagrams and Delaunay Triangulations. World Scientific. 2013;337 doi: 10.1007/978-1-4939-2864-4_507. - DOI
-
- Booth Sweeney L, Meadows D. The Systems Thinking Playbook: Exercises to Stretch and Build Learning and Systems Thinking Capabilities. White River Junction, VT: Chelsea Green; 2010.
-
- Boots B, South R. Modeling retail trade areas using higher-order, multiplicatively weighted Voronoi diagrams. Journal of Retailing. 1998;4(519–536):73. doi: 10.1016/S0022-4359(97)90033-6. - DOI
Grants and funding
LinkOut - more resources
Full Text Sources
Other Literature Sources