. 2018 Jun 29:12:181.
doi: 10.3389/fncel.2018.00181. eCollection 2018.

Human Cortical Pyramidal Neurons: From Spines to Spikes via Models

Affiliations

Human Cortical Pyramidal Neurons: From Spines to Spikes via Models

Guy Eyal et al. Front Cell Neurosci. .

Abstract

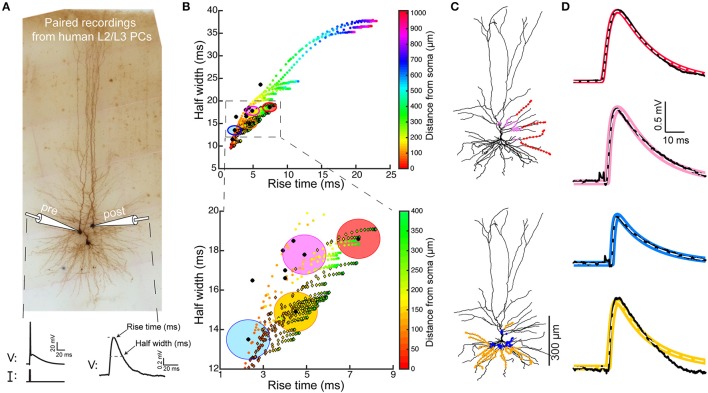
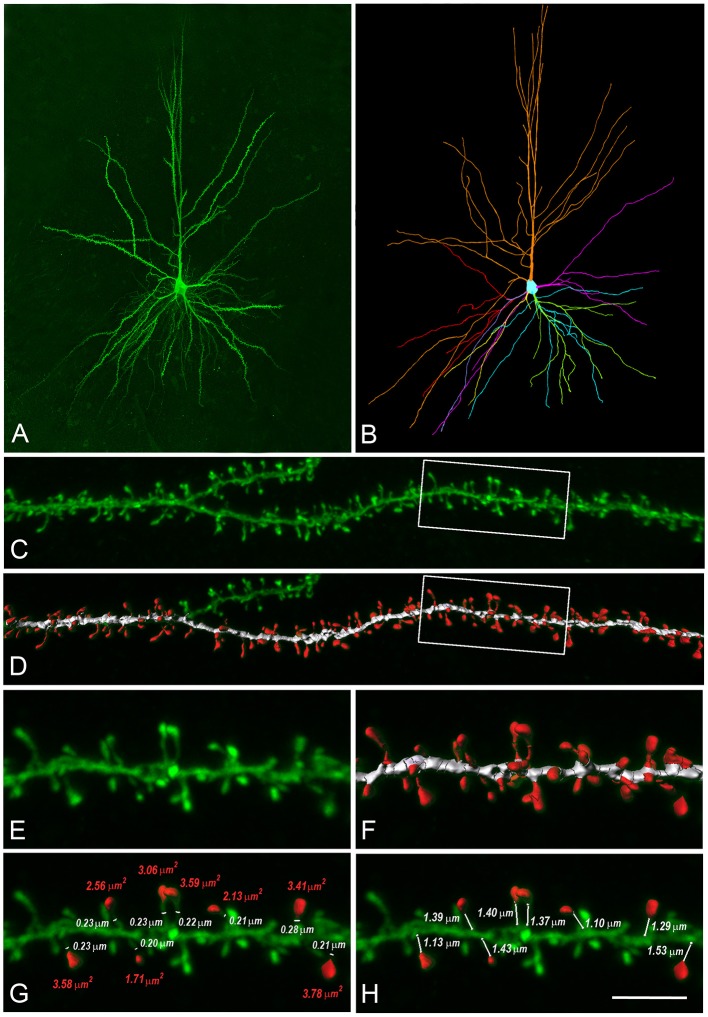
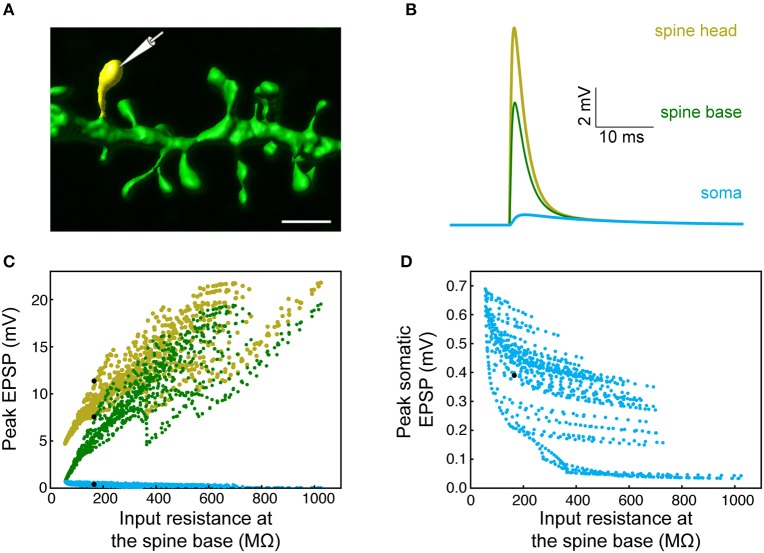
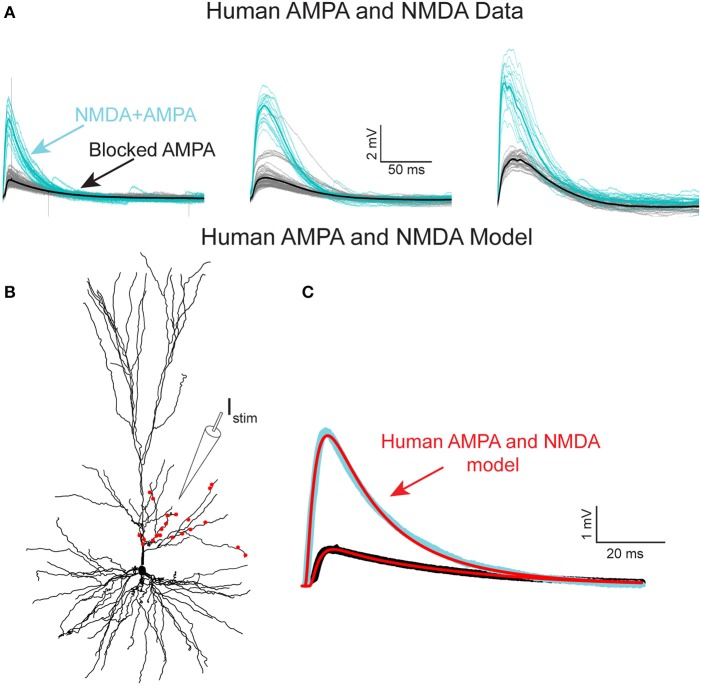
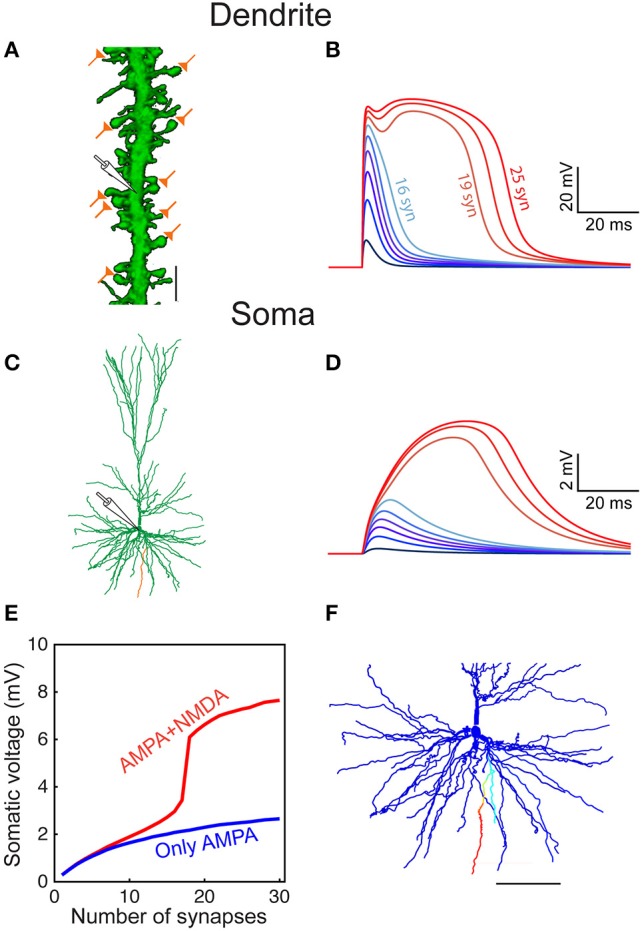
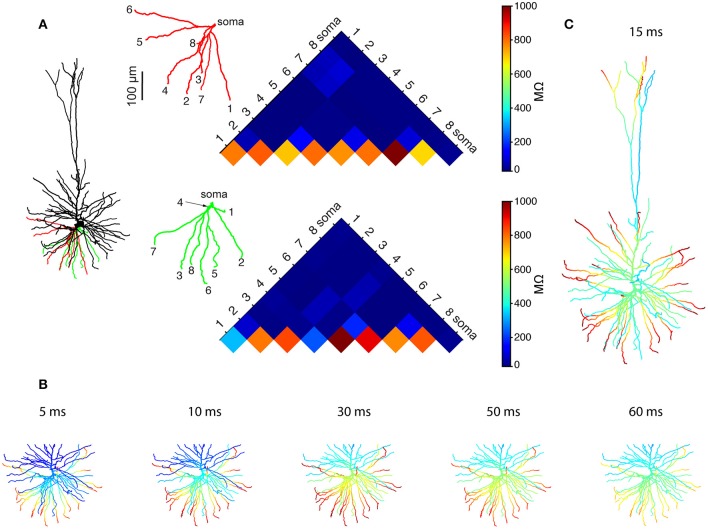
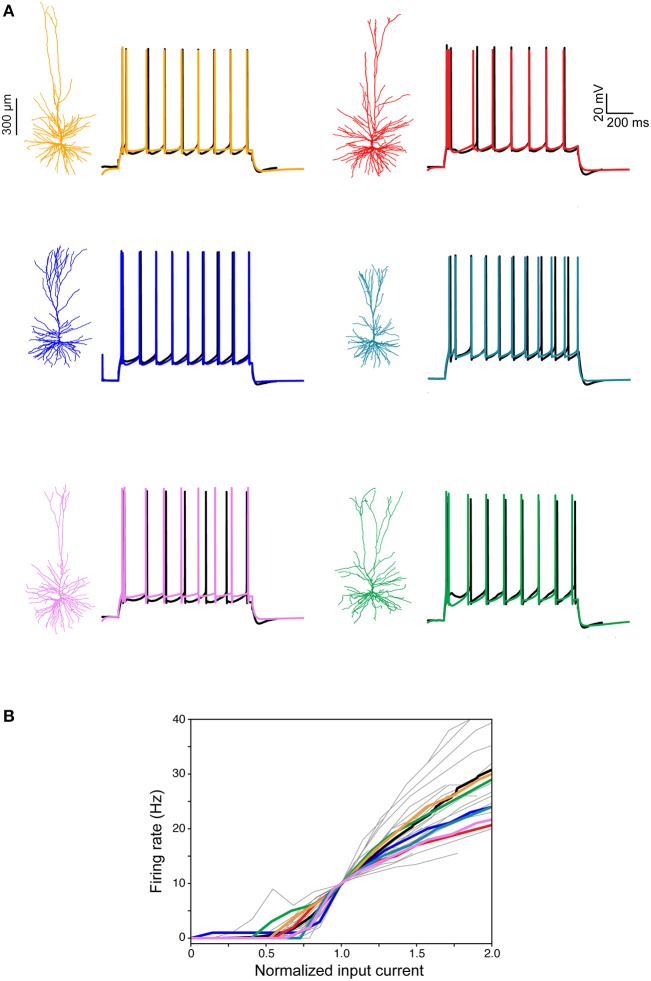
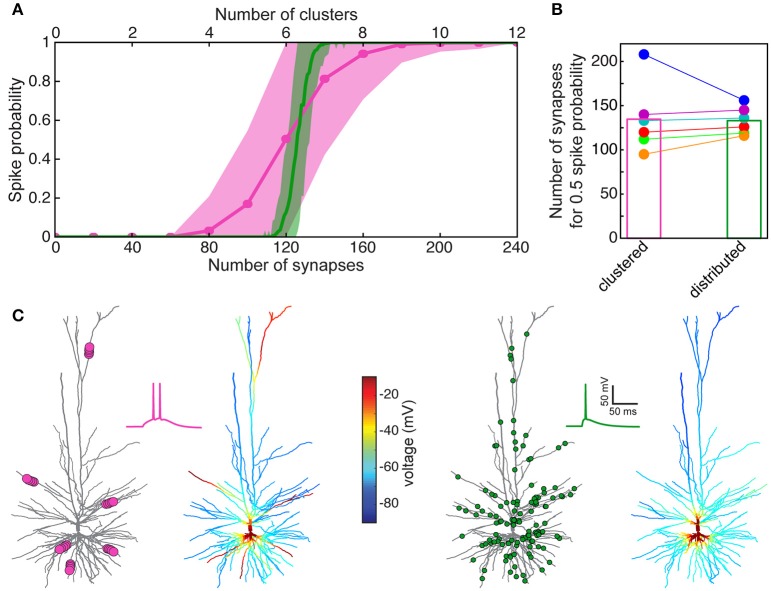
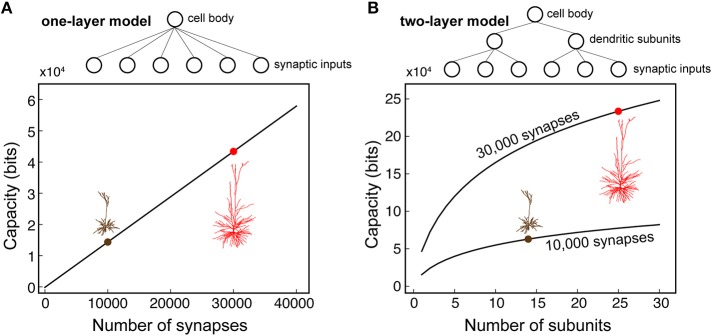
We present detailed models of pyramidal cells from human neocortex, including models on their excitatory synapses, dendritic spines, dendritic NMDA- and somatic/axonal Na+ spikes that provided new insights into signal processing and computational capabilities of these principal cells. Six human layer 2 and layer 3 pyramidal cells (HL2/L3 PCs) were modeled, integrating detailed anatomical and physiological data from both fresh and postmortem tissues from human temporal cortex. The models predicted particularly large AMPA- and NMDA-conductances per synaptic contact (0.88 and 1.31 nS, respectively) and a steep dependence of the NMDA-conductance on voltage. These estimates were based on intracellular recordings from synaptically-connected HL2/L3 pairs, combined with extra-cellular current injections and use of synaptic blockers, and the assumption of five contacts per synaptic connection. A large dataset of high-resolution reconstructed HL2/L3 dendritic spines provided estimates for the EPSPs at the spine head (12.7 ± 4.6 mV), spine base (9.7 ± 5.0 mV), and soma (0.3 ± 0.1 mV), and for the spine neck resistance (50-80 MΩ). Matching the shape and firing pattern of experimental somatic Na+-spikes provided estimates for the density of the somatic/axonal excitable membrane ion channels, predicting that 134 ± 28 simultaneously activated HL2/L3-HL2/L3 synapses are required for generating (with 50% probability) a somatic Na+ spike. Dendritic NMDA spikes were triggered in the model when 20 ± 10 excitatory spinous synapses were simultaneously activated on individual dendritic branches. The particularly large number of basal dendrites in HL2/L3 PCs and the distinctive cable elongation of their terminals imply that ~25 NMDA-spikes could be generated independently and simultaneously in these cells, as compared to ~14 in L2/3 PCs from the rat somatosensory cortex. These multi-sites non-linear signals, together with the large (~30,000) excitatory synapses/cell, equip human L2/L3 PCs with enhanced computational capabilities. Our study provides the most comprehensive model of any human neuron to-date demonstrating the biophysical and computational distinctiveness of human cortical neurons.

Keywords: compartmental modeling; cortical excitatory synapses; dendritic spines; human pyramidal cells; multi objective optimization; neuron computation; non-linear dendrites.


Figures

Figure 1
Figure 1
Model predicts that HL2/L3–HL2/L3 excitatory synapses are formed at proximal dendritic sites. (A) Pair recording from HL2/L3 PCs. A presynaptic spike was initiated in a cell (lower left trace) and the postsynaptic EPSP was measured in another cell (lower right trace). The shape index of this EPSP is defined by its rise time and half-width (bottom right). (B) Top: Theoretical shape-index curve for the modeled cell shown in (C), as a function of distance from the soma. Colors code for the physical distance from the soma; color circles for apical inputs and color diamonds for basal inputs. Bottom: Zoom-in into the square demarcated at the top frame. Black circles are from 10 experimental somatic EPSPs. The large filled color circles with radius of 1 ms are centered around the loci of the respective four experimental EPSPs shown in (D). (C) Modeled cell used in (B), with dots depicting the predicted synaptic locations that give rise to somatic EPSPs whose shape indices fall within the corresponding large colored circles in (B). E.g., red points are all synaptic contacts that yield rise-time and half-width that are within the red circle in (B). (D) Four experimental EPSPs (black traces) from four connected pairs of HL2/L3-HL2/L3 pyramidal cells and the theoretical EPSPs (100 model fits, per experimental EPSP, in color traces, with their mean depicted by the dashed white line) corresponding to the respective color dots in (C). The peak synaptic conductance, for each of the putative dendritic synapses, was obtained via fitting the theoretical to the experimental transients (see text and Table S1). The recordings in (A) were taken from a pair of cells that were not reconstructed, and the HL2/L3 morphologies are shown here only for the illustration of the method (see Figures S1, S2).
Figure 2
Figure 2
Reconstructions of human L3 dendritic spines. (A) Confocal microscopy image z projection of an intracellularly injected layer 3 pyramidal neuron of the human temporal cortex obtained at autopsy. (B) 3D reconstruction of the complete morphology of the cell shown in (A). Orange represents the apical dendritic arbor whereas other colors represent the basal dendritic arborization. (C) Confocal microscopy image showing a horizontally projecting labeled basal dendrite. (D) To reconstruct the complete morphology of dendritic spines (red), different intensity thresholds were created and then a particular threshold was selected for each spine to constitute a solid surface that exactly matched its contour. The dendritic shaft (white) was 3D reconstructed by selecting a particular threshold that represented a solid surface that matched the contour of the dendritic shaft along the length of the dendrite. (E,F) Higher magnification images of the dendritic segment indicated in boxed areas in (C,D). (G) For a selection of spines which showed clear heads, a particular solid surface that matched the contour of the spine head was created (red). The neck diameter was manually marked (white). Spine head area and neck diameter measurements are indicated in red and white numbers, respectively. (H) The neck length was manually marked from the point of insertion in the dendritic shaft to the spine head. Neck length measurements are indicated in white numbers. Scale bar (in H): 110 μm in (A,B), 10 μm in (C,D) and 4.5 μm in (EH).
Figure 3
Figure 3
Modeling synaptic inputs on 3D reconstructed human L2/L3 PCs' dendritic spines. (A) A prototypical 3D reconstructed human L3 spine, with average dimensions as found in Figure 2. This dendritic spine was used as a target for excitatory synapses located at its head membrane; synaptic properties are as found in Figure 1. Scale bar = 2 μm. (B) Exemplar simulated EPSP in the spine head (yellow), spine base (green), and in the soma (cyan). (C) Predicted individual EPSP peak voltage at the (yellow), spine base (green) and in the soma (cyan) for dendritic spines distributed on the modeled cell shown in Figure 1. The spines are arranged according to the input resistance of their respective stem dendrite. Colors are as in (B); black dots depict the example shown in (B). (D) Zoom-in into (C) showing the peak somatic EPSP.
Figure 4
Figure 4
NMDA-receptor based currents in human L2/L3 pyramidal cells—model fit to experiments. (A) Somatic EPSPs recorded in three HL2/L3 PCs in response to repeated stimulation via an extracellular electrode (Istim in B), see section Materials and Methods. Light blue traces: The respective somatic EPSPs. Black traces: NMDA-dependent EPSPs after blocking AMPA receptors with 1 μM of NBQX; thick lines are the respective averages. Leftmost EPSPs were recorded from the cell shown in (B). (B) Model prediction for the putative dendritic location and number of activated synapses (red dots) that closely fits the experimental average EPSP shown at the left frame of (A). Synaptic model included both AMPA- and NMDA-based conductances (see section Materials and Methods and Table S2). (C) Model response at the soma (red traces) when all 21 red synapses in (B) were activated. Top trace. EPSP with both AMPA and NMDA conductance; bottom trace, the case in which 82% of the AMPA conductance was blocked (see section Materials and Methods). See similar fits to additional neurons in Figure S6, as well as other accepted models in Figure S5; note the steep non-linearity of the voltage-dependency of the NMDA-current in most of the models (Figure S5B).
Figure 5
Figure 5
Modeled dendritic NMDA spike in distal dendrites of HL2/L3 pyramidal neurons. (A) Confocal image of a dendrite from human L2/L3 pyramidal neuron (obtained from postmortem preparation, see section Materials and Methods) that is densely decorated with dendritic spines. The location of the activated model synapses is illustrated by the “orange synapses” (scale bar = 5 μm) that were simulated on a similar basal dendrite from the modeled HL2/L3 cell in (C) (orange branch). (B) Voltage response at the stem dendrite when increasing the number of simultaneously activated spine synapses. Activated synapses are distributed within 20 μm of dendritic stretch. Note the steep non-linear change in local dendritic voltage when 19 synapses were activated—resulting in an NMDA spike. (C) The morphology of the modeled cell. (D) Somatic voltage in response to synaptic activation as in (B). (E) The somatic EPSP amplitude as a function of the number of activated dendritic synapses with NMDA (red) and when only AMPA current was activated (blue). (F) The spatial extent of the NMDA spike in one basal dendrite—voltage is color-coded (blue, −86 mV, red, −10 mV; scale bar = 100 μm). The NMDA spike was activated by 20 clustered synapses and the voltage was recorded 10 ms after their synchronous activation. Note the large number (44) and the distinctive elongation of the basal terminals in this cell.
Figure 6
Figure 6
Multiple NMDA-based functional subunits in human L2/L3 pyramidal cells. (A) Significant electrical decoupling of the basal dendrites from each other. Left, red and green depict two basal subtrees taken from the modeled cell shown at left. Right, color-coded matrix showing the transfer resistance (Ri, j) between one tip of a basal terminal i and the tip of the other basal terminal j, for the red and green basal subtrees. Blue colors represent small transfer resistance (significant electrical decoupling); the lower part of the triangles (hot colors) depicts the input resistance (Ri, i) at the different dendritic tips. (B) Twenty-one independent simultaneous NMDA spikes could be generated in the modeled basal tree (red branches, see section Materials and Methods). Clusters of excitatory synapses that were sufficient to generate local NMDA spikes were activated simultaneously at t = 0 ms and the membrane voltage (color coded) as a function of time is superimposed on the simulated dendritic tree. (C) When activating the entire dendritic tree with clustered synaptic inputs, 28 independent NMDA spikes could be generated simultaneously in the modeled L2/L3 neuron (red dendritic terminal branches, basal plus apical trees). See section Materials and Methods for the definition of “an independent NMDA spike.”
Figure 7
Figure 7
Modeling somatic/axonal Na+ spikes for six human L2/L3 PCs. (A) Fit between models and experiments. Black traces, experimental spike trains recorded from human L2/L3 PCs shown on the left. Step current input was selected to generate spike train of about 10 Hz. Color traces, model responses to the same experimental current step. Models were optimized using multiple objective optimization algorithm (MOO, see section Materials and Methods). (B) Gray traces, experimental I-F curves in 25 human L2/L3 PCs, normalized by the input current corresponding to a firing rate of 10 Hz. Black curve, average of all experimental traces. Colored traces, theoretical I-F curves for the six modeled cells shown in (A) with corresponding colors.
Figure 8
Figure 8
Model prediction of the number of excitatory HL2/L3–HL2/L3 synapses required to generate a somatic Na+ spike. (A) Probability for a somatic spike presented as a function of the number of simultaneously activated synapses. Two cases are shown, randomly distributed synapses (green) and clustered synapses (pink), see section Materials and Methods. (B) Number of synapses required to generate an AP with probability of 0.5 for the six HL2/L3 pyramidal cells modeled in Figure 7. Columns represent the mean value for the six models. The red case is for the neuron modeled in (A); colors match the colors in Figure 7. (C) Example of a simulation for the clustered and the distributed cases for the model shown in (A). Left, 6 clusters, 20 synapses each (pink dots at left tree; for illustration reasons only 5 synapses are shown per cluster), giving rise to local NMDA-spikes and a burst of two somatic Na+ spikes (pink trace). Corresponding color-coded spatial spread of voltage is depicted at the right tree. Right panel, 125 randomly distributed synapses (green dots) resulted in a single somatic spike (green trace) without dendritic NMDA spikes.
Figure 9
Figure 9
Human L2/L3 pyramidal neurons have larger storage capacity compared to rat. (A) Storage capacity as a function of the number of synaptic inputs when the neuron is considered as one-layer model. The inputs from all the synapses are summed directly at the cell body. The case of rodent L2/3 cell and HL2/L3 with 10,000 and 30,000 synapses is depicted, by black and red, respectively. (B) Storage capacity of the neuron when considered as a two-layer model; the capacity is shown as function of the number of non-linear dendritic subunits per neuron. The case of 14 subunits vs. 25 subunits is shown for the rat and human PCs, respectively. Top and bottom curves are for 30,000 and 10,000 synaptic inputs respectively. The average number of contacts per connection was assumed to be five in both cases (d = s/5 for the parameters used in Poirazi and Mel (2001). Analysis of storage capacity is as in Poirazi and Mel (2001). Note that the capacity of human L2/L3 is almost 4-folds that of the rodent.

Similar articles

Cited by

References

    1. Alonso-Nanclares L., Gonzalez-Soriano J., Rodriguez J. R., DeFelipe J. (2008). Gender differences in human cortical synaptic density. Proc. Natl. Acad. Sci. U.S.A. 105, 14615–14619. 10.1073/pnas.0803652105 - DOI - PMC - PubMed
    1. Amunts K., Ebell C., Muller J., Telefont M., Knoll A., Lippert T. (2016). The human brain project: creating a European research infrastructure to decode the human brain. Neuron 92, 574–581. 10.1016/j.neuron.2016.10.046 - DOI - PubMed
    1. Angelino E., Brenner M. P. (2007). Excitability constraints on voltage-gated sodium channels. PLoS Comput. Biol. 3:e177. 10.1371/journal.pcbi.0030177 - DOI - PMC - PubMed
    1. Araya R., Vogels T. P., Yuste R. (2014). Activity-dependent dendritic spine neck changes are correlated with synaptic strength. Proc. Natl. Acad. Sci. U.S.A. 111, E2895–E2904. 10.1073/pnas.1321869111 - DOI - PMC - PubMed
    1. Arellano J. I., Espinosa A., Fairen A., Yuste R., DeFelipe J. (2007). Non-synaptic dendritic spines in neocortex. Neuroscience 145, 464–469. 10.1016/j.neuroscience.2006.12.015 - DOI - PubMed

LinkOut - more resources