. 2018 Aug;16(2):1899-1911.
doi: 10.3892/ol.2018.8861. Epub 2018 May 31.

A meta-analysis of transcriptome datasets characterizes malignant transformation from melanocytes and nevi to melanoma

Affiliations

A meta-analysis of transcriptome datasets characterizes malignant transformation from melanocytes and nevi to melanoma

Daniel Ortega-Bernal et al. Oncol Lett. 2018 Aug.

Abstract

Melanoma represents one of the most aggressive malignancies and has a high tendency to metastasize. The present study aims to investigate the molecular mechanisms of two pathways to cancer transformation with the purpose of identifying potential biomarkers. Our approach is based on a meta-analysis of gene expression profiling contrasting two scenarios: A model that describes a transformation pathway from melanocyte to melanoma and a second model where transformation occurs through an intermediary nevus. Data consists of three independent, publicly available microarray datasets from the Gene Expression Omnibus (GEO) database comprising samples from melanocytes, nevi and melanoma. The present analysis identified 808 differentially expressed genes (528 upregulated and 360 downregulated) in melanoma compared with nevi, and 2,331 differentially expressed genes (946 upregulated and 1,385 downregulated) in melanoma compared with melanocytes. Further analysis narrowed down this list, since 682 differentially expressed genes were found in both models (417 upregulated and 265 downregulated). Enrichment analysis identified relevant dysregulated pathways. This article also presented a discussion on significant genes including ADAM like decysin 1, neudesin neurotrophic factor, MMP19, apolipoprotein L6, C-X-C motif chemokine ligand (CXCL)8, basic, immunoglobulin-like variable motif containing and CXCL16. These are of particular interest because they encode secreted proteins hence represent potential blood biomarkers for the early detection of malignant transformation in both scenarios. Cytotoxic T-lymphocyte associated protein 4, an important therapeutic target in melanoma treatment, was also upregulated in both comparisons indicating a potential involvement in immune tolerance, not only at advanced stages but also during the early transformation to melanoma. The results of the present study may provide a research direction for studying the mechanisms underlying the development of melanoma, depending on its origin.

Keywords: biomarker; melanocyte; melanoma; meta-analysis; nevus; transcriptome.


Figures

Figure 1.
Figure 1.
Selection of gene expression datasets for meta-analysis. The following terms were used for the initial search: ‘Homo sapiens’, ‘expression transcription profiling’, ‘array assay’ and ‘melanoma’. GEO, Gene Expression Omnibus.
Figure 2.
Figure 2.
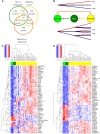
Differentially expressed genes. (A) Venn diagram of the differential expression results for the comparisons among nevi, melanocytes and melanoma Green circle, the number of genes with different expression levels between nevi and melanocytes. Yellow circle, the number of genes with different expression levels between melanoma vs. nevi. Orange circle, the number of genes with different expression levels between melanoma vs. melanocytes. Colors in the Venn diagram match the color of each comparison shown in B. (B) Diagram illustrating how the expression of genes change as they follow a path that ultimately results in melanoma. Blue and red lines indicate downregulation and upregulation, respectively. Black lines indicate no change. Genes in samples that developed melanoma directly from melanocytes are shown in the top panel, and the number of genes that was used to assess changes is indicated. Genes in samples in which melanoma developed from an intermediary nevus are shown at the bottom, and the number of genes that was used to assess changes from nevus to melanoma are indicated. As indicated in this diagram, 3 possible paths were identified in melanoma samples that had directly transformed from melanocytes, and 9 possible paths were identified in melanoma samples that transformed via an intermediary nevus. A given gene may have 10 possible transformation paths at the transcriptome level when removing the 2 paths that did not show changes in expression. (C) Hierarchical clustering based on the 50 most discriminating genes that are unique to each comparison: Melanoma vs. melanocytes (2,331 genes) and melanoma vs. nevi (888 genes). Melanocyte (light green label), nevus (dark green label) and melanoma (yellow label) samples fell into two major groups. (D) Hierarchical clustering based on the 50 most discriminating genes that are common to each comparison: Melanoma vs. melanocytes and melanoma vs. nevi (682 genes). Melanocyte (light green label), nevus (dark green label) and melanoma (yellow label) samples fell into two major groups.
Figure 3.
Figure 3.
Gene Set Enrichment Analysis. (A) Signaling pathways and biological functions that are involved in cancer transformation via a nevus; three of the pathways exhibiting decreased activity are involved in cell cycle checkpoints. Conversely, a number of the activated pathways are associated with cell cycle progression. (B) Signaling pathways and biological functions that are involved in cancer transformation from melanocytes. The samples exhibited decreased cAMP synthesis, which is consistent with the decreased activity of this pathway. Numbers in parenthesis represent statistical significance (P-values) as assigned by Ingenuity® Pathway Analysis. BF, biological functions; PPARα, peroxisome proliferator activated receptor α; SP, signaling pathways.

References

    1. Balch CM, Gershenwald JE, Soong SJ, Thompson JF, Atkins MB, Byrd DR, Buzaid AC, Cochran AJ, Coit DG, Ding S, et al. Final version of 2009 AJCC melanoma staging and classification. J Clin Oncol. 2009;27:6199–6206. doi: 10.1200/JCO.2009.23.4799. - DOI - PMC - PubMed
    1. Bray F, Jemal A, Grey N, Ferlay J, Forman D. Global cancer transitions according to the human development index (2008-2030): A population-based study. Lancet Oncol. 2012;13:790–801. doi: 10.1016/S1470-2045(12)70211-5. - DOI - PubMed
    1. Shain AH, Bastian BC. From melanocytes to melanomas. Nat Rev Cancer. 2016;16:345–358. doi: 10.1038/nrc.2016.37. - DOI - PubMed
    1. Shitara D, Nascimento MM, Puig S, Yamada S, Enokihara MM, Michalany N, Bagatin E. Nevus-associated melanomas: Clinicopathologic features. Am J Clin Pathol. 2014;142:485–491. doi: 10.1309/AJCP4L5CJGKTJVDD. - DOI - PubMed
    1. Bardeesy N, Bastian BC, Hezel A, Pinkel D, DePinho RA, Chin L. Dual inactivation of RB and p53 pathways in RAS-induced melanomas. Mol Cell Biol. 2001;21:2144–2153. doi: 10.1128/MCB.21.6.2144-2153.2001. - DOI - PMC - PubMed