

An ultrasensitive polydopamine bi-functionalized SERS immunoassay for exosome-based diagnosis and classification of pancreatic cancer
- PMID: 30009009
- PMCID: PMC6009498
- DOI: 10.1039/c8sc01611a
An ultrasensitive polydopamine bi-functionalized SERS immunoassay for exosome-based diagnosis and classification of pancreatic cancer
Abstract
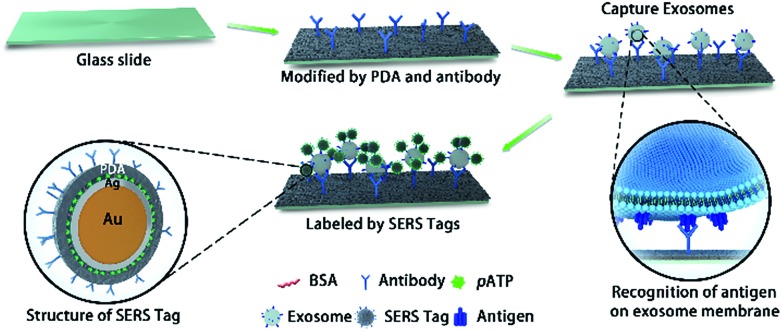
Early diagnosis and metastasis monitoring for pancreatic cancer are extremely difficult due to a lack of sensitive liquid biopsy methods and reliable biomarkers. Herein, we developed easy-to-prepare and effective polydopamine-modified immunocapture substrates and an ultrathin polydopamine-encapsulated antibody-reporter-Ag(shell)-Au(core) multilayer (PEARL) Surface-Enhanced Raman Scattering (SERS) nano-tag with a quantitative signal of the Raman reporter at 1072 cm-1, which achieved ultrasensitive and specific detection of pancreatic cancer-derived exosomes with a detection limit of only one exosome in 2 μL of sample solution (approximately 9 × 10-19 mol L-1). Furthermore, by analyzing a 2 μL clinical serum sample, the migration inhibitory factor (MIF) antibody-based SERS immunoassay could not only discriminate pancreatic cancer patients (n = 71) from healthy individuals (n = 32), but also distinguish metastasized tumors from metastasis-free tumors, and Tumor Node Metastasis (TNM) P1-2 stages from the P3 stage (the discriminatory sensitivity was 95.7%). Thus, this novel immunoassay provides a powerful tool for the early diagnosis, classification and metastasis monitoring of pancreatic cancer patients.
Figures


Similar articles
-
Growth of Spherical Gold Satellites on the Surface of Au@Ag@SiO2 Core-Shell Nanostructures Used for an Ultrasensitive SERS Immunoassay of Alpha-Fetoprotein.ACS Appl Mater Interfaces. 2019 Jan 23;11(3):3617-3626. doi: 10.1021/acsami.8b21238. Epub 2019 Jan 11. ACS Appl Mater Interfaces. 2019. PMID: 30608142
-
Highly Sensitive Exosome Detection for Early Diagnosis of Pancreatic Cancer Using Immunoassay Based on Hierarchical Surface-Enhanced Raman Scattering Substrate.Small Methods. 2022 Jun;6(6):e2200154. doi: 10.1002/smtd.202200154. Epub 2022 Apr 23. Small Methods. 2022. PMID: 35460217
-
Monodisperse Au@Ag core-shell nanoprobes with ultrasensitive SERS-activity for rapid identification and Raman imaging of living cancer cells.Talanta. 2019 Jun 1;198:45-54. doi: 10.1016/j.talanta.2019.01.085. Epub 2019 Jan 25. Talanta. 2019. PMID: 30876586
-
Exosome detection via surface-enhanced Raman spectroscopy for cancer diagnosis.Acta Biomater. 2022 May;144:1-14. doi: 10.1016/j.actbio.2022.03.036. Epub 2022 Mar 28. Acta Biomater. 2022. PMID: 35358734 Review.
-
Surface-Enhanced Raman Scattering-Based Immunoassay Technologies for Detection of Disease Biomarkers.Biosensors (Basel). 2017 Jan 12;7(1):7. doi: 10.3390/bios7010007. Biosensors (Basel). 2017. PMID: 28085088 Free PMC article. Review.
Cited by
-
Mixed-Dimensional Heterostructure Material-Based SERS for Trace Level Identification of Breast Cancer-Derived Exosomes.ACS Omega. 2020 Jul 1;5(27):16602-16611. doi: 10.1021/acsomega.0c01441. eCollection 2020 Jul 14. ACS Omega. 2020. PMID: 32685826 Free PMC article.
-
Exosomes as a new frontier of cancer liquid biopsy.Mol Cancer. 2022 Feb 18;21(1):56. doi: 10.1186/s12943-022-01509-9. Mol Cancer. 2022. PMID: 35180868 Free PMC article. Review.
-
Sensitive and reliable lab-on-paper biosensor for label-free detection of exosomes by electrochemical impedance spectroscopy.Mikrochim Acta. 2024 Sep 24;191(10):617. doi: 10.1007/s00604-024-06644-2. Mikrochim Acta. 2024. PMID: 39316098
-
Microfluidic Liquid Biopsy Minimally Invasive Cancer Diagnosis by Nano-Plasmonic Label-Free Detection of Extracellular Vesicles: Review.Int J Mol Sci. 2025 Jul 1;26(13):6352. doi: 10.3390/ijms26136352. Int J Mol Sci. 2025. PMID: 40650129 Free PMC article. Review.
-
Interfacial interactions of SERS-active noble metal nanostructures with functional ligands for diagnostic analysis of protein cancer markers.Mikrochim Acta. 2021 Apr 12;188(5):164. doi: 10.1007/s00604-021-04807-z. Mikrochim Acta. 2021. PMID: 33844071 Review.
References
LinkOut - more resources
Full Text Sources
Other Literature Sources
Miscellaneous