. 2018 May 21;5(7):788-802.
doi: 10.1002/acn3.574. eCollection 2018 Jul.

Altered dynamics of neurovascular coupling in CADASIL

Affiliations

Altered dynamics of neurovascular coupling in CADASIL

Clément Huneau et al. Ann Clin Transl Neurol. .

Abstract

Background and objective: Neurovascular coupling is the complex biological process that underlies use-dependent increases in blood flow in response to neural activation. Neurovascular coupling was investigated at the early stage of CADASIL, a genetic paradigm of ischemic small vessel disease.

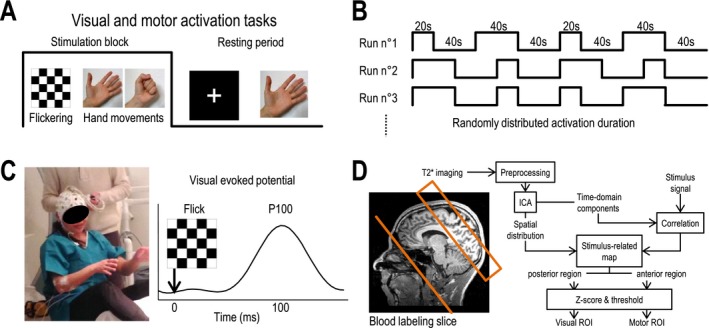
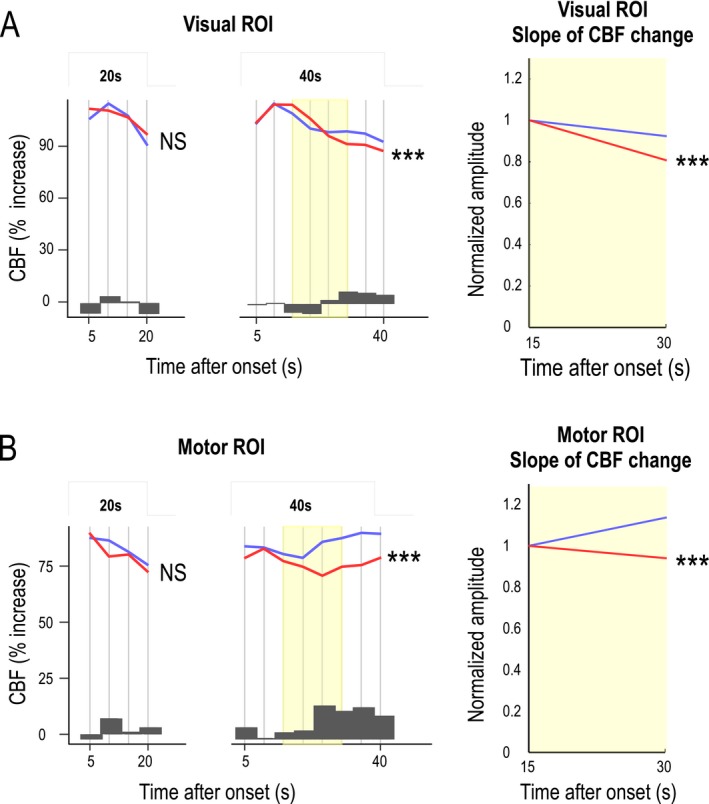
Methods: Functional hyperemia and evoked potentials during 20- and 40-sec visual and motor stimulations were monitored simultaneously using arterial spin labeling-functional magnetic resonance imaging (ASL-fMRI) and electroencephalography.

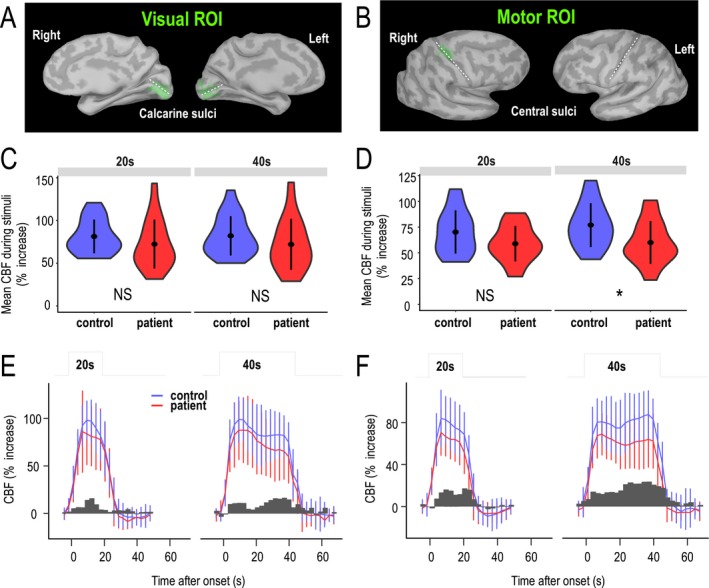
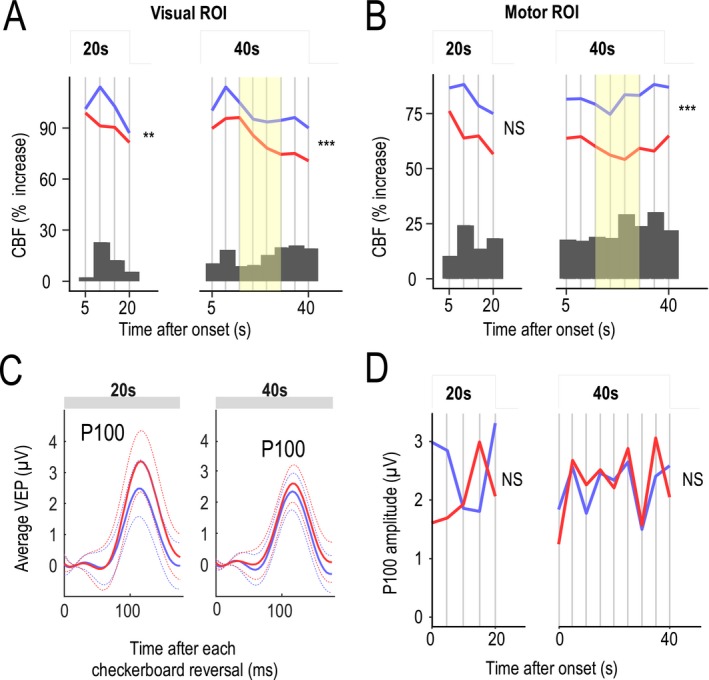
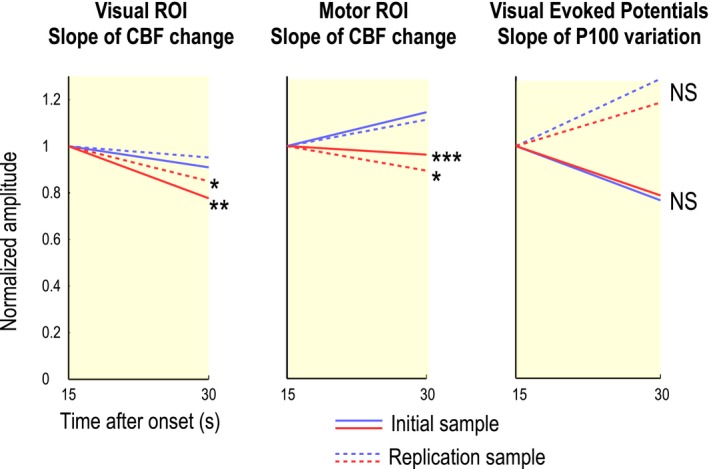
Results: Cortical functional hyperemia differed significantly between 19 patients and 19 healthy individuals, whereas evoked potentials were unaltered. Functional hyperemia dynamics, assessed using the difference in the slope of the response curve between 15 and 30 sec, showed a time-shifted decrease in the response to 40-sec neural stimulations in CADASIL patients. These results were replicated in a second cohort of 10 patients and 10 controls and confirmed in the whole population.

Interpretation: Alterations of neurovascular coupling occur early in CADASIL and can be assessed by ASL-fMRI using a simple marker of vascular dysfunction.


Figures

Figure 1
Figure 1
Neural stimulation procedures, acquisition protocol and selection of regions of interest. (A) Visual and motor cortex areas were simultaneously activated with a visually cued motor task. The visual stimulation used was a black and white checkerboard flickering at 6 Hz. The motor task was an open‐close hand movement performed at 1 Hz. (B) 20‐ and 40‐sec stimulation blocks were randomly distributed and interleaved with 40‐sec rest periods. (C) EEG recording during the fMRI experiment allowed measurement of the P100 wave (at 100 msec) from visual evoked potentials during visual stimulations. (D) Schematic summary of the pseudo‐continuous arterial spin labeling (pCASL) fMRI imaging protocol and processing procedure. Labeling slice and imaged field of view of the pCASL sequence are shown projected on a T1‐weighted image from a control subject. ICA: independent component analysis.
Figure 2
Figure 2
Mean amplitude of functional hyperemia in visual and motor cortexes. (A and B) ROIs projected on the surface of the primary visual cortex and motor (hand) cortex (B) in a representative control subject. The ROI selected is shown in green, and calcarine and central sulci are marked by white dashed lines. (C and D) Average increase in CBF during 20‐ and 40‐sec stimulations in visual (C) and motor (D) ROIs are presented as violin plots for controls and patients, where points and lines represent means and standard deviations, respectively, and the width represents the frequency of data at different values. (E and F) Time series of functional hyperemia during 20‐ and 40‐sec stimulations in visual ROIs (E) and motor ROIs (F). Error bars represent standard deviations between subjects in each group. Dark gray bars represent the observed differences between mean values in control subjects and patients over each time frame.
Figure 3
Figure 3
Analysis of functional hyperemia dynamics and P100 waves during neural tasks. (A and B) Functional hyperemia in the visual cortex (A) and sensorimotor cortex (B) during activation (after an initial 5‐sec period of rapid increase) was fitted using a piecewise (succession of 5‐sec steps) linear mixed‐effects model in 19 patients and 19 controls. Likelihood ratio tests showed a significant difference in the dynamics (slopes) of the response between patients (red) and controls (blue) that was larger at the end phase of the stimulation period for long‐lasting stimulations (**P < 0.01, ***P < 0.001). Changes in functional hyperemia dynamics were mainly detected between 15 and 30 sec (yellow). Dark gray bars represent the difference between mean CBF values measured at different time intervals in control subjects and patients. (C) Average values (solid line) of evoked potentials (shown with their standard deviation, dotted line) obtained after each visual reversal stimulation did not differ between the two groups. (D) Analysis of P100 waves over 5‐sec segments using the piecewise linear mixed‐effects model showed no significant difference over the entire duration of stimulation between the two groups.
Figure 4
Figure 4
Slope of functional hyperemia over the 15–30‐sec time frame in patients and controls. An analysis of the CBF response, performed by comparing the slopes between 15 sec and 30 sec (yellow segment in figure 3) after the stimulus onset using a simple single‐segment linear regression model, showed a significant difference between 19 patients and 19 controls in visual (P = 0.00723) and motor (P = 0.000907) ROIs. Similar results were obtained in an analysis of a replication sample of 10 patients and 10 additional healthy individuals. Conversely, results obtained using the same analysis of P100 amplitudes derived from EEG records in the visual cortex showed no significant difference between the two groups (P = 0.928). *P < 0.05; **P < 0.01; ***P < 0.001
Figure 5
Figure 5
Functional hyperemic responses in the entire population. (A and B) Functional hyperemia in the visual cortex (A) and sensorimotor cortex (B) during activation was fitted in the whole population (29 patients and 29 controls) as was previously done using the piecewise linear mixed‐effects model. Likelihood ratio tests showed a significant difference between the dynamics (slopes) of the response obtained in patients (red) and controls (blue) for long‐lasting stimulations (***P < 0.001). Changes in functional hyperemia dynamics appeared between 15 and 30 sec (yellow). Dark gray bars represent differences between mean CBF values measured at the different time intervals in control subjects and patients. The CBF response analyzed by comparing the slopes between 15 and 30 sec after the stimulus onset using a simple, single‐segment linear‐regression model confirmed the highly significant difference between the 29 patients and 29 controls.

References

    1. Longden TA, Hill‐Eubanks DC, Nelson MT. Ion channel networks in the control of cerebral blood flow. J Cereb Blood Flow Metab 2016;36:492–512. - PMC - PubMed
    1. Iadecola C. The Neurovascular Unit Coming of Age: a Journey through Neurovascular Coupling in Health and Disease. Neuron 2017;96:17–42. - PMC - PubMed
    1. Chabriat H, Joutel A, Dichgans M, et al. Cadasil. Lancet Neurol 2009;8:643–653. - PubMed
    1. Tournier‐Lasserve E, Joutel A, Melki J, et al. Cerebral autosomal dominant arteriopathy with subcortical infarcts and leukoencephalopathy maps to chromosome 19q12. Nat Genet 1993;3:256–259. - PubMed
    1. Monet‐Lepretre M, Haddad I, Baron‐Menguy C, et al. Abnormal recruitment of extracellular matrix proteins by excess Notch3 ECD: a new pathomechanism in CADASIL. Brain 2013;136(Pt 6):1830–1845. - PMC - PubMed

LinkOut - more resources