. 2018 Nov;78(15):1140-1156.
doi: 10.1002/pros.23689. Epub 2018 Jul 15.

Inhibition of androgen receptor transactivation function by adenovirus type 12 E1A undermines prostate cancer cell survival

Affiliations

Inhibition of androgen receptor transactivation function by adenovirus type 12 E1A undermines prostate cancer cell survival

Dawei Li et al. Prostate. 2018 Nov.

Abstract

Background: Mutations or truncation of the ligand-binding domain (LBD) of androgen receptor (AR) underlie treatment resistance for prostate cancer (PCa). Thus, targeting the AR N-terminal domain (NTD) could overcome such resistance.

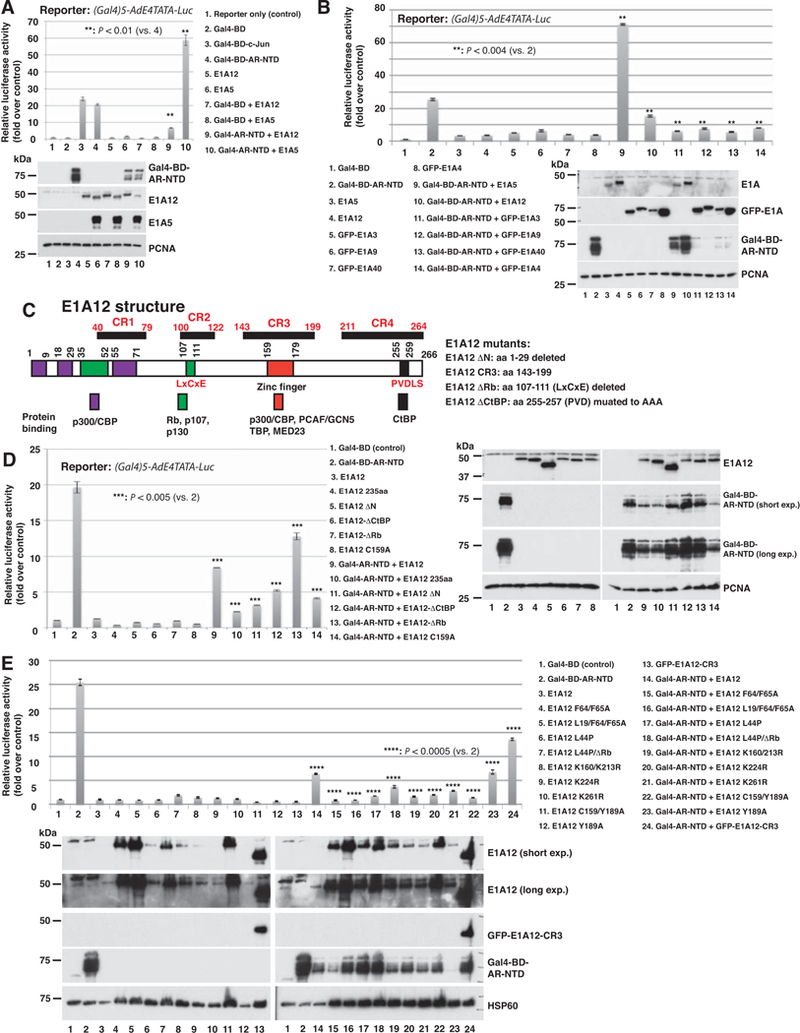
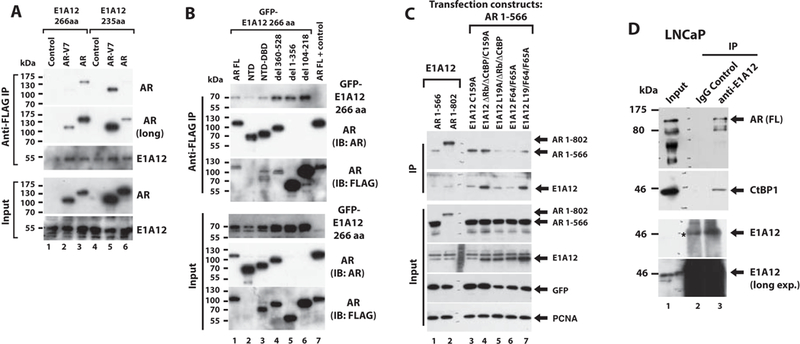
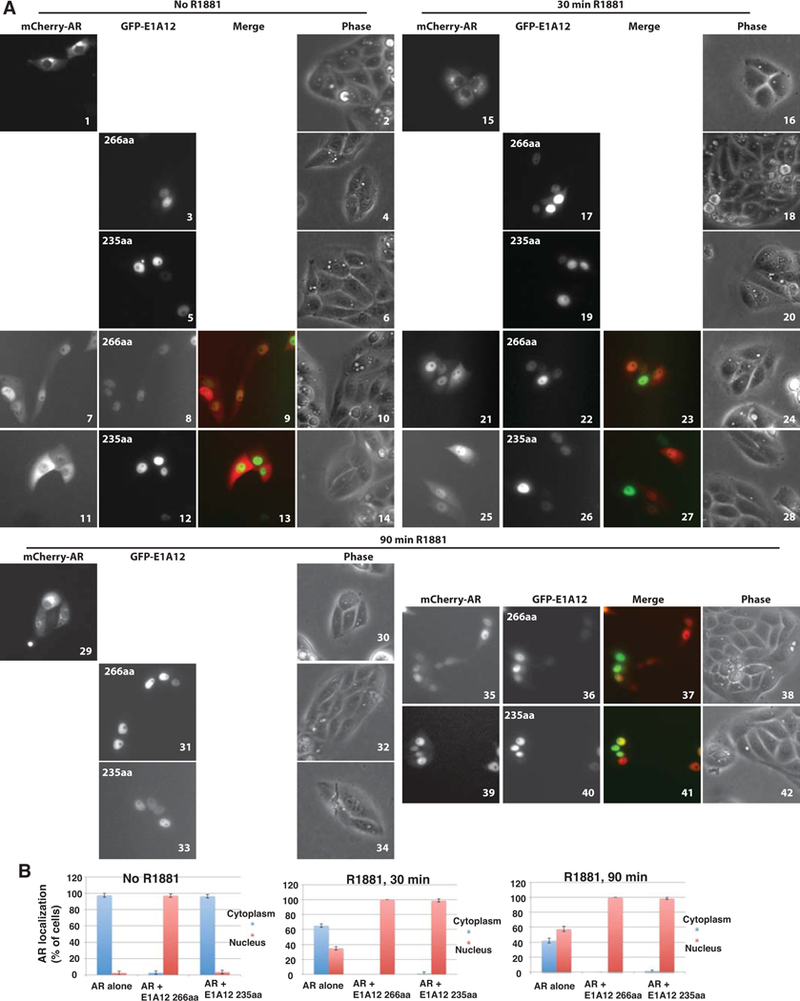
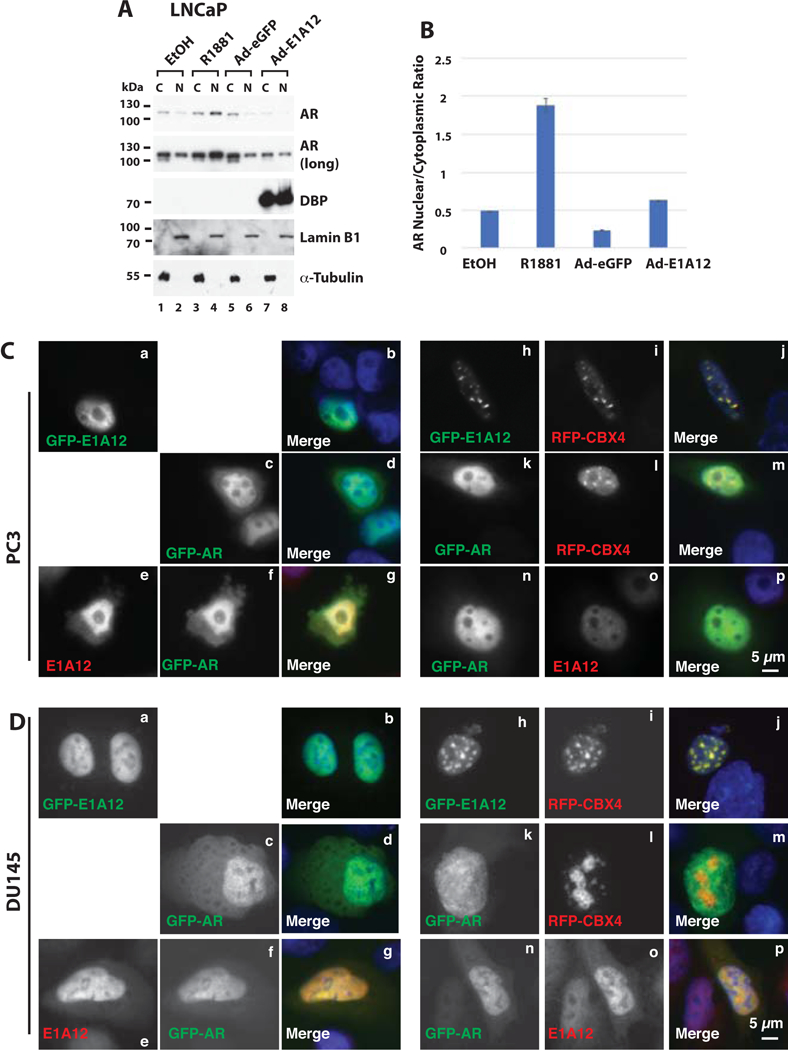
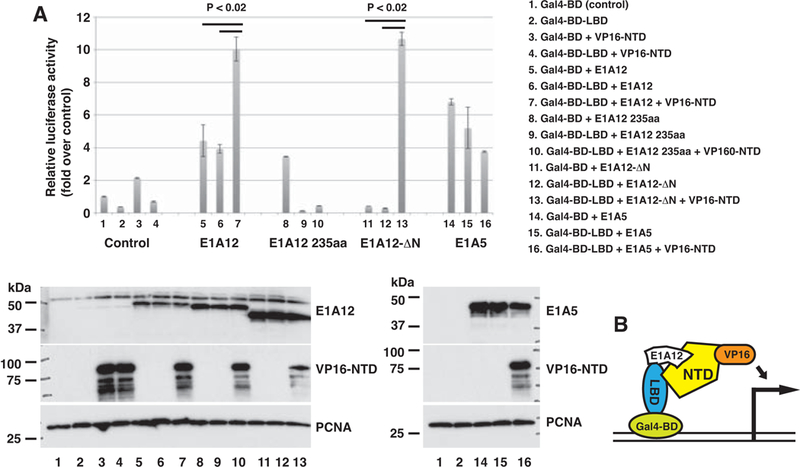
Methods: Luciferase reporter assays after transient transfection of various DNA constructs were used to assess effects of E1A proteins on AR-mediated transcription. Immunofluorescence microscopy and subcellular fractionation were applied to assess intracellular protein localization. Immunoprecipitation and mammalian two-hybrid assays were used to detect protein-protein interactions. qRT-PCR was employed to determine RNA levels. Western blotting was used to detect protein expression in cells. Effects of adenoviruses on prostate cancer cell survival were evaluated with CellTiter-Glo assays.

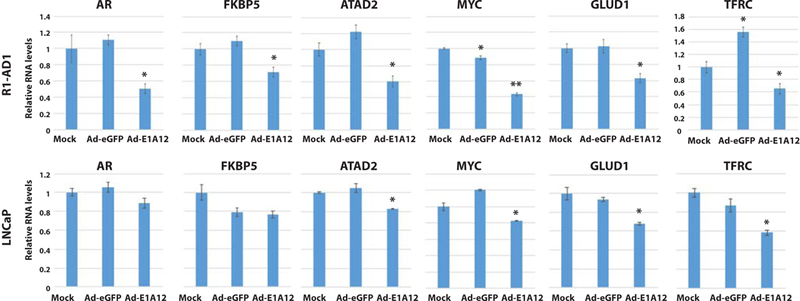
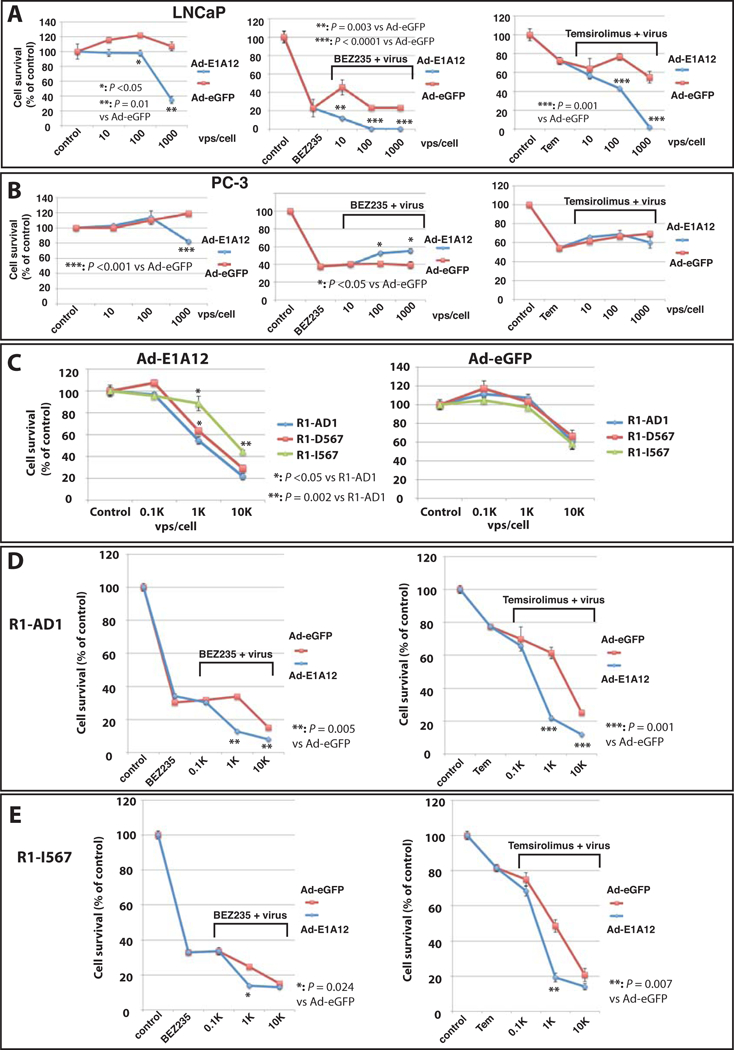
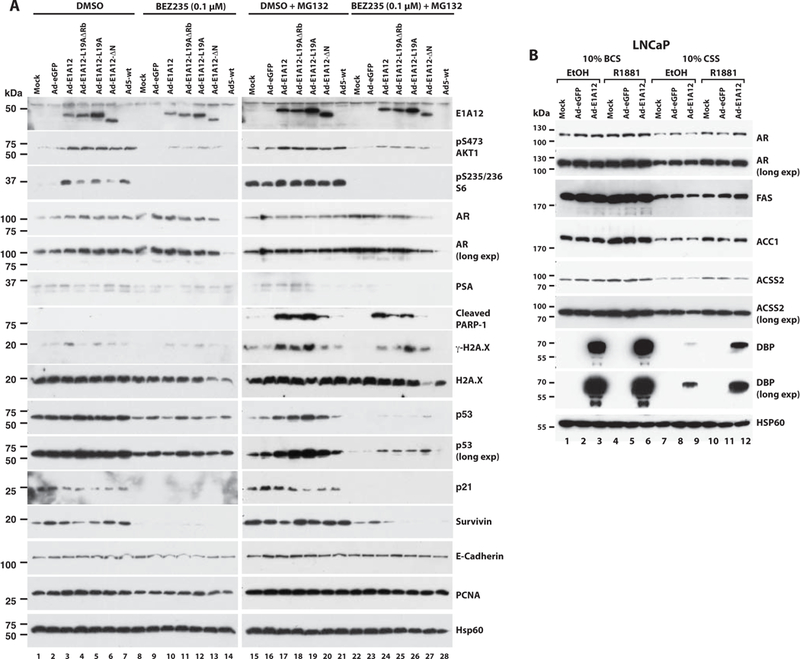
Results: Adenovirus 12 E1A (E1A12) binds specifically to the AR. Interestingly, the full-length E1A12 (266 aa) preferentially binds to full-length AR, while the small E1A12 variant (235 aa) interacts more strongly with AR-V7. E1A12 promotes AR nuclear translocation, likely through mediating intramolecular AR NTD-LBD interactions. In the nucleus, AR and E1A12 co-expression in AR-null PCa cells results in E1A12 redistribution from nuclear foci containing CBX4 (also known as Pc2), suggesting a preferential AR-E1A12 interaction over other E1A12 interactors. E1A12 represses AR-mediated transcription in reporter gene assays and endogenous AR target genes such as ATAD2 and MYC in AR-expressing PCa cells. AR-expressing PCa cells are more sensitive to death induced by a recombinant adenovirus expressing E1A12 (Ad-E1A12) than AR-deficient PCa cells, which could be attributed to the increased viral replication promoted by androgen stimulation. Targeting the AR by E1A12 promotes apoptosis in PCa cells that express the full-length AR or C-terminally truncated AR variants. Importantly, inhibition of mTOR signaling that blocks the expression of anti-apoptotic proteins markedly augments Ad-E1A12-induced apoptosis of AR-expressing cells. Mechanistically, Ad-E1A12 infection triggers apoptotic response while activating the PI3K-AKT-mTOR signaling axis; thus, mTOR inhibition enhances apoptosis in AR-expressing PCa cells infected by Ad-E1A12.

Conclusion: Ad12 E1A inhibits AR-mediated transcription and suppresses PCa cell survival, suggesting that targeting the AR by E1A12 might have therapeutic potential for treating advanced PCa with heightened AR signaling.

Keywords: AR splice variants (AR-Vs); PI3K-kinase (PI3K)-Akt-mTOR signaling; androgen receptor; prostate cancer gene therapy; transcriptional regulation.


Conflict of interest statement

CONFLICTS OF INTEREST

There are no conflicts of interest to disclose.

Figures

Figure 1.
Figure 1.. E1A12 represses the AR-mediated transactivation.
(A) E1A12 inhibits, but Ad5 E1A (E1A5) activates, AR NTD-mediated transactivation. The luciferase reporter containing five tandem Gal4-binding sites was cotransfected with the indicated constructs or the combinations thereof into Saos-2 cells. Luciferase activity was measured 24 h after transfection. Shown are the average values of relative reporter activity from three independent transfections along with the standard error of the mean (SEM). Lower panel: the expression of transfected constructs was detected with Western blotting. (B) The large isoforms of E1A from Ad3 (E1A3), Ad9 (E1A9), Ad40 (E1A40) and Ad4 (E1A4) also suppress the AR NTD. Luciferase reporter assays were done as in (A). Western blotting data of the transfected cells are shown in the lower panel. The Ad5 and Ad12 E1As were detected with an antiserum raised against Ad12 E1A, whereas the E1As from other Ad species were detected with an anti-GFP antibody. (C) The domain structure of E1A12. The conserved regions (CR1-CR4) along with sequences that bind to cellular proteins are depicted. The numbers refer to the positions of amino acid residues. The mutant constructs of E1A12 with specific point mutations or deletions that were used for reporter assays are also shown. (D and E) Effects of E1A12 mutations on AR NTD-mediated transcription. The reporter assays were done as in (A). Western blotting data of the transfected constructs are also shown.
Figure 2.
Figure 2.. E1A12 266 aa and 235 aa interact with the AR.
(A) Co-IP of E1A12 266 aa and 235 aa with the full-length AR or AR-V7. 293T cells were transfected with vectors expressing FLAG-E1A12 (266 aa or 235 aa), mCherry-full-length AR, or GFP-AR-V7 as indicated. The lysates of the transfected cells were subject to anti-FLAG IP. (B) The indicated FLAG-AR constructs (full-length (FL), NTD (1–566), NTD-DBD (aa 1–623), del 360–528, del 1–356 and del 104–218) along with GFP-E1A12 266 aa were transfected into 293T cells. Cotransfection of the FLAG-AR FL along with a control plasmid serves as a control (lane 7). anti-FLAG IP was done as in (A). Note that the AR mAb (Cell Signaling Technology #5153) used for Western blotting did not bind to the AR del 1–356 and AR del 104–216. The anti-FLAG mAb M2 was used to detect these constructs. (C) Interactions of the E1A12 mutants and the AR NTD. The indicated constructs were transfected into Saos-2 cells, and the extracts of the transfected cells were subjected to IP with an anti-E1A12 antibody and the co-precipitated proteins were detected with an anti-AR NTD antibody. The GFP construct was included as a control for transfection and PCNA was detected as a loading control. (D) E1A12 binds to the endogenous AR. LNCaP cells were infected with Ad-E1A12 and the extracts of the infected cells were subjected to IP with a polyclonal anti-E1A12 antibody. The control IP was done with a rabbit IgG antibody. The coprecipitated materials were analyzed by SDS-PAGE and Western blotting with a mouse monoclonal anti-AR antibody. The known E1A-binding protein CtBP1 was detected as a positive control. Note that E1A12 (lane 3) appeared at the same position as a cross-reactive band in the IgG (control) lane (denoted with *, lane 2).
Figure 3.
Figure 3.. E1A12 promotes AR nuclear entry independently of androgens.
(A) Saos-2 cells were transfected with GFP-E1A12 266aa, 235aa, or mCherry-AR alone, or a combination thereof. At 8 h after transfection, the culture medium was removed and cells were washed with PBS. The DMEM medium supplemented with 10% CSS was then added to the culture plates. Cells were imaged at 24 h after transfection. Immediately after the initial imaging, the androgen analog R1881 was added to the cell cultures to the final concentration of 1 nM. The cells were then imaged at the indicated times after R1881 addition. Representative images are shown. (B) Quantification of AR subcellular localization. Cells exhibiting exclusive or predominant nuclear AR signal are grouped as cells with nuclear AR; likewise, cells with exclusive or predominant cytoplasmic AR signal are shown as cells with AR in the cytoplasm. For each transfection experiment, over 100 transfected cells in five random microscopic fields were quantified. The average percent values of the five fields along with SEM are shown.
Figure 4.
Figure 4.. E1A12 enhances the nuclear translocation of endogenous AR.
(A) LNCaP cells were cultured with DMEM medium with 10% CSS in a in 6-well plate. Cells were then exposed to ethanol, R1881 (10 nM), Ad-eGFP, or Ad-E1A12 (MOI at about 1,000 viral particles per cells) as indicated. At 48 h after treatment, cells were fractionated into the cytoplasmic (C) and nuclear (N) fractions. An equal amount of proteins in each fraction was loaded for SDS-PAGE and Western blotting with antibodies against the indicated proteins. (B) Quantification of AR levels in the cytoplasm and nucleus. The protein levels shown in (A) were quantified with the ImageJ software. The images of the blots after exposure for different lengths of time were analyzed and the mean band intensities were averaged. Shown is a bar graph of the ratio of the nuclear AR band intensity to that of cytoplasmic AR along with the calculated standard deviations. (C and D) Co-localization of E1A12 266aa and AR. E1A12 266aa, GFP-AR, RFP-CBX4 were expressed alone or in various combinations in PC-3 cells (C) and DU-145 (D) via transient transfection. Cells were fixed 24 h after transfection. In the cells transfected with E1A12 266aa and GFP-AR, E1A12 266aa was detected with a rabbit polyclonal antibody and goat anti-rabbit IgG conjugated to Alexa Fluor 594 fluorescent dye. AR and CBX4 were detected through the GFP and RFP tag, respectively. Cells shown in panels n to p in both C and D were also transfected with an untagged CBX4 construct that was not detected.
Figure 5.
Figure 5.. The E1A12 266 aa variant bridges the AR N/C interaction.
(A) The AR LBD (690–919) was fused to the Gal4-BD and the AR NTD (1–566) was attached to the VP16 activation domain. The luciferase reporter used in Fig. 1 along with a sea pansy (Renilla) luciferase reporter were cotransfected with the indicated plasmids into Saos-2 cells. Dual luciferase assays were conducted as in Fig. 1. Shown are average values along with SEM of three experiments. The P values were calculated based on Student’s t test. The expression of the transfected constructs is detected in a Western blot (lower panels). (B) A cartoon showing an E1A12 266aa-mediated AR NTD-LBD interaction.
Figure 6.
Figure 6.. Downregulation of AR target genes by E1A12 266aa.
R1-AD1 and LNCaP cells were mock treated or infected with Ad-eGFP or Ad-E1A12 as in Fig. 4A. At 48 h post infection, RNAs were isolated and subjected to qRT-PCR with primers specific to the indicated genes. The mRNA levels were normalized against that of ACTB. Shown are average values of the relative RNA levels to the control (mock) along with SEM. *: P <0.05; **: P <0.01 (Student’s t test).
Figure 7.
Figure 7.. Ad-E1A12 in combination with pharmacological mTOR inhibition effectively kills PCa cells with AR expression.
PCa cell lines LNCaP (A), PC-3 (B) and R1-AD1 and its derivatives (C, D and E) were infected with Ad-eGFP or Ad-E1A12 at the indicated MOIs. These cell lines were also treated with DMSO (control), an indicated mTOR inhibitor at 0.1 μM alone, or together with the viruses at various MOIs as indicated. Cell viability assays were conducted at 96 h post infection with CellTiter-Glo assay kit. Shown are average values along with SEM of three experiments. Tem: temsirolimus. The P values were calculated using Student’s t test.
Figure 8.
Figure 8.. Functional impact of Ad-E1A12 on AR and cell death.
(A) LNCaP cells were uninfected (mock) or infected with an indicated virus (100 viral particles/cell). At 2 h after adding virus, the cells were either exposed to the solvent (DMSO) or BEZ235 (0.1 μM). In a separate set of cell cultures, the proteasome inhibitor MG132 was also added 6 h before cell lysis to the final concentration of 27 μM. At 24 h post infection, cells were harvested for Western blotting analysis with antibodies against the indicated proteins. E-Cadherin, PCNA and Hsp60 were detected as loading controls. (B) LNCaP cells were cultured in DMEM medium with 10% of a regular serum (bovine calf serum, BCS) or 10% CSS as indicated. Cells were treated with ethanol, or R1881 (10 nM), and then infected with Ad-eGFP or Ad-E1A12. Cell lysates were subject to SDS-PAGE and Western blotting as in A.

References

    1. Siegel R, Naishadham D, Jemal A. Cancer statistics, 2013. CA Cancer J Clin 2013;63(1):11–30. - PubMed
    1. van de Wijngaart DJ, Dubbink HJ, van Royen ME, Trapman J, Jenster G. Androgen receptor coregulators: recruitment via the coactivator binding groove. Mol Cell Endocrinol 2012;352(1–2):57–69. - PubMed
    1. Wang Q, Li W, Liu XS, Carroll JS, Janne OA, Keeton EK, Chinnaiyan AM, Pienta KJ, Brown M. A hierarchical network of transcription factors governs androgen receptor-dependent prostate cancer growth. Mol Cell 2007;27(3):380–392. - PMC - PubMed
    1. McEwan IJ. Intrinsic disorder in the androgen receptor: identification, characterisation and drugability. Mol Biosyst 2012;8(1):82–90. - PubMed
    1. Aarnisalo P, Palvimo JJ, Janne OA. CREB-binding protein in androgen receptor-mediated signaling. Proc Natl Acad Sci U S A 1998;95(5):2122–2127. - PMC - PubMed

Publication types