

Changing Trends in Etiology-Based Annual Mortality From Chronic Liver Disease, From 2007 Through 2016
- PMID: 30009816
- PMCID: PMC6467699
- DOI: 10.1053/j.gastro.2018.07.008
Changing Trends in Etiology-Based Annual Mortality From Chronic Liver Disease, From 2007 Through 2016
Abstract
Background & aims: Although treatment of hepatitis C virus (HCV) infection has improved, the prevalence of alcoholic liver disease (ALD) has been increasing, so we need an updated estimate of the burden and etiology-specific mortality of chronic liver diseases. We studied trends in age-standardized mortality of chronic liver diseases in adults at least 20 years old in the United States from 2007 through 2016.
Methods: We collected data from the US Census and National Center for Health Statistics mortality records and identified individuals with HCV infection, ALD, nonalcoholic fatty liver disease, or hepatitis B virus infection using ICD-10 codes. We obtained temporal mortality rate patterns using joinpoint trend analysis with estimates of annual percentage change (APC).
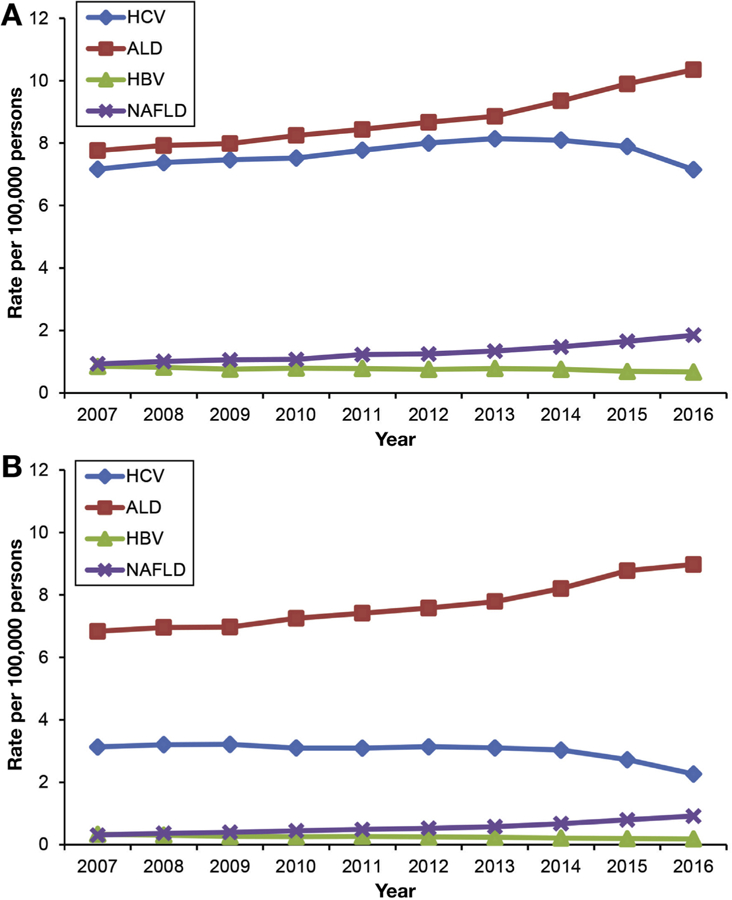
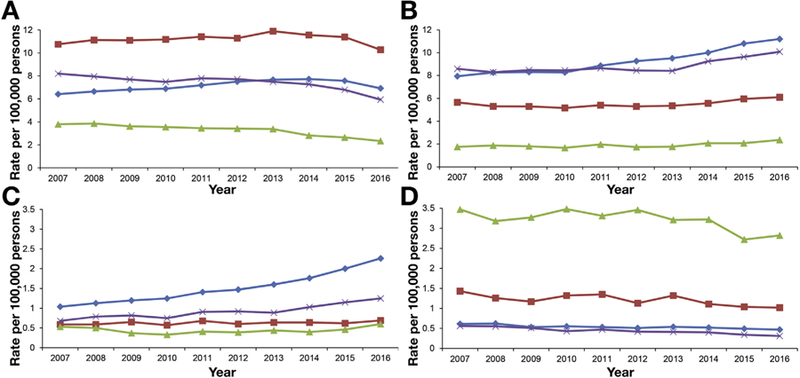
Results: Age-standardized HCV-related mortality increased from 7.17 per 100,000 persons in 2007 to 8.14 per 100,000 persons in 2013, followed by a marked decrease in the time period at which patients began receiving treatment with direct-acting antiviral agents (from 8.09 per 100,000 persons in 2014 to 7.15 per 100,000 persons in 2016). The APC in HCV mortality increased 2.0%/year from 2007 through 2014 but decreased 6.4%/year from 2014 through 2016. In contrast, age-standardized mortality increased for ALD (APC 2.3% from 2007 through 2013 and APC 5.5% from 2013 through 2016) and nonalcoholic fatty liver disease (APC 6.1% from 2007 through 2013 and APC 11.3% from 2013 through 2016). Mortality related to hepatitis B virus decreased steadily from 2007 through 2016, with an average APC of -2.1% (95% CI -3.0 to -1.2). Etiology-based mortality in minority populations was higher. HCV-related mortality (per 100,000 persons) was highest in non-Hispanic blacks (10.28) and whites (6.92), followed by Hispanics (5.94), and lowest in non-Hispanic Asians (2.33). Non-Hispanic Asians had higher mortality for hepatitis B virus infection (2.82 per 100,000 vs 1.02 for non-Hispanic blacks and 0.47 for non-Hispanic whites).
Conclusion: In our population-based analysis of chronic liver disease mortality in the United States, the decrease in HCV-related mortality coincided with the introduction of direct-acting antiviral therapies, whereas mortality from ALD and nonalcoholic fatty liver disease increased during the same period. Minorities in the United States have disproportionately higher mortality related to chronic liver disease.
Keywords: Alcohol-Related Liver Disease; Direct-Acting Antiviral; National Center for Health Statistics; Steatosis.
Copyright © 2018 AGA Institute. Published by Elsevier Inc. All rights reserved.
Conflict of interest statement
Conflicts of interest
Authors declare no relevant conflicts of interest.
Figures
Comment in
-
Liver-related mortality in the United States: hepatitis C declines, non-alcoholic fatty liver and alcohol rise.Transl Gastroenterol Hepatol. 2019 Mar 22;4:19. doi: 10.21037/tgh.2019.03.04. eCollection 2019. Transl Gastroenterol Hepatol. 2019. PMID: 30976722 Free PMC article. No abstract available.
References
-
- World Health Organization. Hepatitis C Available at: http://www.who.int/mediacentre/factsheets/fs164/en/. Accessed April 2018.
-
- Chak E, Talal AH, Sherman KE, et al. Hepatitis C virus infection in USA: an estimate of true prevalence. Liver Int 2011;31:1090–1101. - PubMed
Publication types
MeSH terms
Substances
Grants and funding
LinkOut - more resources
Full Text Sources
Other Literature Sources
Medical
