. 2018 Jul 16:10.1109/TBCAS.2018.2852267.
doi: 10.1109/TBCAS.2018.2852267. Online ahead of print.

A High-Resolution Opto-Electrophysiology System With a Miniature Integrated Headstage

A High-Resolution Opto-Electrophysiology System With a Miniature Integrated Headstage

Adam E Mendrela et al. IEEE Trans Biomed Circuits Syst. .

Abstract

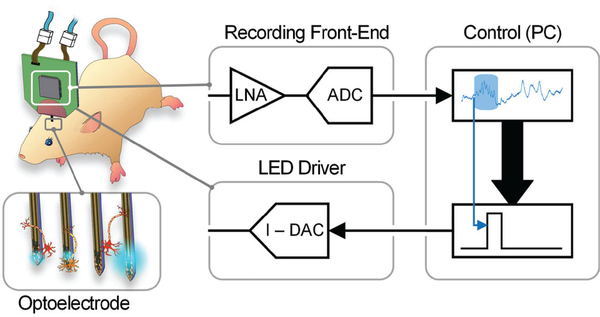
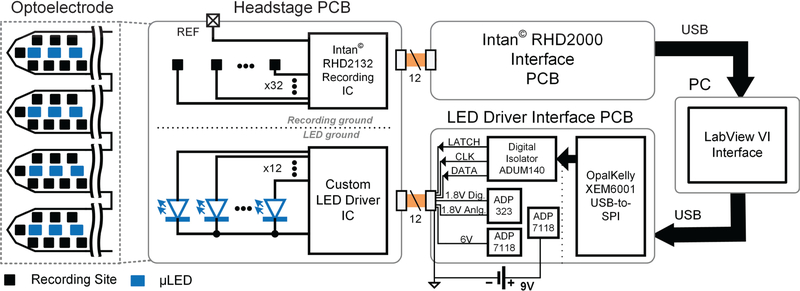
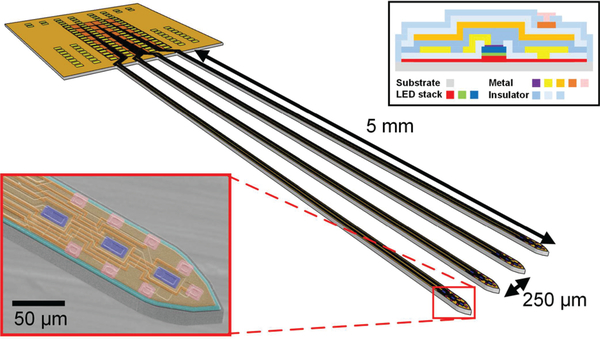
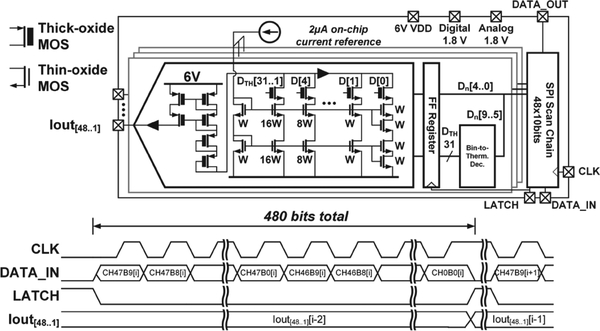
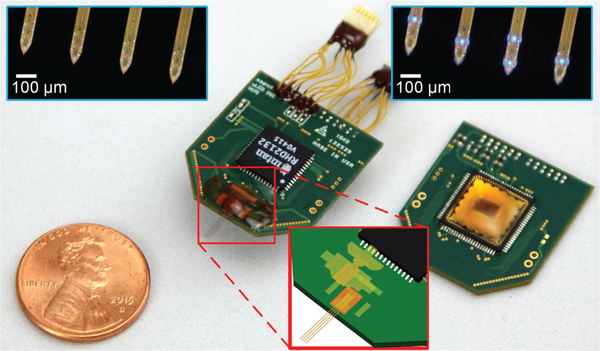
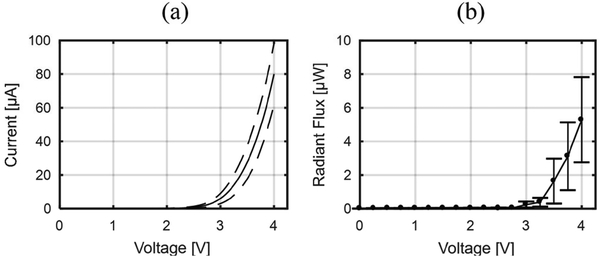
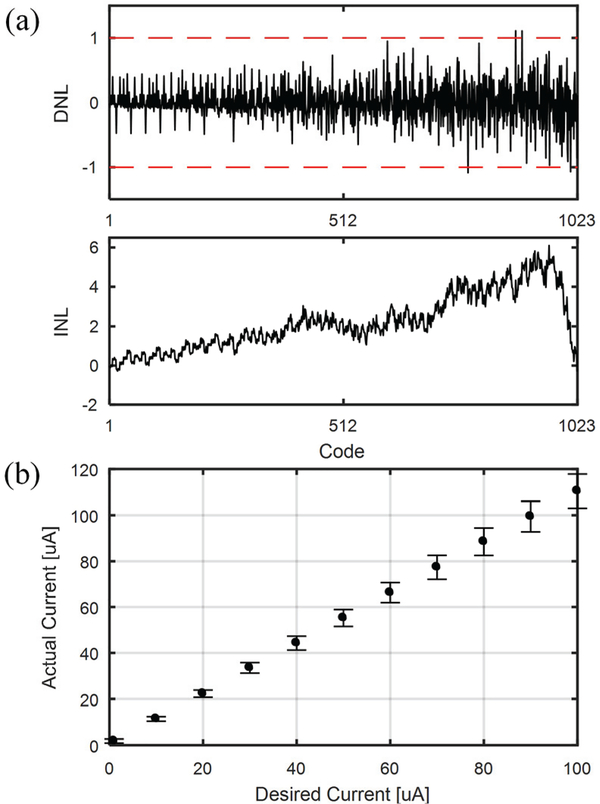
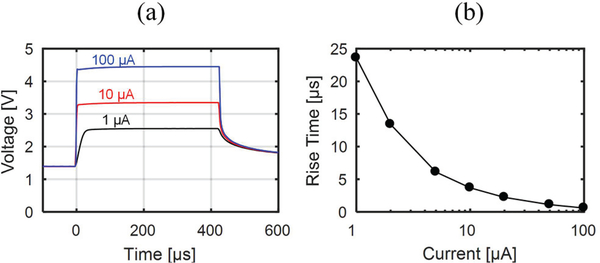
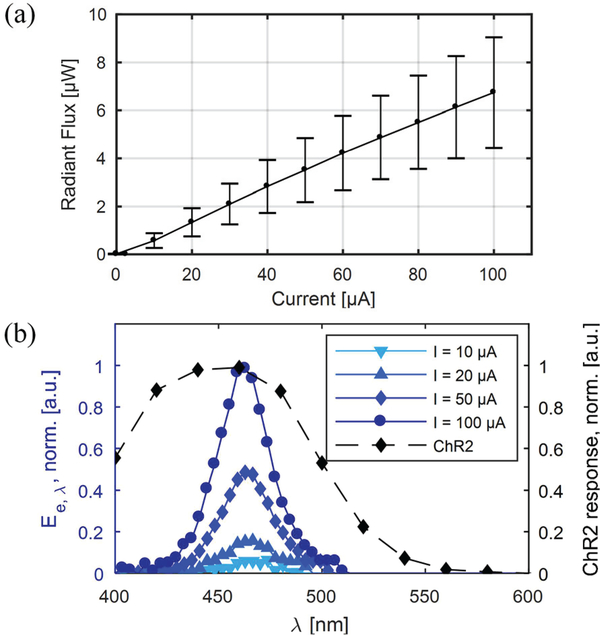
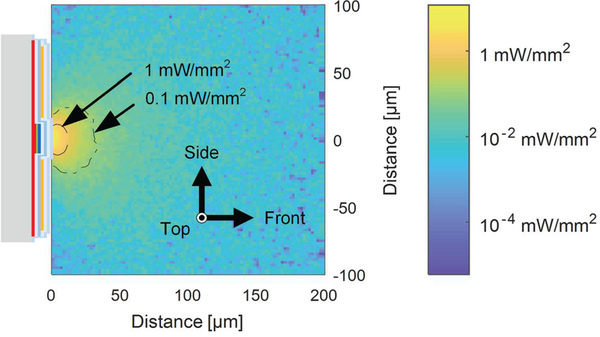
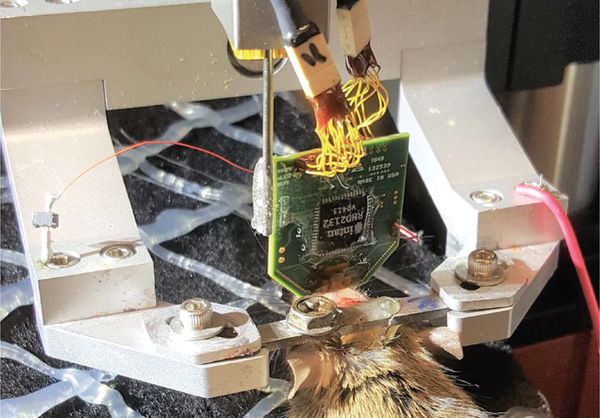
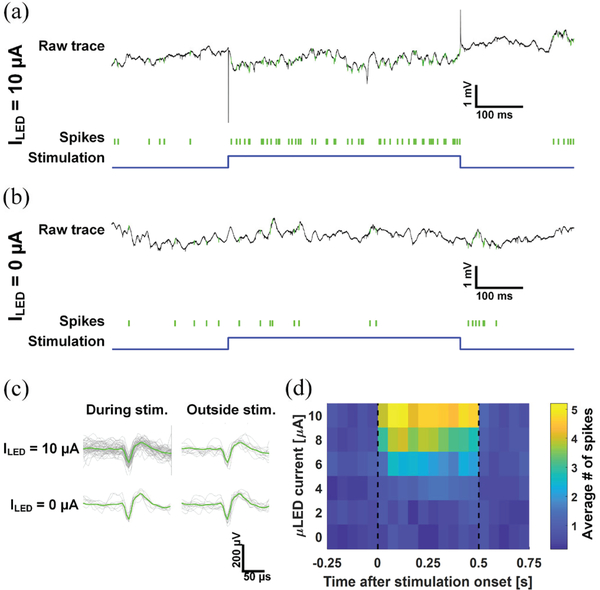
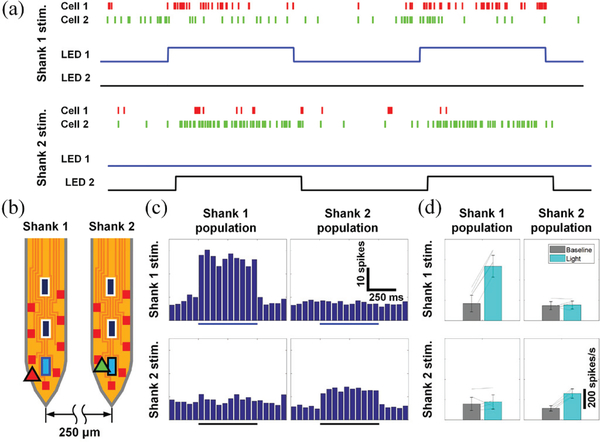
This work presents a fully integrated neural interface system in a small form factor (1.9 g), consisting of a μLED silicon optoelectrode (12 μLEDs and 32 recording sites in a 4-shank configuration), an Intan 32-channel recording chip, and a custom optical stimulation chip for controlling 12 μLEDs. High-resolution optical stimulation with approximately 68.5 nW radiant flux resolution is achieved by a custom LED driver ASIC, which enables individual control of up to 48 channels with a current precision of 1 μA, a maximum current of 1.024 mA, and an update rate of >10 kHz. Recording is performed by an off-the-shelf 32-channel digitizing front-end ASIC from Intan. Two compact custom interface printed circuit boards were designed to link the headstage with a PC. The prototype system demonstrates precise current generation, sufficient optical radiant flux generation , and fast turn-on of μLEDs . Single animal in vivo experiments validated the headstage's capability to precisely modulate single neuronal activity and independently modulate activities of separate neuronal populations near neighboring optoelectrode shanks.


Figures

Fig. 1.
Fig. 1.
Schematic diagram of the opto-electrophysiology system in closed-loop configuration.
Fig. 2.
Fig. 2.
System circuit diagram showing the connections between the headstage PCB with integrated optoelectrode and recording and LED driver ICs, interface boards providing power and communication for the recording and LED driver ICs, and the PC-based LabView VI Interface.
Fig. 3.
Fig. 3.
LabVIEW-based user interface for individual μLED control. In the inset, the channel 1 μLED located on top of the leftmost shank is configured to pulse at 1Hz frequency with 50% duty cycle and 10μA current amplitude.
Fig. 4.
Fig. 4.
Schematic diagram of the μLED optoelectrode. The insets show (bottom left) SEM image of the tip of a shank of the fabricated optoelectrode with coloring for visualization and (top right) the cross-section of the optoelectrode [19]. Modified from [20].
Fig. 5.
Fig. 5.
LED driver ASIC schematic and input/output signal timing diagram. Modified from [20].
Fig. 6.
Fig. 6.
Chip microphotograph of μLED Driver ASIC chip. Modified from [20].
Fig. 7.
Fig. 7.
Photographs of the assembled headstages. Insets show (top) microphotographies of the tips of the optoelectrodes, and (bottom) the schematic diagram of the polyimide-based flexible cable interposer. The light leakage from the sides of the optoelectrode shank, shown in the top right inset, is an artifact due to the combination of poor light coupling efficiency in the air and high optical output power. Modified from [20].
Fig. 8.
Fig. 8.
The opto-electrical characteristics of μLEDs (n = 7) on the fabricated μLED optoelectrode: (a) I vs. V curves and (b) output radiant optical flux vs. V curves. Dotted lines and the error bars represent one standard deviations from the mean.
Fig. 9.
Fig. 9.
DC output current measurements of the fabricated LED driver chip showing (a) differential and integral non-linearity plots, and (b) mean current measurements across 19 dies. Error bars represent one standard deviation from the mean.
Fig. 10.
Fig. 10.
(a) μLED anode voltage transient response to 3 current pulses of varying amplitudes and (b) plot of changing μLED anode voltage rise time with increasing driving current pulse amplitude.
Fig. 11.
Fig. 11.
The optical characteristics of the μLEDs on the fabricated μLED optoelectrode showing (a) average e vs. I curve (n = 7) and (b) the normalized spectral radiant flux of the μLED at different forward current (with the spectral response of ChR2).
Fig. 12.
Fig. 12.
Irradiance distribution inside the brain tissue by μLED illumination, on the axial cross-sectional plane with the origin located at the center of the μLED surface. The thickness of the LED, metal, and dielectric layers are not drawn to scale.
Fig. 13.
Fig. 13.
In vivo measurement setup of the headstage. The optoelectrode is implanted into an anesthetized mouse [20].
Fig. 14.
Fig. 14.
In vivo measurements validating the light-induced neuronal activity: raw signals recorded from an electrode as well as the raster plots of spikes from an optically excited neuron during a pulsed stimulation with (a) 10 μA and (b) 0 μA forward currents, (c) waveform of the action potential during the off- and the on-time of the pulse, and (d) peristimulus time histograms of the neuron at different on-time forward currents. Modified from [20].
Fig. 15.
Fig. 15.
In vivo measurements validating selective location neural stimulation: (a) raster plots of spikes from two optically excited neurons responding to different μLEDs, (b) estimated locations of the neurons and the μLEDs, (c) peristimulus time histograms of the neuronal firing around shanks with the respective μLEDs, and (d) averaged (ncycles = 20) baseline and optically induced population spiking rates. Two-sided Wilcoxon’s signed rank test confirms that activities of only the neurons in the vicinity of an activated LED shank are significantly affected by light (for LED 1, pshank 1 = 0.001, pshank 2 = 0.83, for LED 2, pshank 1 = 0.05, pshank 2 = 0.001). Modified from [20].

References

    1. Boyden ES, Zhang F, Bamberg E, Nagel G, and Deisseroth K, “Millisecond-timescale, genetically targeted optical control of neural activity,” Nat. Neurosci, vol. 8, no. 9, pp. 1263–1268, 2005. - PubMed
    1. Bolus MF, Willats AA, Whitmire CJ, Rozell CJ, and Stanley GB, “Design strategies for dynamic closed-loop optogenetic neurocontrol in vivo,” J. Neural Eng, 2018. - PMC - PubMed
    1. Grosenick L, Marshel JH, and Deisseroth K, “Closed-loop and activity-guided optogenetic control,” Neuron, vol. 86, pp. 106–139, 2015. - PMC - PubMed
    1. Anikeeva P, Andalman AS, Witten I, Warden M, Goshen I, Grosenick L, Gunaydin LA, Frank LM, and Deisseroth K, “Optetrode: A multichannel readout for optogenetic control in freely moving mice,” Nat. Neurosci, vol. 15, no. 1, pp. 163–170, 2012. - PMC - PubMed
    1. Lee J, Ozden I, Song YK, and Nurmikko AV, “Transparent intracortical microprobe array for simultaneous spatiotemporal optical stimulation and multichannel electrical recording,” Nat. Methods, vol. 12, no. 12, pp. 1157–1162, 2015. - PubMed