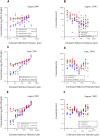
Bioaccumulation of methylmercury within the marine food web of the outer Bay of Fundy, Gulf of Maine
- PMID: 30011281
- PMCID: PMC6047777
- DOI: 10.1371/journal.pone.0197220
Bioaccumulation of methylmercury within the marine food web of the outer Bay of Fundy, Gulf of Maine
Abstract
Mercury and methylmercury were measured in seawater and biota collected from the outer Bay of Fundy to better document mercury bioaccumulation in a temperate marine food web. The size of an organism, together with δ13 C and δ15 N isotopes, were measured to interpret mercury levels in biota ranging in size from microplankton (25μm) to swordfish, dolphins and whales. Levels of mercury in seawater were no different with depth and not elevated relative to upstream sources. The δ13 C values of primary producers were found to be inadequate to specify the original energy source of various faunas, however, there was no reason to separate the food web into benthic, demersal and pelagic food chains because phytoplankton has been documented to almost exclusively fuel the ecosystem. The apparent abrupt increase in mercury content from "seawater" to phytoplankton, on a wet weight basis, can be explained from an environmental volume basis by the exponential increase in surface area of smaller particles included in "seawater" determinations. This physical sorption process may be important up to the macroplankton size category dominated by copepods according to the calculated biomagnification factors (BMF). The rapid increase in methylmercury concentration, relative to the total mercury, between the predominantly phytoplankton (<125μm) and the zooplankton categories is likely augmented by gut microbe methylation. Further up the food chain, trophic transfer of methylmercury dominates resulting in biomagnification factors greater than 10 in swordfish, Atlantic bluefin tuna, harbour porpoise, Atlantic white-sided dolphin and common thresher shark. The biomagnification power of the northern Gulf of Maine ecosystem is remarkably similar to that measured in tropical, subtropical, other temperate and arctic oceanic ecozones.
Conflict of interest statement
The authors have declared that no competing interests exist.
Figures


References
-
- Fitzgerald WF, Engstrom DR, Mason RP, Nater EA (1998) The case for atmospheric mercury contamination in remote areas. Environmental Science and Technology 32: 1–7.
-
- AMAP (2011) Arctic Pollution 2011. Arctic monitoring and Assessment Programme (AMAP), Oslo. Vi+38pp. (www.amap.no).
-
- Lucotte M, Mucci A, Hillaire-Marcel C, Pichet P, Grondin A (1995) Anthropogenic mercury enrichment in remote lakes of northern Quebec (Canada). Water Air and Soil Pollution 80: 467–476.
-
- Driscoll CT, Han Y-J, Chen CY, Evers DC, Lambert KF, Holsen TM, et al. (2007) Mercury contamination in forest and freshwater ecosystems in the northeastern United States. Bioscience 57: 17–28.
Publication types
MeSH terms
Substances
LinkOut - more resources
Full Text Sources
Other Literature Sources

