. 2018 Jul 16;19(1):382.
doi: 10.1186/s13063-018-2774-5.

Preventing false discovery of heterogeneous treatment effect subgroups in randomized trials

Affiliations

Preventing false discovery of heterogeneous treatment effect subgroups in randomized trials

Joseph Rigdon et al. Trials. .

Abstract

Background: Heterogeneous treatment effects (HTEs), or systematic differences in treatment effectiveness among participants with different observable features, may be important when applying trial results to clinical practice. Current methods suffer from a potential for false detection of HTEs due to imbalances in covariates between candidate subgroups.

Methods: We introduce a new method, matching plus classification and regression trees (mCART), that yields balance in covariates in identified HTE subgroups. We compared mCART to a classical method (logistic regression [LR] with backwards covariate selection using the Akaike information criterion ) and two machine-learning approaches increasingly applied to HTE detection (random forest [RF] and gradient RF) in simulations with a binary outcome with known HTE subgroups. We considered an N = 200 phase II oncology trial where there were either no HTEs (1A) or two HTE subgroups (1B) and an N = 6000 phase III cardiovascular disease trial where there were either no HTEs (2A) or four HTE subgroups (2B). Additionally, we considered an N = 6000 phase III cardiovascular disease trial where there was no average treatment effect but there were four HTE subgroups (2C).

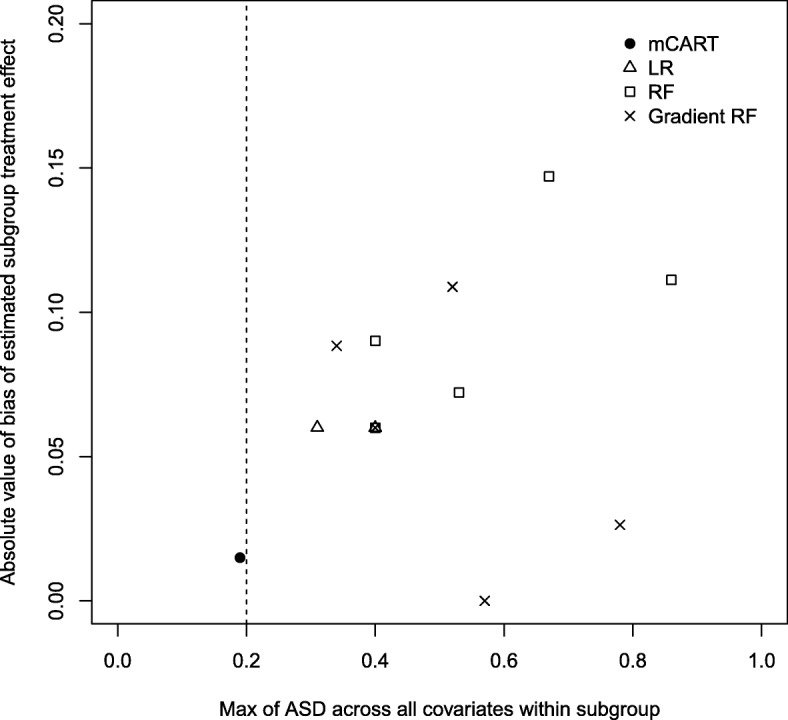
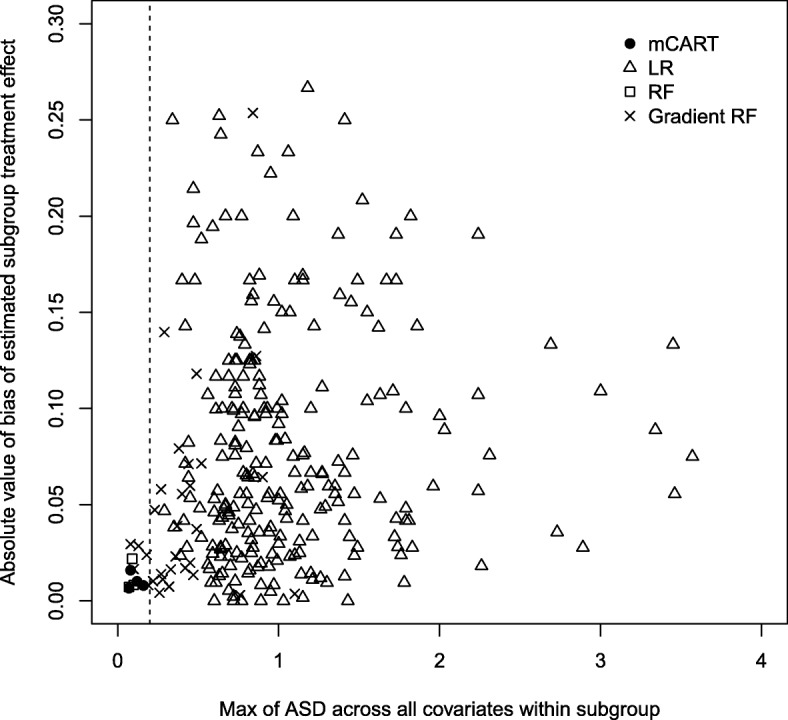
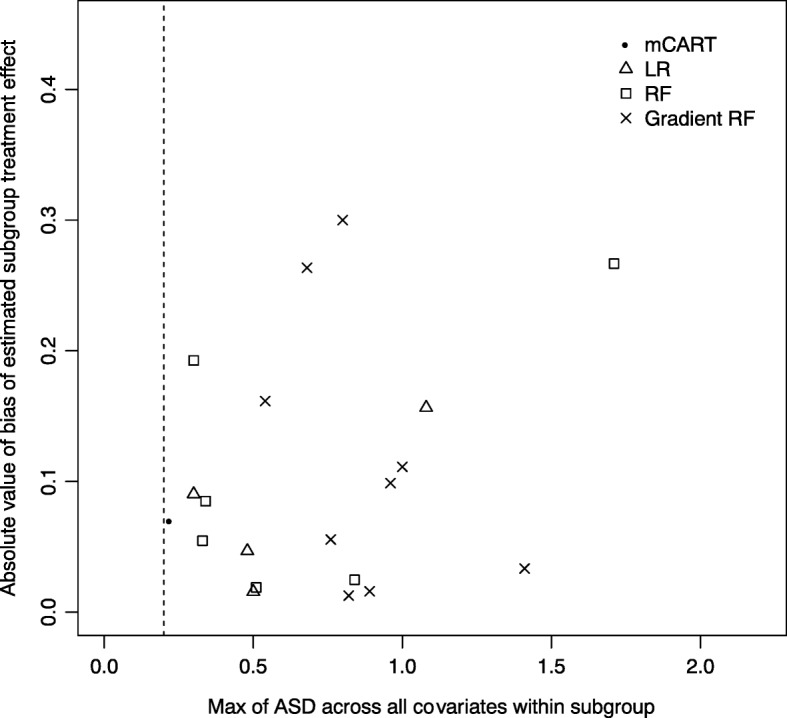
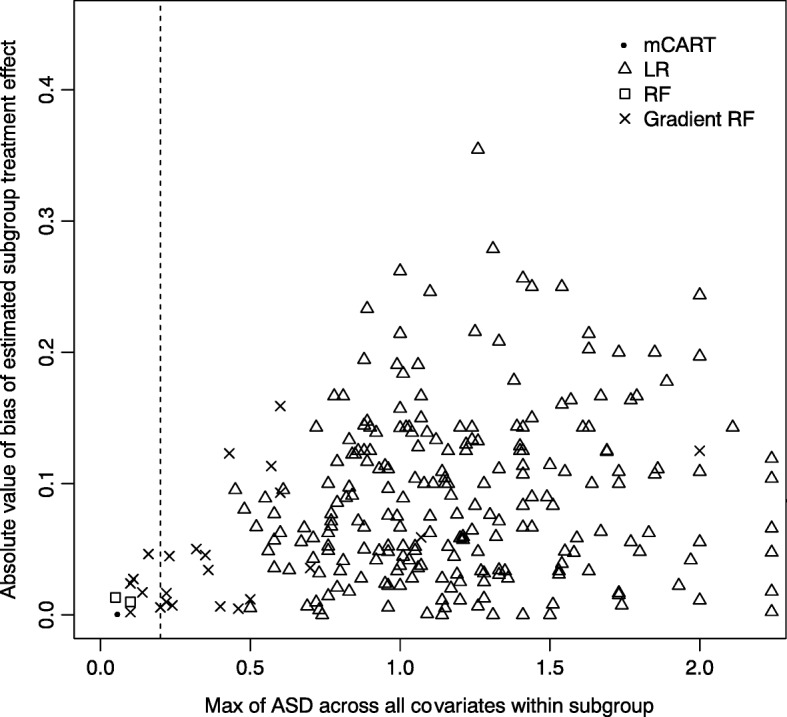
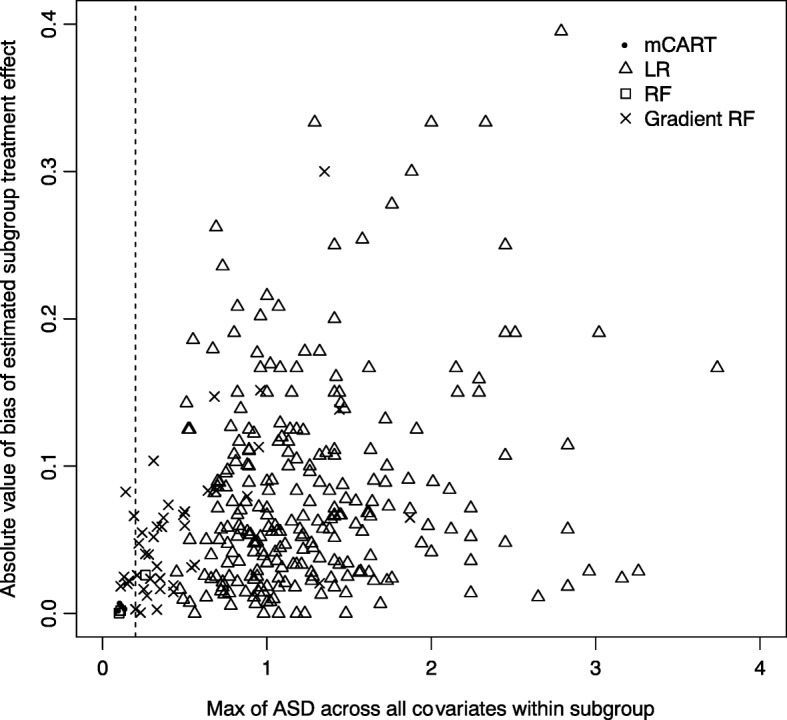
Results: In simulations 1A and 2A (no HTEs), mCART did not identify any HTE subgroups, whereas LR found 2 and 448, RF 5 and 2, and gradient RF 5 and 24, respectively (all false positives). In simulation 1B, mCART failed to identify the two true HTE subgroups whereas LR found 4, RF 6, and gradient RF 10 (half or more of which were false positives). In simulations 2B and 2C, mCART captured the four true HTE subgroups, whereas the other methods found only false positives. All HTE subgroups identified by mCART had acceptable treated vs. control covariate balance with absolute standardized differences less than 0.2, whereas the absolute standardized differences for the other methods typically exceeded 0.2. The imbalance in covariates in identified subgroups for LR, RF, and gradient RF indicates the false HTE detection may have been due to confounding.

Conclusions: Covariate imbalances may be producing false positives in subgroup analyses. mCART could be a useful tool to help prevent the false discovery of HTE subgroups in secondary analyses of randomized trial data.

Keywords: Classification and regression trees; Decision support tool; Heterogeneous treatment effects; Matching.


Conflict of interest statement

Ethics approval and consent to participate

Not applicable.

Consent for publication

Not applicable.

Competing interests

The authors declare that they have no competing interests.

Publisher’s Note

Springer Nature remains neutral with regard to jurisdictional claims in published maps and institutional affiliations.

Figures

Fig. 1
Fig. 1
Plot of maximum absolute standardized difference (ASD) within node for each method (x-axis) versus absolute bias (absolute value of estimated treatment effect minus true treatment effect) in each identified node for LR, RF, gradient RF, and mCART in simulation 1A. All identified subgroups to the left of the vertical dashed line of 0.2 have an acceptable balance. ASD absolute standardized difference, LR logistic regression, mCART matching plus classification and regression trees, RF random forest
Fig. 2
Fig. 2
mCART results from simulation 2B. eGFR estimated glomerular filtration rate, mCART matching plus classification and regression trees
Fig. 3
Fig. 3
Plot of maximum absolute standardized difference (ASD) within node for each method (x-axis) versus absolute bias (absolute value of estimated treatment effect minus true treatment effect) in each identified node for LR, RF, gradient RF, and mCART in simulation 2B. All identified subgroups falling to the left of the vertical dashed line of 0.2 have an acceptable balance. ASD absolute standardized difference, LR logistic regression, mCART matching plus classification and regression trees, RF random forest
Fig. 4
Fig. 4
Plot of maximum absolute standardized difference (ASD) within node for each method (x-axis) versus absolute bias (absolute value of estimated treatment effect minus true treatment effect) in each identified node for LR, RF, gradient RF, and mCART in simulation 1B. All identified subgroups falling to the left of the vertical dashed line of 0.2 have an acceptable balance. ASD absolute standardized difference, LR logistic regression, mCART matching plus classification and regression trees, RF random forest
Fig. 5
Fig. 5
Plot of maximum absolute standardized difference (ASD) within node for each method (x-axis) versus absolute bias (absolute value of estimated treatment effect minus true treatment effect) in each identified node for LR, RF, gradient RF, and mCART in simulation 2A. All identified subgroups falling to the left of the vertical dashed line of 0.2 have an acceptable balance. ASD absolute standardized difference, LR logistic regression, mCART matching plus classification and regression trees, RF random forest
Fig. 6
Fig. 6
mCART results from simulation 2C. mCART matching plus classification and regression trees
Fig. 7
Fig. 7
Plot of maximum absolute standardized difference (ASD) within node for each method (x-axis) versus absolute bias (absolute value of estimated treatment effect minus true treatment effect) in each identified node for LR, RF, gradient RF, and mCART in simulation 2C. All identified subgroups falling to the left of the vertical dashed line of 0.2 have an acceptable balance. ASD absolute standardized difference, LR logistic regression, mCART matching plus classification and regression trees, RF random forest

References

    1. Ashley EA. The precision medicine initiative: a new National Effort. JAMA. 2015;313:2119–2120. doi: 10.1001/jama.2015.3595. - DOI - PubMed
    1. Basu S, Sussman JB, Rigdon J, Steimle L, Denton BT, Hayward RA. Benefit and harm of intensive blood pressure treatment: derivation and validation of risk models using data from the SPRINT and ACCORD trials. PLoS Med. 2017;14:e1002410. doi: 10.1371/journal.pmed.1002410. - DOI - PMC - PubMed
    1. Baum A, Scarpa J, Bruzelius E, Tamler R, Basu S, Faghmous J. Targeting weight loss interventions to reduce cardiovascular complications of type 2 diabetes: a machine learning-based post-hoc analysis of heterogeneous treatment effects in the look AHEAD trial. Lancet Diabetes Endocrinol. 2017;5:808–815. doi: 10.1016/S2213-8587(17)30176-6. - DOI - PMC - PubMed
    1. Burke JF, Hayward RA, Nelson JP, Kent DM. Using internally developed risk models to assess heterogeneity in treatment effects in clinical trials. Circ Cardiovasc Qual Outcomes. 2014;7:163–169. doi: 10.1161/CIRCOUTCOMES.113.000497. - DOI - PMC - PubMed
    1. Kent DM, Rothwell PM, Ioannidis JP, Altman DG, Hayward RA. Assessing and reporting heterogeneity in treatment effects in clinical trials: a proposal. Trials. 2010;11:85. doi: 10.1186/1745-6215-11-85. - DOI - PMC - PubMed

LinkOut - more resources