. 2018 Jul 31;115(31):7901-7906.
doi: 10.1073/pnas.1804353115. Epub 2018 Jul 16.

US particulate matter air quality improves except in wildfire-prone areas

Affiliations

US particulate matter air quality improves except in wildfire-prone areas

Crystal D McClure et al. Proc Natl Acad Sci U S A. .

Abstract

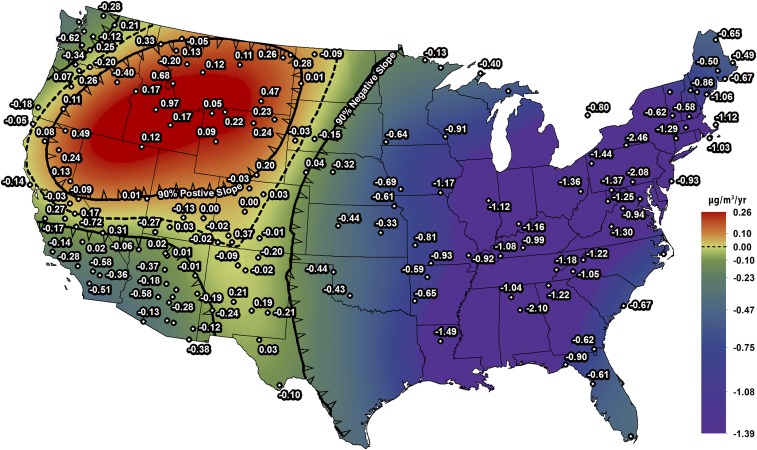
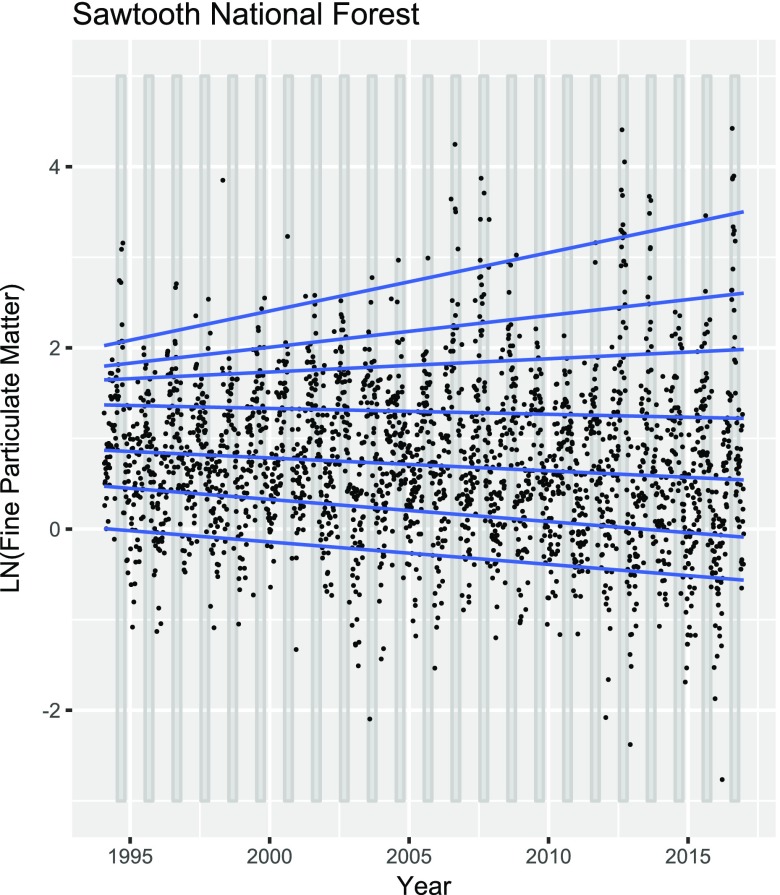
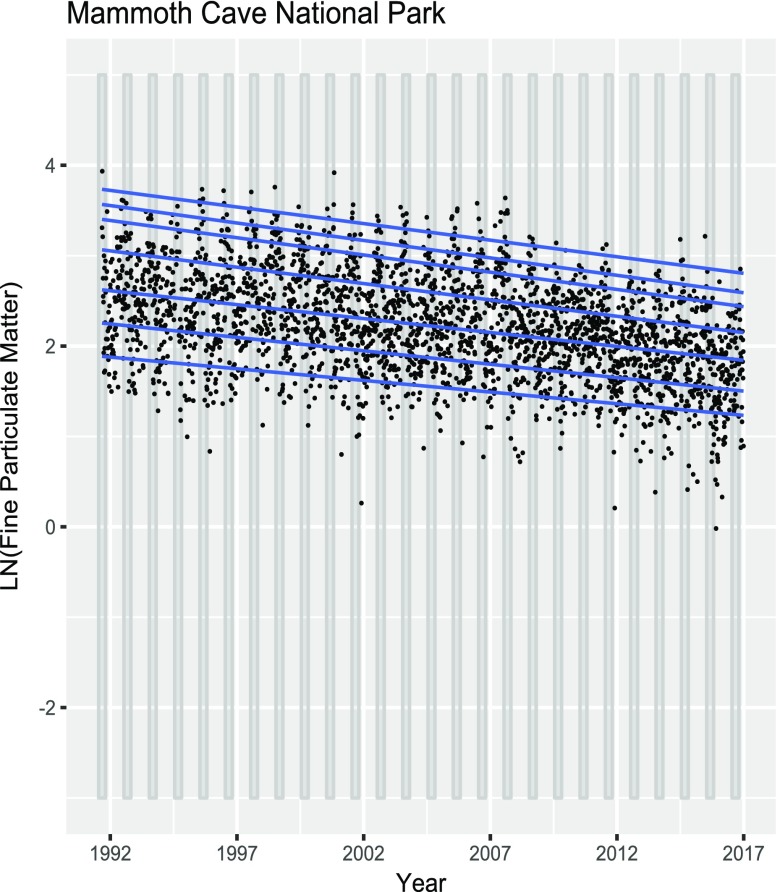
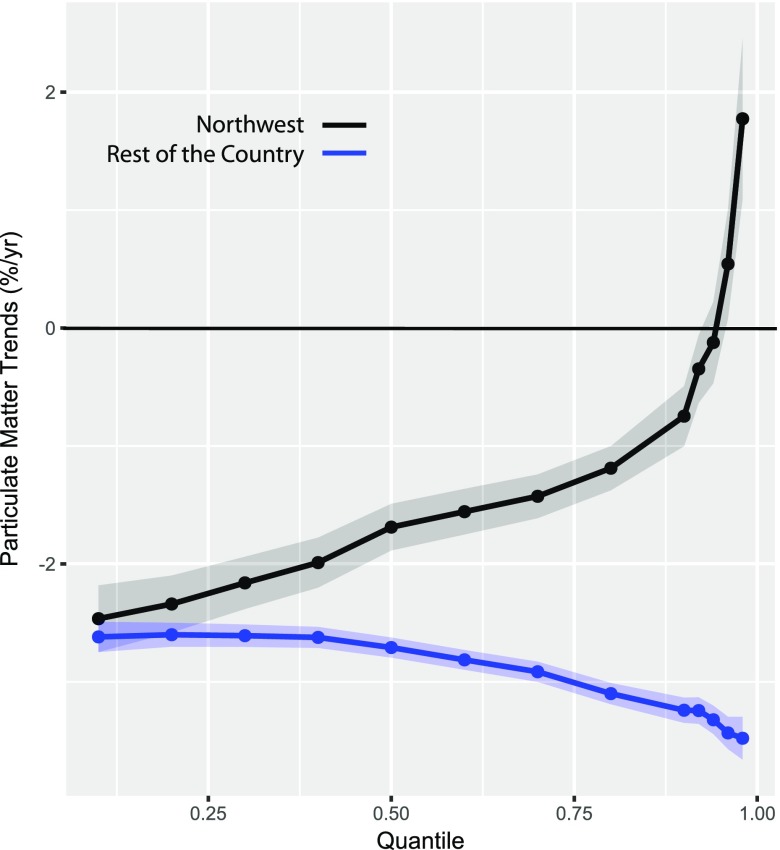
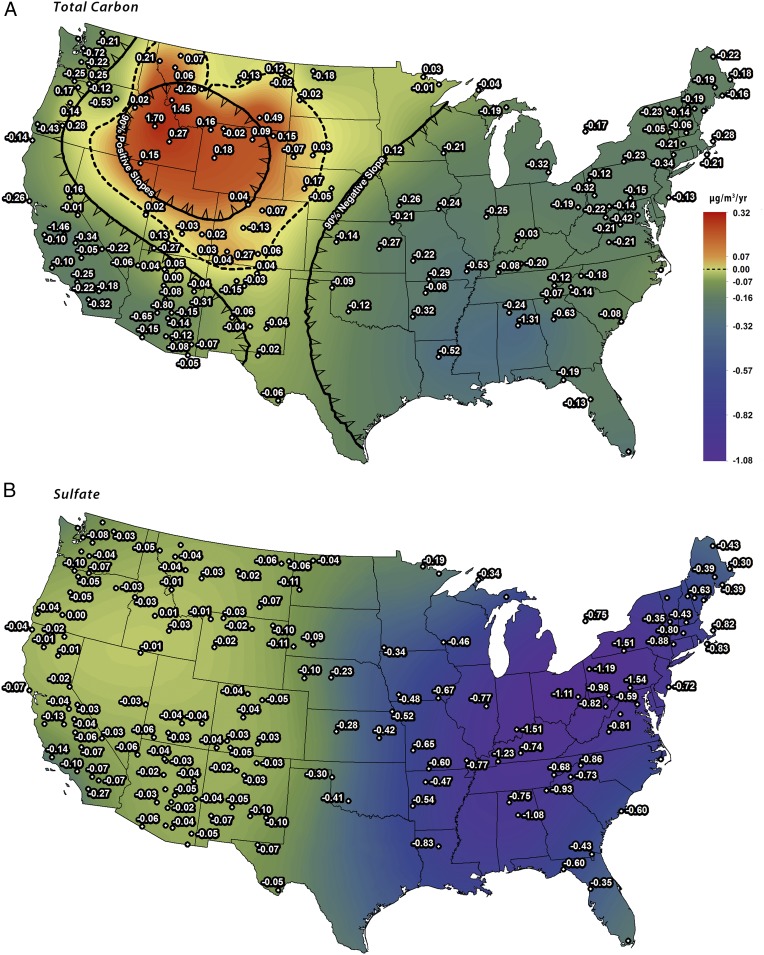
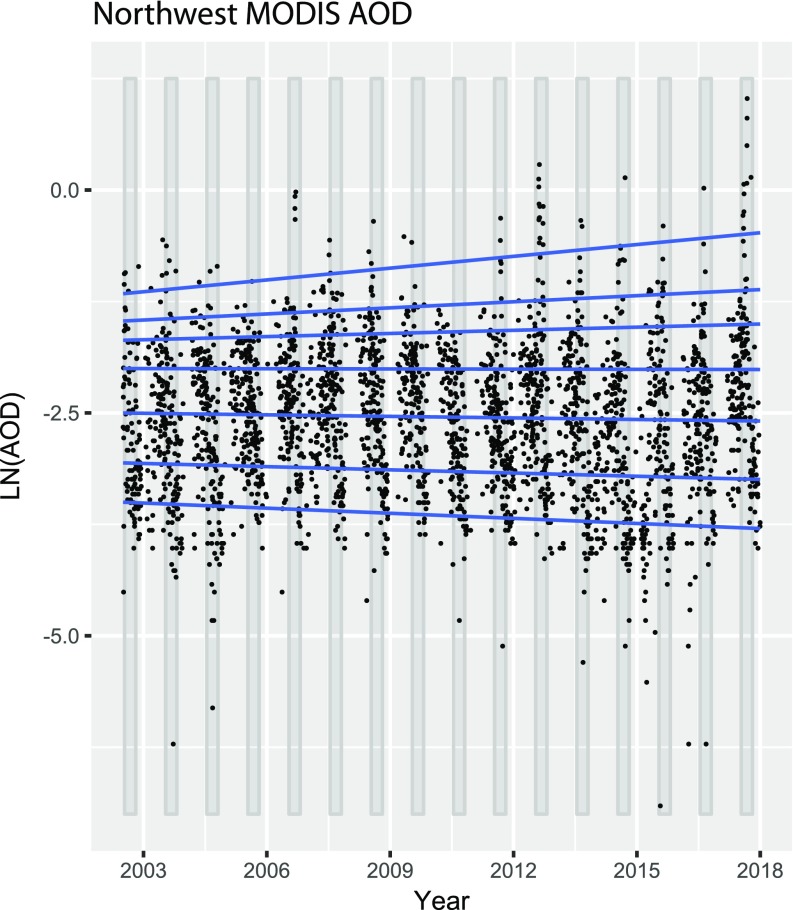
Using data from rural monitoring sites across the contiguous United States, we evaluated fine particulate matter (PM2.5) trends for 1988-2016. We calculate trends in the policy-relevant 98th quantile of PM2.5 using Quantile Regression. We use Kriging and Gaussian Geostatistical Simulations to interpolate trends between observed data points. Overall, we found positive trends in 98th quantile PM2.5 at sites within the Northwest United States (average 0.21 ± 0.12 µg·m-3·y-1; ±95% confidence interval). This was in contrast with sites throughout the rest of country, which showed a negative trend in 98th quantile PM2.5, likely due to reductions in anthropogenic emissions (average -0.66 ± 0.10 µg·m-3·y-1). The positive trend in 98th quantile PM2.5 is due to wildfire activity and was supported by positive trends in total carbon and no trend in sulfate across the Northwest. We also evaluated daily moderate resolution imaging spectroradiometer (MODIS) aerosol optical depth (AOD) for 2002-2017 throughout the United States to compare with ground-based trends. For both Interagency Monitoring of Protected Visual Environments (IMPROVE) PM2.5 and MODIS AOD datasets, we found positive 98th quantile trends in the Northwest (1.77 ± 0.68% and 2.12 ± 0.81% per year, respectively) through 2016. The trend in Northwest AOD is even greater if data for the high-fire year of 2017 are included. These results indicate a decrease in PM2.5 over most of the country but a positive trend in the 98th quantile PM2.5 across the Northwest due to wildfires.

Keywords: Kriging; PM2.5; Quantile Regression; particulate matter; wildfires.


Conflict of interest statement

The authors declare no conflict of interest.

Figures

Fig. 1.
Fig. 1.
The 98th Quantile Regression of PM2.5 trends. Observed PM trends for 1988–2016 (calculated using QR methods) from IMPROVE sites are shown by black dots with corresponding values in µg·m−3·y−1. Krige-interpolated values (calculated from observed data) are shown by the color ramp. Solid black lines with arrows (indicating direction) show the boundary where the Krige-interpolated PM2.5 trends within have a 90% probability of being positive or negative. Of the 157 sites, 92 show statistical significance (8 positive/84 negative).
Fig. 2.
Fig. 2.
Sawtooth National Forest PM2.5 data. Log-transformed PM2.5 data for 1994–2016 are shown by black circles. The gray shading indicates the summer season. Solid blue lines denote quantile regression of PM data at the 10th, 25th, 50th, 75th, 90th, 95th, and 98th quantiles (lowest to highest line).
Fig. 3.
Fig. 3.
Mammoth Cave National Park PM2.5 data. Log-transformed PM2.5 data for 1991–2016 are shown by black circles. The gray shading indicates the summer season. Solid blue lines denote quantile regression of PM data at the 10th, 25th, 50th, 75th, 90th, 95th, and 98th quantiles (lowest to highest line).
Fig. 4.
Fig. 4.
Quantile regression trends. The black and blue dotted lines indicate the trend in PM2.5 across quantiles from 0.10 (10th) to 0.98 (98th) for the Northwest United States (n = 23) and the rest of the country (n = 89), respectively. Shading indicates the 95% CI from the average trend. From 0.10 to 0.90, intervals of 0.10 are chosen, and from quantile 0.90–0.98, intervals of 0.02 are chosen.
Fig. 5.
Fig. 5.
TC and SO4 98th quantile trends. Observed 98th quantile TC (Top) and SO4 (Bottom) trends (calculated using QR methods) from IMPROVE sites for 1988–2016 are shown by black dots with corresponding values in µg·m−3·y−1. Krige-interpolated values (calculated from observed data) are shown by the color ramp. In A, the solid black lines with arrows (indicating direction) show the boundary where 90% of the Krige-interpolated TC trends within are positive or negative. Of the 149 sites, 73 show statistical significance. In B, all regions are within the 90% negative slope estimation. Of the 156 sites, 145 show statistical significance.
Fig. 6.
Fig. 6.
Northwest MODIS AOD site. Log-transformed AOD data for 2002–2017 are shown by black circles. The gray shading indicates the summer season. Solid blue lines denote quantile regression of PM data at the 10th, 25th, 50th, 75th, 90th, 95th, and 98th quantiles (lowest to highest line). This grid box (43.87°N, 114.91°W) is directly over Sawtooth National Forest, ID (Fig. 2).

References

    1. Liu JC, et al. Wildfire-specific fine particulate matter and risk of hospital admissions in urban and rural counties. Epidemiology. 2017;28:77–85. - PMC - PubMed
    1. Haikerwal A, et al. Fine particulate matter (PM2.5 ) exposure during a prolonged wildfire period and emergency department visits for asthma. Respirology. 2016;21:88–94. - PubMed
    1. Wegesser TC, Pinkerton KE, Last JA. California wildfires of 2008: Coarse and fine particulate matter toxicity. Environ Health Perspect. 2009;117:893–897. - PMC - PubMed
    1. US EPA 2016 Particulate matter (PM2.5) trends. US EPA. Available at https://www.epa.gov/air-trends/particulate-matter-pm25-trends. Accessed September 6, 2017.
    1. Westerling AL, Hidalgo HG, Cayan DR, Swetnam TW. Warming and earlier spring increase western U.S. forest wildfire activity. Science. 2006;313:940–943. - PubMed

Publication types