. 2018 Aug 29;38(35):7562-7584.
doi: 10.1523/JNEUROSCI.0893-18.2018. Epub 2018 Jul 16.

Identification of VAPA and VAPB as Kv2 Channel-Interacting Proteins Defining Endoplasmic Reticulum-Plasma Membrane Junctions in Mammalian Brain Neurons

Affiliations

Identification of VAPA and VAPB as Kv2 Channel-Interacting Proteins Defining Endoplasmic Reticulum-Plasma Membrane Junctions in Mammalian Brain Neurons

Michael Kirmiz et al. J Neurosci. .

Abstract

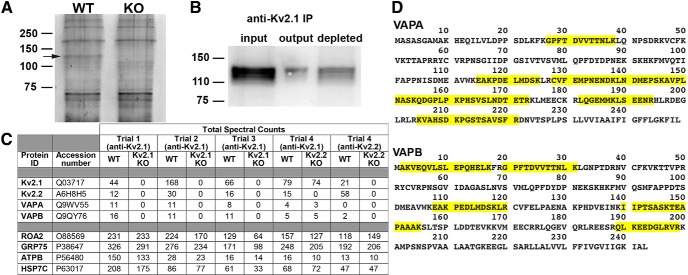
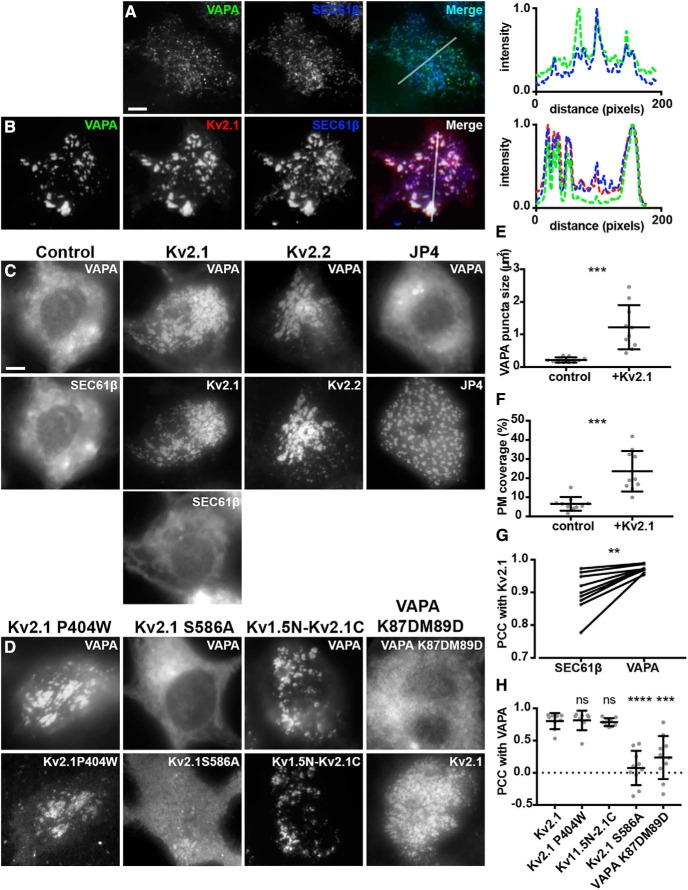
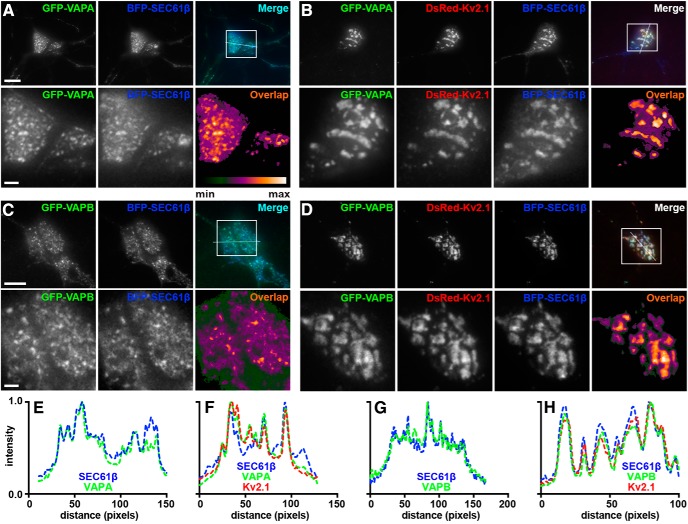
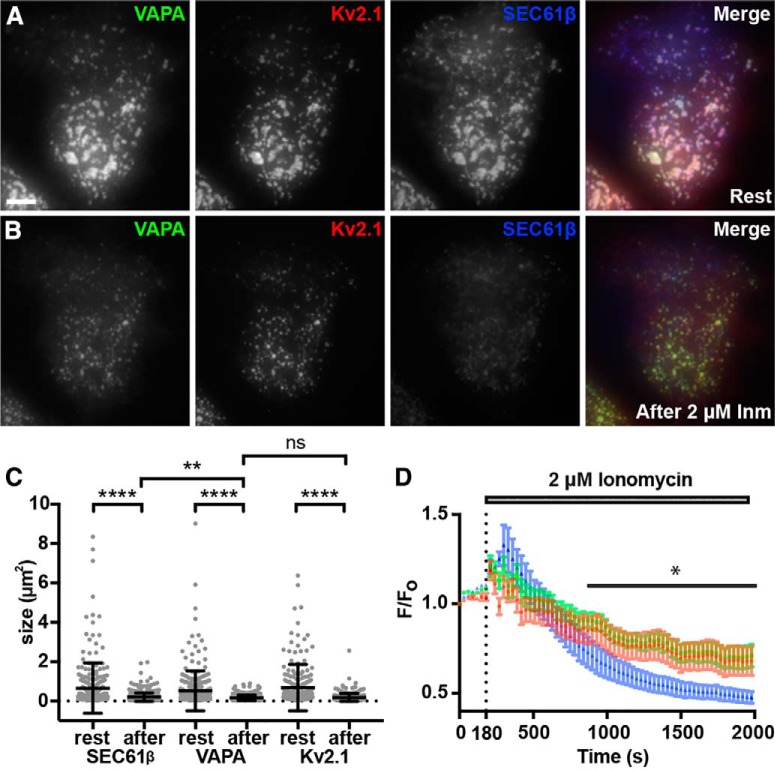
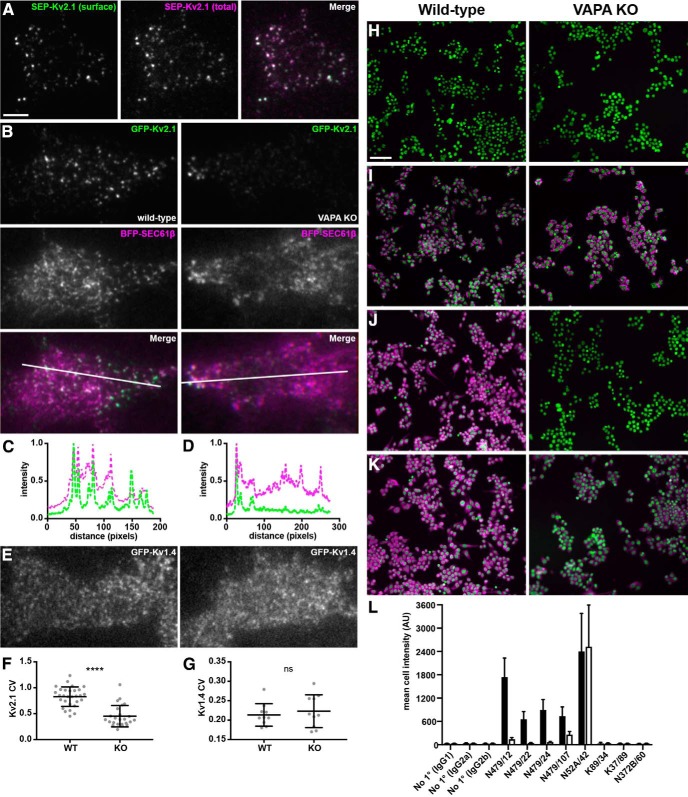
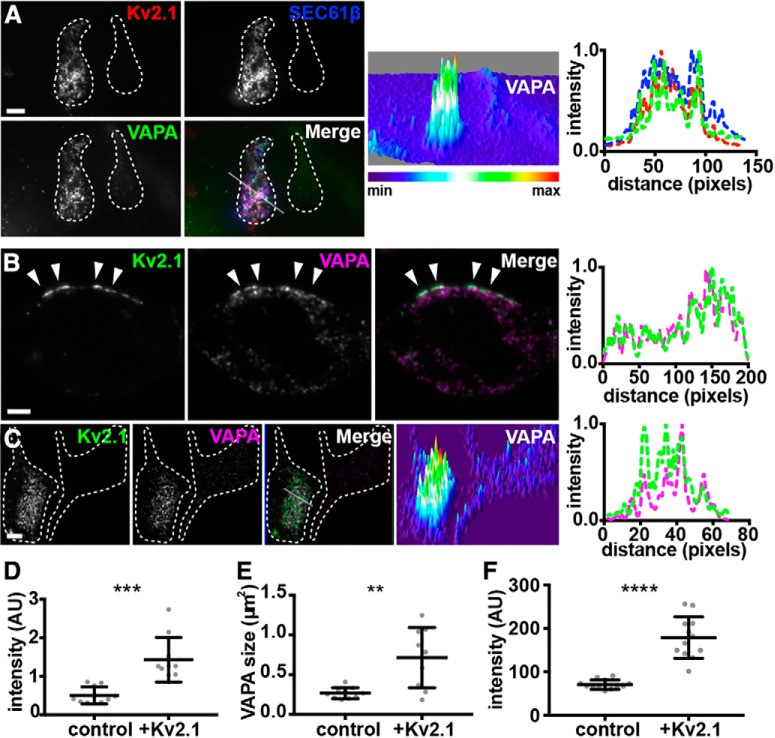
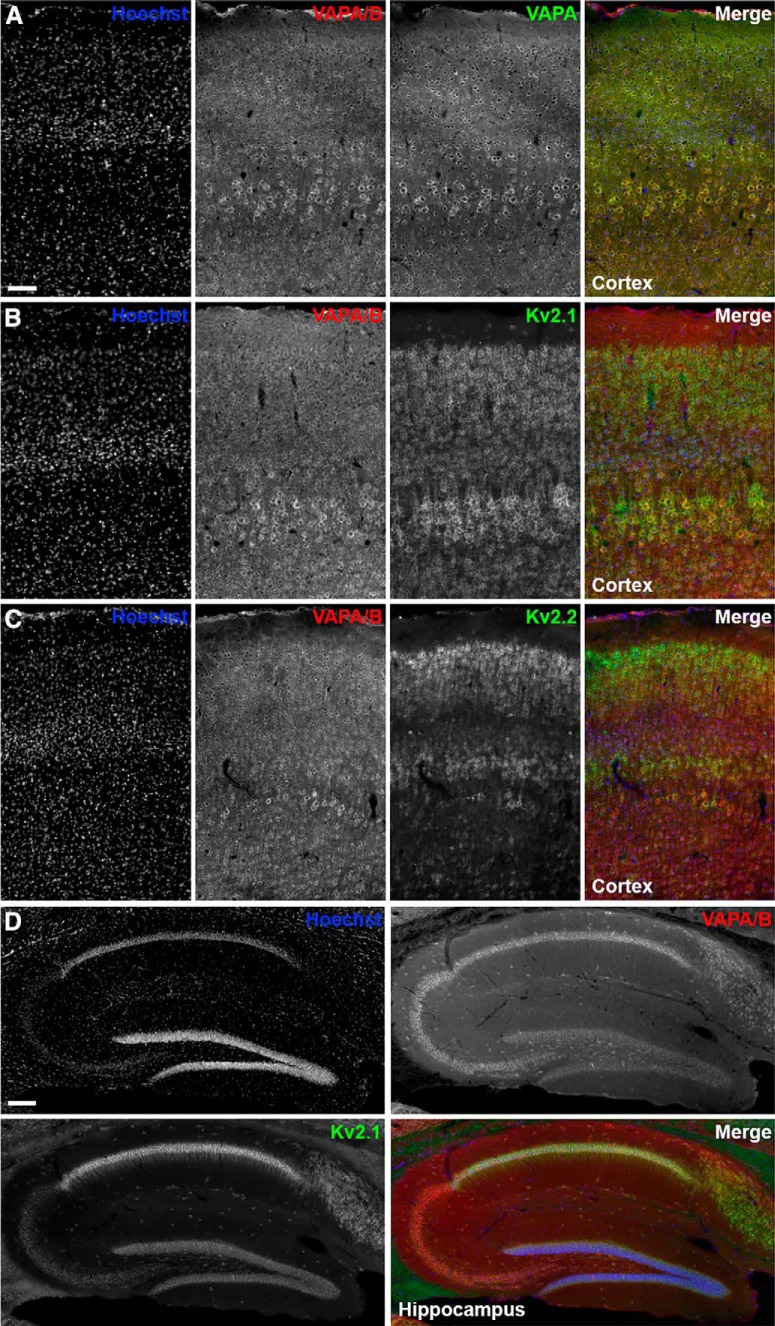
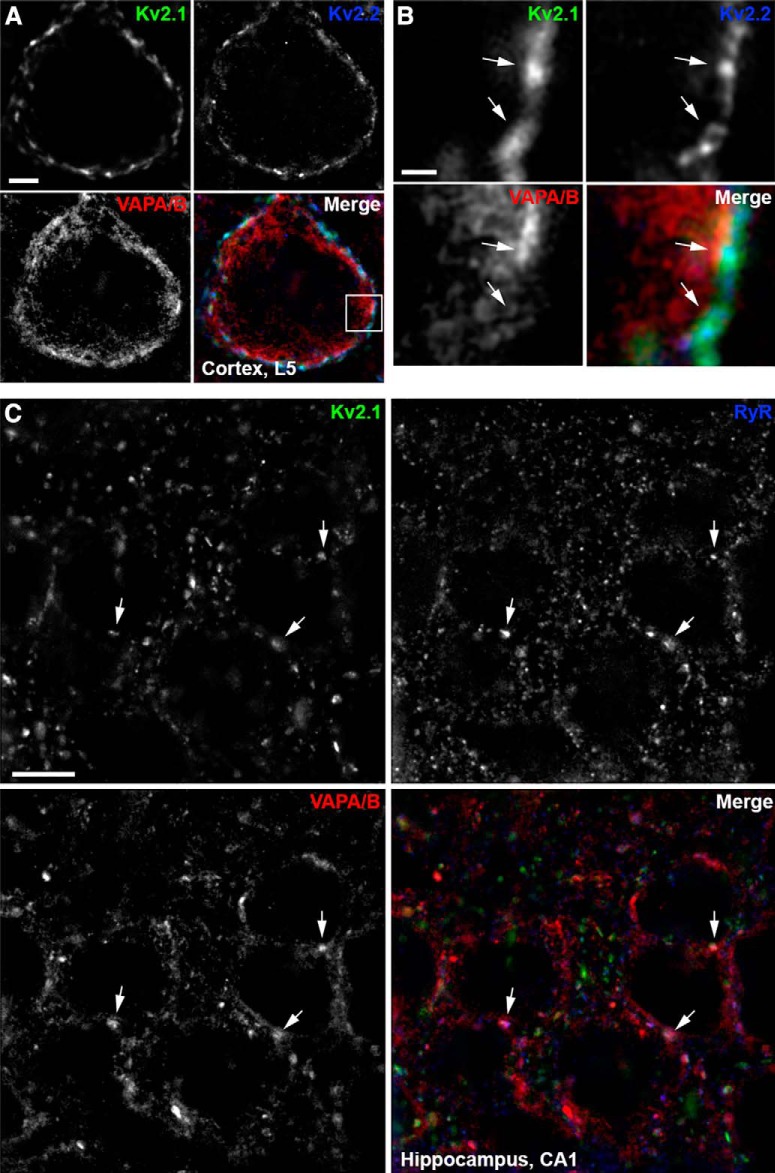
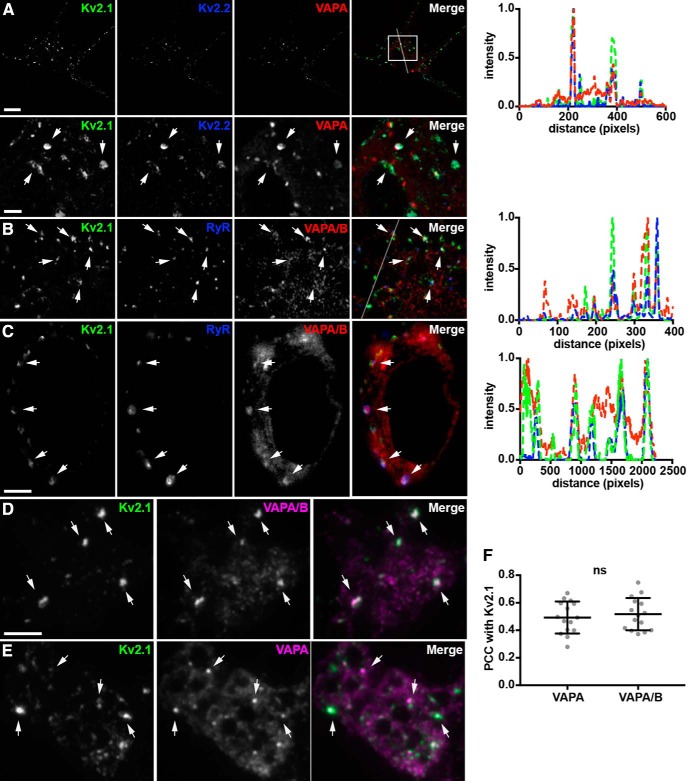
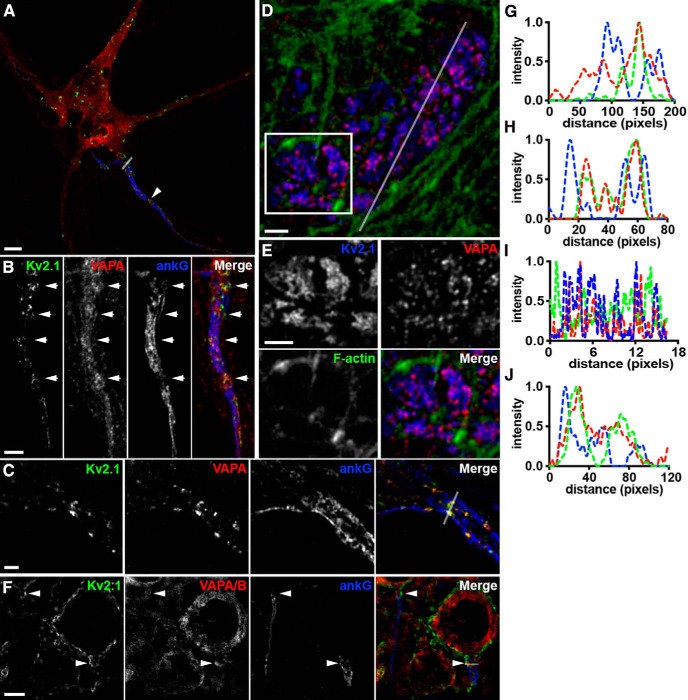
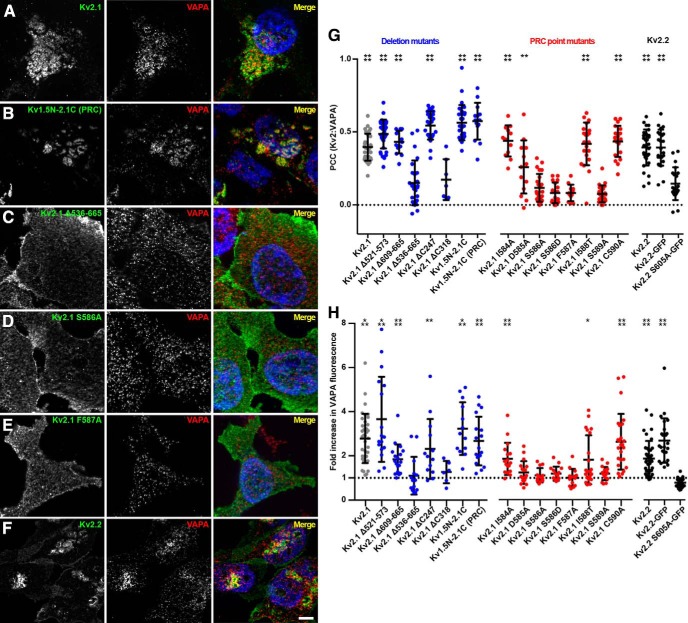
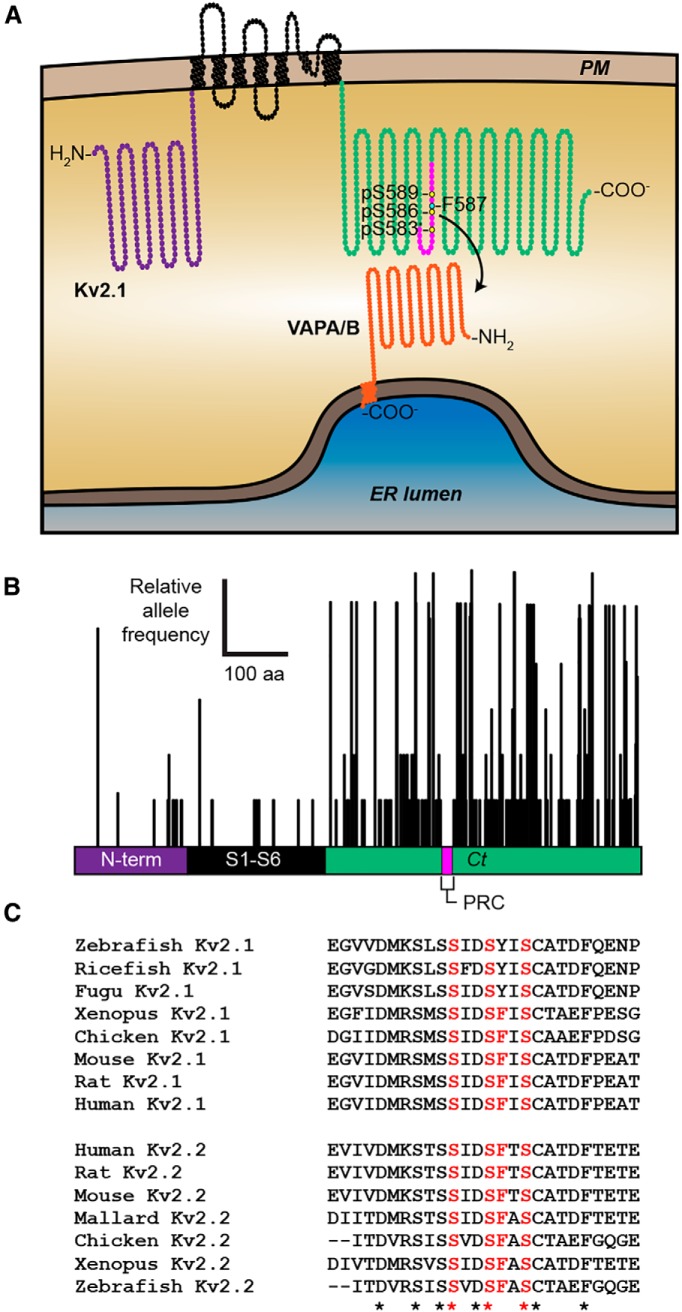
Membrane contacts between endoplasmic reticulum (ER) and plasma membrane (PM), or ER-PM junctions, are ubiquitous in eukaryotic cells and are platforms for lipid and calcium signaling and homeostasis. Recent studies have revealed proteins crucial to the formation and function of ER-PM junctions in non-neuronal cells, but little is known of the ER-PM junctions prominent in aspiny regions of mammalian brain neurons. The Kv2.1 voltage-gated potassium channel is abundantly clustered at ER-PM junctions in brain neurons and is the first PM protein that functions to organize ER-PM junctions. However, the molecular mechanism whereby Kv2.1 localizes to and remodels these junctions is unknown. We used affinity immunopurification and mass spectrometry-based proteomics on brain samples from male and female WT and Kv2.1 KO mice and identified the resident ER vesicle-associated membrane protein-associated proteins isoforms A and B (VAPA and VAPB) as prominent Kv2.1-associated proteins. Coexpression with Kv2.1 or its paralog Kv2.2 was sufficient to recruit VAPs to ER-PM junctions. Multiplex immunolabeling revealed colocalization of Kv2.1 and Kv2.2 with endogenous VAPs at ER-PM junctions in brain neurons from male and female mice in situ and in cultured rat hippocampal neurons, and KO of VAPA in mammalian cells reduces Kv2.1 clustering. The association of VAPA with Kv2.1 relies on a "two phenylalanines in an acidic tract" (FFAT) binding domain on VAPA and a noncanonical phosphorylation-dependent FFAT motif comprising the Kv2-specific clustering or PRC motif. These results suggest that Kv2.1 localizes to and organizes neuronal ER-PM junctions through an interaction with VAPs.SIGNIFICANCE STATEMENT Our study identified the endoplasmic reticulum (ER) proteins vesicle-associated membrane protein-associated proteins isoforms A and B (VAPA and VAPB) as proteins copurifying with the plasma membrane (PM) Kv2.1 ion channel. We found that expression of Kv2.1 recruits VAPs to ER-PM junctions, specialized membrane contact sites crucial to distinct aspects of cell function. We found endogenous VAPs at Kv2.1-mediated ER-PM junctions in brain neurons and other mammalian cells and that knocking out VAPA expression disrupts Kv2.1 clustering. We identified domains of VAPs and Kv2.1 necessary and sufficient for their association at ER-PM junctions. Our study suggests that Kv2.1 expression in the PM can affect ER-PM junctions via its phosphorylation-dependent association to ER-localized VAPA and VAPB.

Keywords: ion channel; membrane contact sites; neuron; subcellular.


Figures

Figure 1.
Figure 1.
VAPA and VAPB associate with Kv2 channels in mouse brain. A, SYPRO Ruby-stained SDS-polyacrylamide gel of protein recovered from IPs using WT and Kv2.1 KO mouse brain. Arrow points to a band that is likely Kv2.1 based on electrophoretic mobility and absence from Kv2.1 KO IP. B, Immunoblot analysis of input, output, and depleted fractions from a single trial of Kv2.1 IPs performed using WT mouse brain. Note the presence of Kv2.1 in the output fraction. C, Total spectral counts from proteins recovered from three separate trials of Kv2.1 IPs from WT and Kv2.1 KO mouse brain, from a Kv2.1 IP from a Kv2.2 KO brain sample, and from a Kv2.2 IP. Note the specific presence of VAPA and VAPB in the Kv2.1 IP samples from WT but not in Kv2.1 KO brain. D, Sequence coverage of VAPA and VAPB from the Kv2.1 IPs.
Figure 2.
Figure 2.
Kv2 channels colocalize with and redistribute VAPA in coexpressing HEK293T cells. A, Representative images of a single live HEK293T cell coexpressing GFP-VAPA (green) and BFP-SEC61β (blue) and imaged with TIRF. Line scan analysis of selection indicated in merged image shown to the right. Scale bar, 5 μm for A and B. Line scan analysis of selection indicated in merged image shown to the right. B, Representative images of a single live HEK293T cell coexpressing GFP-VAPA (green), DsRed-Kv2.1 (red), and BFP-SEC61β (blue) and imaged with TIRF. Line scan analysis of selection indicated in merged image shown to the right. C, Representative wide-field images of VAPA and SEC61β expression in live HEK293T cells coexpressing BFP-SEC61β and GFP-VAPA alone (control) or coexpressing Kv2.1, Kv2.2, or JP4 as indicated. Note the redistribution of GFP-VAPA, but not BFP-SEC61β, in cell coexpressing Kv2.1 relative to control cell. Note the redistribution of GFP-VAPA in cells coexpressing Kv2.1 or Kv2.2, but not JP4, relative to control cell. Scale bar is 5 μm and holds for panels C and D. D, Representative wide-field images of VAPA expression in live HEK293T cells coexpressing GFP-VAPA and mutant Kv2.1 isoforms as indicated or GFP-VAPA K87D/M89D and WT Kv2.1. Note the redistribution of GFP-VAPA in cells coexpressing Kv2.1 P404W and Kv1.5N-Kv2.1C but not Kv2.1 S586A. Note that coexpression of Kv2.1 with VAPA K87D/M89D does not lead to redistribution of VAPA K87D/M89D to the same extent as WT VAPA. E, Summary graph of VAPA puncta size measured from cells coexpressing GFP-VAPA and DsRed-Kv2.1 (+Kv2.1) or expressing GFP-VAPA alone (***p = 0.0001996, n = 10 cells, two-tailed unpaired t test). F, Summary graph of PM coverage measured from same cells as in E (***p = 0.0001392, n = 10 cells, two-tailed unpaired t test;). G, PCC measurements between Kv2.1 and VAPA or Kv2.1 and BFP-SEC61β from the same cells (**p = 0.003276, n = 9 cells, two-tailed paired t test). H, Summary graph of PCC measurements between VAPA and various Kv2 isoforms as indicated (ns, p = 0.8827, n = 8 cells; ns, p = 0.7205, n = 9 cells; ****p = 0.0000009074, n = 10 cells; ***p = 0.0001768, n = 10 cells; two-tailed unpaired t test vs Kv2.1:VAPA) Note the significant reduction in colocalization in Kv2.1 S586A and VAPA K87D/M89D.
Figure 3.
Figure 3.
VAPA and VAPB colocalize with Kv2.1 at ER-PM junctions in overexpressing cultured hippocampal neurons. A, Representative images of a live CHN coexpressing GFP-VAPA (green) and BFP-SEC61β (blue) and imaged with TIRF. Scale bar indicates 10 μm and also holds for low-magnification panels in B. Magnified view of selection indicated in merged image shown in lower panels. Scale bar is 2.5 μm and also holds for magnified panels of B. Pixel overlap analysis shown in bottom right panel. B, Representative images of a live CHN coexpressing GFP-VAPA (green), DsRed-Kv2.1 (red), and BFP-SEC61β (blue) and imaged with TIRF. Magnified view of selection indicated in merged image shown in lower panels. Pixel overlap analysis shown in bottom right panel. C, Representative images of a live CHN coexpressing GFP-VAPB (green) and BFP-SEC61β (blue) and imaged with TIRF. Scale bar is 10 μm and also holds for low-magnification panels of D. Magnified view of selection indicated in merged image shown in lower panels. Scale bar is 2.5 μm and also holds for magnified panels of D. Pixel overlap analysis shown in bottom right panel. D, Representative images of a live CHN coexpressing GFP-VAPB (green), DsRed-Kv2.1 (red), and BFP-SEC61β (blue) and imaged with TIRF. Magnified view of selection indicated in merged image shown in lower panels. Pixel overlap analysis is shown in bottom right panel. E, Line scan analysis of selection indicated in merged image of A. F, Line scan analysis of selection indicated in merged image of B. G, Line scan analysis of selection indicated in merged image of C. H, Line scan analysis of selection indicated in merged image of D.
Figure 4.
Figure 4.
Dispersal of Kv2.1 from ER-PM junctions via elevation of intracellular Ca2+ results in a coordinated reduction in ER-PM junction and VAPA puncta size. A, Representative images of a single live HEK293T cell coexpressing GFP-VAPA (green), DsRed-Kv2.1 (red), and BFP-SEC61β (blue), imaged with TIRF, before 2 μm Inm treatment (Rest). Scale bar is 5 μm and holds for all panels. B, Same cell as in A after 30 min incubation in 2 μm Inm. C, Summary graph of the impact of Inm treatment on the sizes of ER-PM junctions (****p = 4 × 10⁻¹⁵), VAPA puncta size (****p = 5.254 × 10⁻¹²), and Kv2.1 cluster size (****p = 2 × 10⁻¹⁴). All comparisons were with two-tailed unpaired t tests of values before versus after Inm treatment from n = 3 cells each. The changes in the sizes of ER-PM junctions and VAP clusters are significantly different (**p = 0.0044). D, Normalized peak fluorescence intensity measurements of GFP-VAPA (green), DsRed-Kv2.1 (red), and BFP-SEC61β (blue) over the course of Inm treatment. Note the significant difference between VAPA and SEC61β intensity following Inm treatment for all time points following 900 s (0.005969 ≤ *p ≤ 0.0333, n = 3 cells, two-tailed paired t test).
Figure 5.
Figure 5.
CRISPR-mediated KO of VAPA expression affects Kv2.1 localization in RAW264.7 cells A. Representative TIRF images of SEP-Kv2.1 expression in a live WT RAW264.7 cell expressing SEP-Kv2.1 (green is cell surface pHluorin fluorescence, magenta is total cellular mCherry fluorescence). Scale bar is 5 μm and holds for all panels in figure. B, Representative TIRF images of GFP-Kv2.1 (green) and BFP-SEC61β (magenta) in live WT (left) or VAPA KO (right) RAW264.7 cells coexpressing GFP-Kv2.1 and BFP-SEC61β. Note the reduction in clustered Kv2.1 expression in the VAPA KO cell. C, Line scan analysis of selection indicated in merged image of WT RAW264.7 cell coexpressing GFP-Kv2.1 and BFP-SEC61β. D, Line scan analysis of selection indicated in merged image of VAPA KO RAW264.7 cell coexpressing GFP-Kv2.1 and BFP-SEC61β. E, Representative TIRF image of live WT (left) or VAPA KO (right) RAW264.7 cells expressing GFP-Kv1.4. F, Summary graph of CV measurements of GFP-Kv2.1 in WT and VAPA KO RAW264.7 cells (****p = 6.648 × 10⁻⁹, n = 29 cells, two-tailed unpaired t test). G, Summary graph of CV measurement of GFP-Kv1.4 in WT and VAPA KO RAW264.7 cells (ns, 0.5603, n = 10 cells, two-tailed unpaired t test). H-K. Images of WT (left) or VAPA KO (right) RAW264.7 cells used for high-content analysis of immunolabeling (magenta) and with Hoechst labeling of nuclei (green). H, No primary (anti-IgG2b secondary antibody). I, Positive control anti-mortalin mAb N52A/42 (IgG1). J, Anti-VAPA mAb N479/22 (IgG2a). K, Anti-VAPA/B mAb N479/107 (IgG2b). Scale bar in H is 65 μm and holds for HK. L, Mean immunolabeling intensity of all samples across 1300–2800 individual cells in each sample. See Materials and Methods for further details of these antibody validation results.
Figure 6.
Figure 6.
Kv2.1 colocalizes with and recruits endogenous VAPs to Kv2.1-mediated ER-PM junctions in HEK293T cells. A, TIRF image of a pair of fixed HEK293T cells, the left of which is coexpressing DsRed-Kv2.1 (red) and BFP-SEC61β (blue), fixed, and immunolabeled for endogenous VAPA (green). Scale bar, 5 μm. Surface plot of VAPA intensity shown in right panel. Note the difference in VAPA intensity in left versus right cell. Line scan analysis of selection indicated in merged image of F is shown to the far right. B, Single optical section (Apotome; Zeiss) taken through the center of a fixed HEK293T cell expressing GFP-Kv2.1 (green) and immunolabeled for endogenous VAPA (magenta). Note the presence of PM Kv2.1 clusters overlaying projections of VAPA toward the cell cortex. Scale bar, 5 μm. Line scan analysis of selection indicated by arrows in merged image of B is shown to the far right. C, Single optical section (Apotome) of a pair of fixed HEK293T cells, the left of which is expressing GFP-Kv2.1 (green) and immunolabeled for endogenous VAPA (magenta). Note the difference in VAPA intensity in left versus right cell. Scale bar, 5 μm. Surface plot of VAPA intensity shown in right panel. Line scan analysis of the merged image in C is shown to the far right. D, Summary graph of VAPA intensity (TIRF) measurements from Kv2.1-expressing versus nontransfected cells (**p = 0.001659, n = 10 cells, two-tailed unpaired t test). E, Summary graph of VAPA puncta size (TIRF) measurements from Kv2.1-expressing versus nontransfected cells (**p = 0.001894, n = 10 cells, two-tailed unpaired t test). F, Summary graph of VAPA intensity (Apotome) measurements from the basal PM of Kv2.1-expressing versus nontransfected cells (**p = 0.001659, n = 10 cells, two-tailed unpaired t test). ***p = 0.000166, ****p = 1.312 × 10⁻⁸.
Figure 7.
Figure 7.
Cellular expression of Kv2 channels and VAPs in mouse brain. A, Representative images of mouse cortex stained with Hoechst (blue) and immunolabeled for VAPA/B (red) and VAPA (green). Scale bar, 75 μm. B, Representative images of mouse cortex stained with Hoechst (blue) and immunolabeled for VAPA/B (red) and Kv2.1 (green). C, Representative images of mouse cortex stained with Hoechst (blue) and immunolabeled for VAPA/B (red) and Kv2.2 (green). D, Representative images of mouse hippocampus stained with Hoechst (blue) and immunolabeled for VAPA/B (red) and Kv2.1 (green). Scale bar, 150 μm.
Figure 8.
Figure 8.
Endogenous Kv2 channels, VAPs, and RyRs colocalize in mouse brain neurons. A, Single optical section taken through the center of the soma of a single mouse brain cortical (layer 5) neuron immunolabeled for Kv2.1 (green), Kv2.2 (blue), and VAPA/B (red), and imaged with superresolution (N-SIM; Nikon) microscopy. Scale bar, 5 μm. B, Magnification of selection indicated in merged image of A. Arrows point to associated Kv2.1, Kv2.2, and VAPA/B immunolabeling. Scale bar, 0.625 μm. C, Single optical section taken through the center of multiple neurons within the CA1 region of mouse brain hippocampus immunolabeled for Kv2.1 (green), RyR (blue), and VAPA/B (red) and imaged with superresolution (N-SIM; Nikon) microscopy. Arrows point to associated Kv2.1, RyR, and VAPA/B immunolabeling. Scale bar, 5 μm.
Figure 9.
Figure 9.
Endogenous VAPs colocalize with Kv2 channels and RyRs at ER-PM junctions in cultured hippocampal neurons. A, Representative image of a single fixed CHN immunolabeled for endogenous Kv2.1 (green), Kv2.2 (blue), and VAPA (red), and imaged with superresolution (Airyscan; Zeiss) microscopy. Scale bar, 5 μm. Magnified view of selection indicated in merged image shown in lower panels with arrows pointing at associated puncta of Kv2 and VAPA immunolabeling. Scale bar, 2.5 μm (also applies to B). Line scan analysis of selection indicated in merged image of A shown to right. B, Representative image of the soma of a single fixed CHN immunolabeled for endogenous Kv2.1 (green), RyR (blue), and VAPA/B (red) and imaged with superresolution (Airyscan) microscopy. Arrows point to associated Kv2.1, RyR, and VAPA/B immunolabeling. Line scan analysis of selection indicated in merged image of B shown to right. C, Single optical section taken through the center of the soma of a fixed CHN immunolabeled for endogenous Kv2.1 (green), RyR (blue), and VAPA/B (red) and imaged with superresolution (N-SIM; Nikon) microscopy. Arrows point to associated puncta of Kv2.1, RyR, and VAPA/B immunolabeling. Scale bar, 5 μm. Line scan analysis of selection indicated with arrows in merged image of C shown to right. D, Representative images of the soma of a single fixed CHN immunolabeled for endogenous Kv2.1 (green) and VAPA/B (magenta) and imaged with TIRF. Arrows point to puncta of associated Kv2.1 and VAPA/B immunolabeling. Scale bar, 10 μm (also holds for E). E, Representative images of the soma of a single fixed CHN immunolabeled for endogenous Kv2.1 (green) and VAPA (magenta) and imaged with TIRF. Arrows point to puncta of associated Kv2.1 and VAPA/B immunolabeling. F, Summary graph of PCC measurements between Kv2.1 and VAPA and Kv2.1 and VAPA/B (ns, p = 0.5719, n = 14 neurons, two-tailed unpaired t test).
Figure 10.
Figure 10.
Endogenous complexes of Kv2.1 and VAPs represent specialized domains within the cortical actin cytoskeleton. A, Representative image of a single fixed CHN immunolabeled for Kv2.1 (green), VAPA (red), and ankG (blue) and imaged with superresolution (Airyscan; Zeiss) microscopy. Arrowhead denotes region of AIS enlarged in B. Scale bar, 5 μm. B, Magnified view of axon initial segment indicated in A. Arrows point to sites of colocalized Kv2.1/VAPA in “voids” in ankG. Scale bar, 3 μm. C, AIS of a distinct fixed CHN immunolabeled for Kv2.1 (green), VAPA (red), and ankG (blue) and imaged with superresolution (N-SIM; Nikon) microscopy. Scale bar, 1.5 μm. D, Representative image of a single fixed HEK293T cell expressing GFP-Kv2.1 (blue) immunolabeled for endogenous VAPA (red) and phalloidin stained for filamentous actin (green). Scale bar, 1.25 μm. E, Magnified view of selection indicated in D. Scale bar, 1.25 μm. F, Representative images of cortical neurons (layer 5) from intact mouse brain sections immunolabeled for Kv2.1 (green), VAPA/B (red), and ankG (blue). Arrows point to sites of associated Kv2.1 and VAPA/B puncta in “voids” in ankG. Scale bar, 5 μm. G, Line scan analysis of intensity of selection indicated in A. H, Line scan analysis of intensity of selection indicated in merged image of C. I, Line scan analysis of intensity of selection indicated in D. J, Line scan analysis of intensity of merged image of F.
Figure 11.
Figure 11.
The Kv2 channel PRC domain is both necessary and sufficient for VAPA recruitment to Kv2-mediated ER-PM junctions. AF, Representative optical sections (ApoTome; Zeiss) taken through the basal PM of fixed HEK293T cells expressing the indicated WT, mutant and chimeric Kv2.1 and Kv2.2 isoforms and immunolabeled for the Kv2.1 and Kv2.2 isoforms (green) and endogenous VAPA (red). The merged panels also show Hoechst nuclear staining (blue). Scale bar, 5 μm. G, Summary graph of PCC measurements taken between Kv2.1 and Kv2.2 isoforms and VAPA (****p = 0.0001; **p = 0.0021; n = 7–34 cells; one-way ANOVA followed by Dunnett's test vs Kv2.1 S586A for Kv2.1 isoforms, or versus Kv2.2 S605A-GFP for Kv2.2 isoforms). H, Summary graph of the fold increase in normalized fluorescence intensity of VAPA in the basal PM of Kv2.1 and Kv2.2 isoform-expressing cells relative to nontransfected cells. (Kv2.1 WT: ***p = 0.00017; Kv2.1 Δ521–573: ***p = 0.00046; Kv2.1 Δ609–665: ***p = 4.49 × 10⁻⁶; Kv2.1 ΔC247: **p = 0.0053; Kv1.5N-2.1C: ***p = 0.00013; Kv1.5N-2.1C (PRC): ****p = 1.12 × 10⁻⁷; Kv2.1 I584A: ****p = 1.74 × 10⁻⁶; Kv2.1 I588: *p = 0.024; Kv2.1 C590A: ****p = 1.09 × 10⁻⁵; Kv2.2: ****p = 2.88 × 10⁻⁵; Kv2.2-GFP, ****p = 1.59 × 10⁻⁸; n = 6–38 cells; two-tailed unpaired t test versus nontransfected cells).
Figure 12.
Figure 12.
The putative noncanonical FFAT motif in the Kv2 channel PRC domain is highly conserved. A, Illustration depicting the proposed phosphorylation-dependent interaction of the Kv2.1 PRC domain with VAPA/B, enabling recruitment of VAPs to Kv2 clusters and ER-PM junction formation (*necessity of S583 for Kv2.1 clustering has previously been described but was not explicitly tested for a role in recruiting VAPA/B in the present study; see text for details). B, Plot of nonsynonymous genic variation in the coding region of the human KCNB1 gene derived from genome and whole exome sequences from >61,000 individuals in the Broad Institute ExAC database. Note the lack of variation in the core S1-S6 and PRC domains of Kv2.1. C, Protein sequence alignments of the putative FFAT motif in vertebrate Kv2.1 and Kv2.2 channel PRC domains. Residues highlighted in red correspond to the critical S583, S586, F587, and S589 residues of rat Kv2.1, and the corresponding S602, S605, F609, and S611 of rat Kv2.2.

References

    1. Adair B, Nunn R, Lewis S, Dukes I, Philipson L, Yeager M (2008) Single particle image reconstruction of the human recombinant Kv2.1 channel. Biophys J 94:2106–2114. 10.1529/biophysj.107.118562 - DOI - PMC - PubMed
    1. Antonucci DE, Lim ST, Vassanelli S, Trimmer JS (2001) Dynamic localization and clustering of dendritic Kv2.1 voltage-dependent potassium channels in developing hippocampal neurons. Neuroscience 108:69–81. 10.1016/S0306-4522(01)00476-6 - DOI - PubMed
    1. Baker CA, Elyada YM, Parra A, Bolton MM (2016) Cellular resolution circuit mapping with temporal-focused excitation of soma-targeted channelrhodopsin. Elife 5. pii: e14193. 10.7554/eLife.14193 - DOI - PMC - PubMed
    1. Bekele-Arcuri Z, Matos MF, Manganas L, Strassle BW, Monaghan MM, Rhodes KJ, Trimmer JS (1996) Generation and characterization of subtype-specific monoclonal antibodies to K+ channel alpha- and beta-subunit polypeptides. Neuropharmacology 35:851–865. 10.1016/0028-3908(96)00128-1 - DOI - PubMed
    1. Besprozvannaya M, Dickson E, Li H, Ginburg KS, Bers DM, Auwerx J, Nunnari J (2018) GRAM domain proteins specialize functionally distinct ER-PM contact sites in human cells. Elife 7. pii: e31019. 10.7554/eLife.31019 - DOI - PMC - PubMed

Publication types

MeSH terms