. 2018 Jul 16;9(1):2755.
doi: 10.1038/s41467-018-05044-4.

Multi-omics monitoring of drug response in rheumatoid arthritis in pursuit of molecular remission

Affiliations

Multi-omics monitoring of drug response in rheumatoid arthritis in pursuit of molecular remission

Shinya Tasaki et al. Nat Commun. .

Abstract

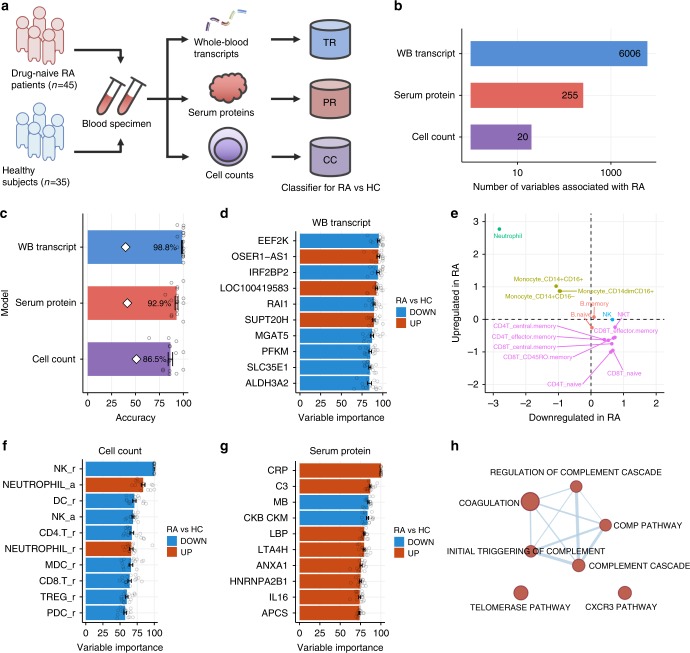
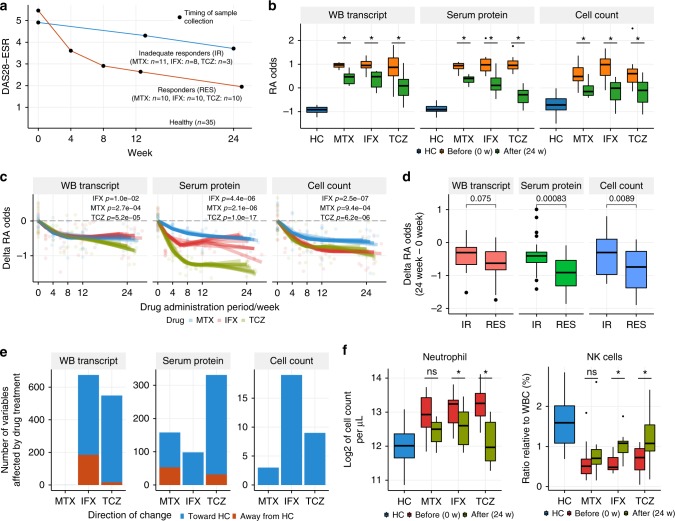
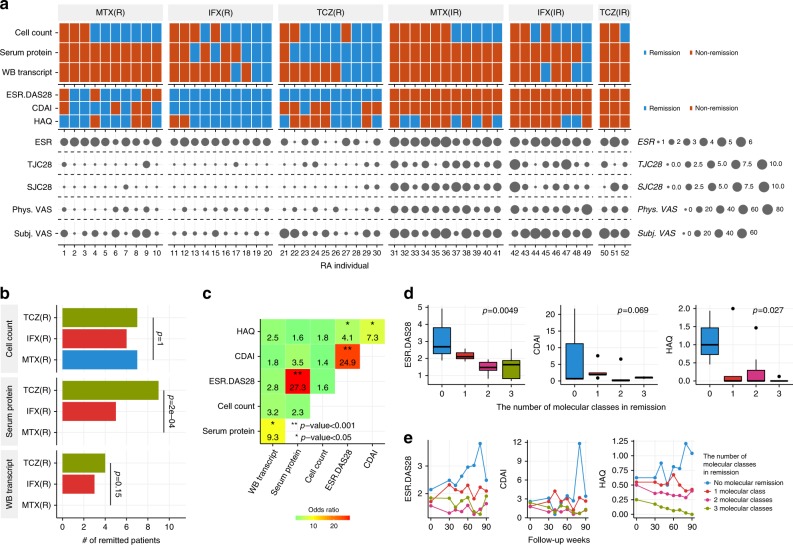
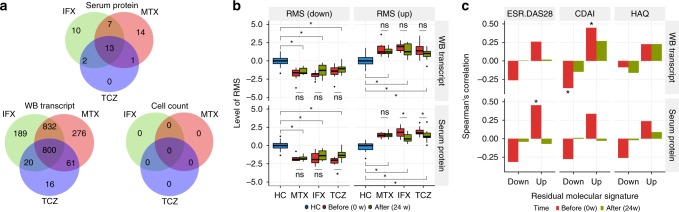
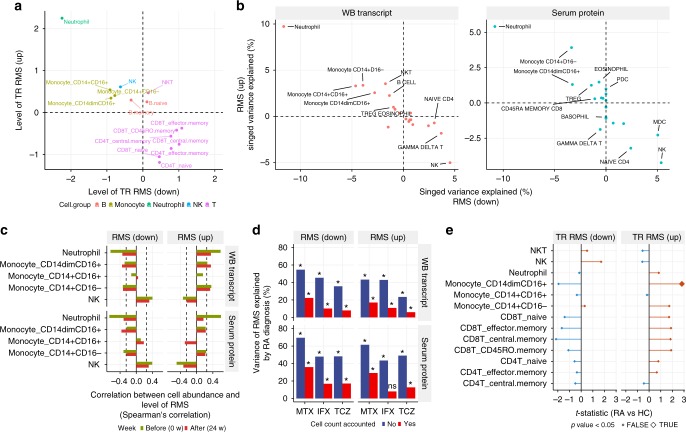
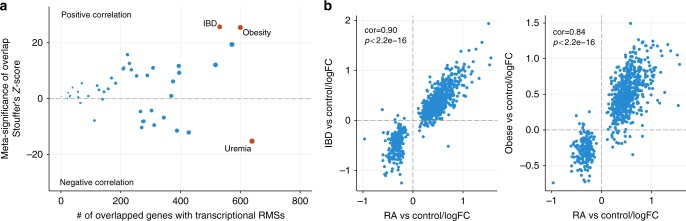
Sustained clinical remission (CR) without drug treatment has not been achieved in patients with rheumatoid arthritis (RA). This implies a substantial difference between CR and the healthy state, but it has yet to be quantified. We report a longitudinal monitoring of the drug response at multi-omics levels in the peripheral blood of patients with RA. Our data reveal that drug treatments alter the molecular profile closer to that of HCs at the transcriptome, serum proteome, and immunophenotype level. Patient follow-up suggests that the molecular profile after drug treatments is associated with long-term stable CR. In addition, we identify molecular signatures that are resistant to drug treatments. These signatures are associated with RA independently of known disease severity indexes and are largely explained by the imbalance of neutrophils, monocytes, and lymphocytes. This high-dimensional phenotyping provides a quantitative measure of molecular remission and illustrates a multi-omics approach to understanding drug response.


Conflict of interest statement

S.T., Y.N., T.M. and H.T. were employed by Takeda Pharmaceutical Company Limited. Yo.K., T.A., Y.O., Mai.T. and R.K. are employed by Takeda Pharmaceutical Company Limited. Y.N. is employed by ONO Pharmaceutical. T.M. is employed by Nektar Therapeutics. H.T. is employed by FRONTEO. K.S. has received research grants from Eisai, Bristol-Myers Squibb, Kissei Pharmaceutical, and Daiichi Sankyo, and speaking fees from Abbie Japan, Astellas Pharma, Bristol-Myers Squibb, Chugai Pharmaceutical, Eisai, Fuji Film Limited, Janssen Pharmaceutical, Kissei Pharmaceutical, Mitsubishi Tanabe Pharmaceutical, Pfizer Japan, Shionogi, Takeda Pharmaceutical, and UCB Japan, consulting fees from Abbie, and Pfizer Japan. A.Y. has received speaking fees from Chugai Pharmaceutical, Mitsubishi Tanabe Pharmaceutical, Pfizer Japan, Ono Pharmaceutical, Maruho, and Novartis, and consulting fees from GSK Japan. Ku.Y. has received consultant fees from Pfizer, Chugai Pharma, Mitsubishi Tanabe Pharma, Abbvie, received honoraria from Pfizer, Chugai Pharma, Mitsubishi Tanabe Pharma, Bristol-Myers Squibb, Takeda Industrial Pharma, GlaxoSmithkline, Nippon Shinyaku, Eli lilly, Janssen Pharma, Eisai Pharma, Astellas Pharma, Actelion Pharmaceuticals and received research grants from Chugai Pharma, Mitsubishi Tanabe Pharma., and Glaxo Smith Kline. H.Y. has received research grants from Daiichi Sankyo, Takeda Pharmaceutical, Eisai, and Japan Blood Products Organization, and speaking fees from Abbie Japan, Bristol-Myers Squibb, Takeda Pharmaceutical, Chugai Pharmaceutical, and Eisai. T.T. has received research grants from Astellas Pharma Inc, Bristol-Myers K.K., Chugai Pharmaceutical Co. Ltd., Daiichi Sankyo Co. Ltd., Takeda Pharmaceutical Co. Ltd., Teijin Pharma Ltd., AbbVie GK, Asahikasei Pharma Corp., Mitsubishi Tanabe Pharma Co., Pfizer Japan Inc., and Taisho Toyama Pharmaceutical Co. Ltd., Eisai Co. Ltd., AYUMI Pharmaceutical Corporation, and Nipponkayaku Co. Ltd, and speaking fees from AbbVie GK., Bristol-Myers K.K., Chugai Pharmaceutical Co. Ltd., Mitsubishi Tanabe Pharma Co., Pfizer Japan Inc., and Astellas Pharma Inc., and Diaichi Sankyo Co. Ltd., and consultant fees from Astra Zeneca K.K., Eli Lilly Japan K.K., Novartis Pharma K.K., Mitsubishi Tanabe Pharma Co., Abbivie GK, Nipponkayaku Co. Ltd, Janssen Pharmaceutical K.K., Astellas Pharma Inc., and Taiho Pharmaceutical Co. Ltd. The remaining authors declare no competing interests.

Figures

Fig. 1
Fig. 1
Identification of molecular signatures associated with drug-naive patients with RA. a Study design. TR, PR, and CC represent the transcript-based model, the protein-based model, and the cell-count-based model, respectively. b The number of variables associated with drug-naive patients with RA. A linear regression model was used to compare the levels of variables between RA and HC accounting for age. For the transcripts, the RNA integrity number was also included in the model. The false discovery rate was controlled at 5%. c Cross-validation performances of RA diagnostic models. PLSR was employed to build predictive models. Fifteen PLSR models for each data type were generated using 15 different portions of samples as training data. The bar plot represents the average prediction accuracies against the testing data with the standard deviation. White diamonds indicate the expected accuracy of the null models estimated by 1000 sample permutations. d The top ten important transcripts for discriminating patients with RA and HC. Error bars represent the variabilities of the contribution to the model prediction that originated from the model ensemble. e Expression profiles of important transcripts across 15 immune cells. Meta-expression features of important upregulated or downregulated transcripts in RA were calculated separately using the ssGSEA method and standardized across immune cells. f The top ten important cell types for discriminating between patients with RA and HC. A suffix of “r” indicates that the cell counts were normalized to the total number of white blood cells, and a suffix of “a” indicates absolute cell counts. g The top ten important serum proteins for discriminating patients with RA and HC. Error bars represent the variabilities of the contribution to the model prediction that originated from the model ensemble. h Biological enrichment of influential serum proteins in the model. Serum proteins with a variable importance greater 50 were used for enrichment analysis using hypergeometric test. The biological concepts enriched at the significance level of p value <0.05 and FDR <0.05 are displayed. Red nodes represent biological concepts enriched with proteins that are upregulated in RA. Nodes are connected if there are shared genes in two biological pathways. The error bars represent standard errors
Fig. 2
Fig. 2
Evaluation of the effects of drug treatments on molecular profiles. a Sample collection design of the drug response cohort. Responders and inadequate responders to the drug treatments were defined based on EULAR response criteria. Patients who displayed a good response via the criteria at 24 weeks after the first drug administration were classified as responders; others were classified as inadequate responders. The average DAS28-ESR and sampling timing for each group are shown. b RA probability changes induced by the treatments. RA probability was transformed to log-odds, and the log-odds at week 0 were compared with those at week 24 using the paired t-test (*p < 0.05) for each treatment arm (n = 10 for each drug). c The temporal change in log-odds for being RA during the treatments. The temporal effects of RA odds (n = 10 for each drug) were modeled with B-spline smoothing, in which an individual was treated as a random effect. d Correlation between the model-based assessments of drug effects and the clinical definition of drug response. The treatment effects on RA odds were compared between responders (n = 30) and inadequate responders (n = 22) by Welch's t-test. e The number of variables affected by drug treatments (24 vs 0 weeks). Treatment effect was tested for each drug (n = 10) via limma by taking into account the paired samples. RIN value was included in the regression model for testing transcripts. The criterion for significance was set at a p value <0.05 and FDR <0.05. f Neutrophil and NK cell counts before and after treatment. The asterisk represents a p value <0.05 and FDR <0.05. The upper, center, and lower line of the boxplot indicates 75%, 50%, and 25% quantile, respectively. The upper and lower whisker of the boxplot indicates 75% quantile +1.5 * interquartile range (IQR) and 25% quantile −1.5 * IQR
Fig. 3
Fig. 3
Relationship between MR and disease severity indexes. a MR profiles along with disease severity indexes at week 24. R and IR indicate drug responders and inadequate responders, respectively. Each column represents MR and disease severity indexes of a single patient with RA. Disease severity indexes include DAS28-ESR, CDAI, HAQ, ESR, tenderness joint counts using 28 joints (TJC28), swollen joint counts using 28 joints (SJC28), physician visual analog scale (Phys. VAS), and subject visual analog scale (Subj. VAS). b Comparison of drug effects on the induction of MR. The proportions of patients who achieved remission were compared across three treatment arms by Fisher’s exact test. c Correlation of remission indexes. The coincidence of remission states based on two different indexes was evaluated by the two-sided Fisher’s exact test. The number and color represent the odds ratio, where remissions occurred simultaneously. d The MR state is associated with disease activities for patients in CR at 90 weeks. A linear model was used to evaluate the correlation between the number of biological levels that achieved remission states and the disease activities after 90 weeks in RA patients who were treated with biologics (n = 20). The upper, center, and lower line of the boxplot indicates 75%, 50%, and 25% quantile, respectively. The upper and lower whisker of the boxplot indicates 75% quantile +1.5 * interquartile range (IQR) and 25% quantile −1.5 * IQR. e The temporal changes in DAS28-ESR, CDAI, and HAQ values during the follow-up period, which was split into 10-week intervals. For each patient, the average of multiple measurements of the DAS28-ESR, CDAI, and HAQ values within the same interval was calculated, and then the mean of these values from different individuals was calculated
Fig. 4
Fig. 4
Identification of residual molecular signatures. a Comparison of residual molecular signatures across treatments. b Meta-features of residual molecular signatures were differentially expressed in RA after drug treatment. Meta-features of residual molecular signatures were quantified by summarizing residual transcripts and proteins via the ssGSEA method. The levels of meta-features between RA and HC or before and after treatment were tested by Welch’s t-test or the paired t-test, respectively. The asterisk represents a p value <0.05. The upper, center, and lower line of the boxplot indicates 75%, 50%, and 25% quantile, respectively. The upper and lower whisker of the boxplot indicates 75% quantile +1.5 * interquartile range (IQR) and 25% quantile −1.5 * IQR. c Remission parameters associated with residual molecular signatures. The levels of meta-features for residual molecular signatures were associated with DAS28-ESR, CDAI, and HAQ-DI before and after treatment (Spearman’s correlation; n = 30; *p < 0.05)
Fig. 5
Fig. 5
Alterations in cell compositions and cellular-level expression explain RMS. a Expression profiles of transcriptional RMSs across 15 immune cells. Meta-expression features for the transcriptional RMS that were upregulated or downregulated in RA were calculated separately using the ssGSEA method and standardized across immune cells. b The contribution of cell abundance to RMSs. Multivariate linear regression with elastic net regularization was used to estimate the variations in RMSs explained by the absolute cell counts using samples from HCs and drug responders (n = 182). c Correlation between RMSs and cell counts of neutrophil, monocytes, and NK cells. d The variance in RMS explained by RA diagnosis. The proportion of variance in RMS explained by RA diagnosis was calculated with or without accounting for the contribution of cell counts to RMS. The contribution of cell counts to RMS was accounted for by a multivariate linear regression. The asterisk represents a p value <0.05. e Comparison of transcriptional RMSs between patients with RA and HCs in purified immune cells. The levels of transcriptional RMSs in each immune cell were quantified using ssGSEA and compared between RA patients and HCs via a linear model for each cell type
Fig. 6
Fig. 6
The presence of the RA-associated RMS in other disease conditions. a The disease-wide landscape of RA RMS. The comparisons of the RA untreatable transcript signature and publicly available disease signatures from whole blood or PBMCs were assessed by Fisher’s exact test in the NextBio database. The p values from multiple studies of the same diseases were combined by Stouffer’s z-score method. The size of the dots is proportional to the number of overlapped genes with the RA-associated untreatable transcript signatures. The red dot represents diseases with z-scores that were higher than the top 5% of z-scores over all diseases examined. b The changes in expression were similar for the transcriptional RMS between RA and the most associated diseases. The fold changes in the 800 transcriptional RMS between patients and controls were calculated using the raw data from the IBD study (GSE33943; n = 45 for IBD and n = 15 for controls) and the obesity study (GSE18897; n = 29 for obese and n = 20 for controls). The fold changes from each study were then compared with those determined for our RA cohort (n = 45 for RA and n = 35 for HCs)

References

    1. McInnes IB, Schett G. The pathogenesis of rheumatoid arthritis. N. Engl. J. Med. 2011;365:2205–2219. doi: 10.1056/NEJMra1004965. - DOI - PubMed
    1. Smolen, J. S. et al. EULAR recommendations for the management of rheumatoid arthritis with synthetic and biological disease-modifying antirheumatic drugs: 2016 update. Ann. Rheum. Dis. 76, 960–977 (2017). - PubMed
    1. Lipsky PE, et al. Infliximab and methotrexate in the treatment of rheumatoid arthritis. Anti-Tumor Necrosis Factor Trial in Rheumatoid Arthritis with Concomitant Therapy Study Group. N. Engl. J. Med. 2000;343:1594–1602. doi: 10.1056/NEJM200011303432202. - DOI - PubMed
    1. Smolen JS, Avila JCM, Aletaha D. Tocilizumab inhibits progression of joint damage in rheumatoid arthritis irrespective of its anti-inflammatory effects: disassociation of the link between inflammation and destruction. Ann. Rheum. Dis. 2012;71:687–693. doi: 10.1136/annrheumdis-2011-200395. - DOI - PMC - PubMed
    1. Taylor PC, Moore A, Vasilescu R, Alvir J, Tarallo M. A structured literature review of the burden of illness and unmet needs in patients with rheumatoid arthritis: a current perspective. Rheumatol. Int. 2016;36:685–695. doi: 10.1007/s00296-015-3415-x. - DOI - PMC - PubMed

MeSH terms