. 2018 Jul 16;9(1):2750.
doi: 10.1038/s41467-018-05281-7.

Gene expression drives the evolution of dominance

Affiliations

Gene expression drives the evolution of dominance

Christian D Huber et al. Nat Commun. .

Abstract

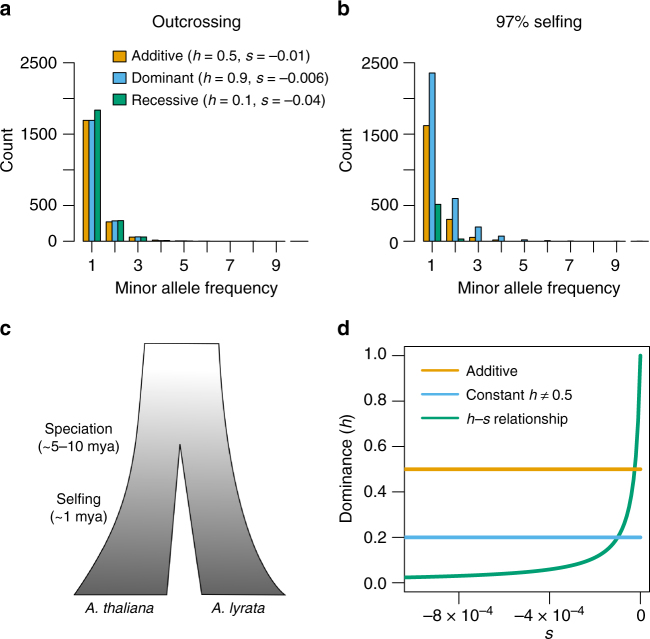
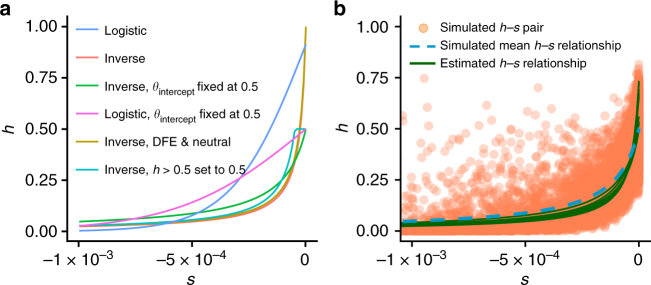
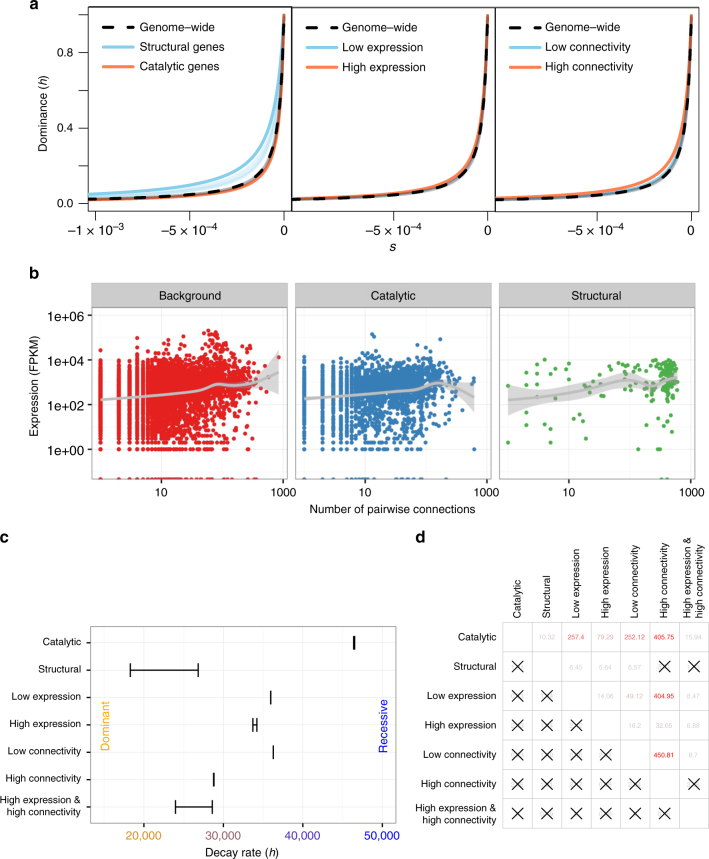
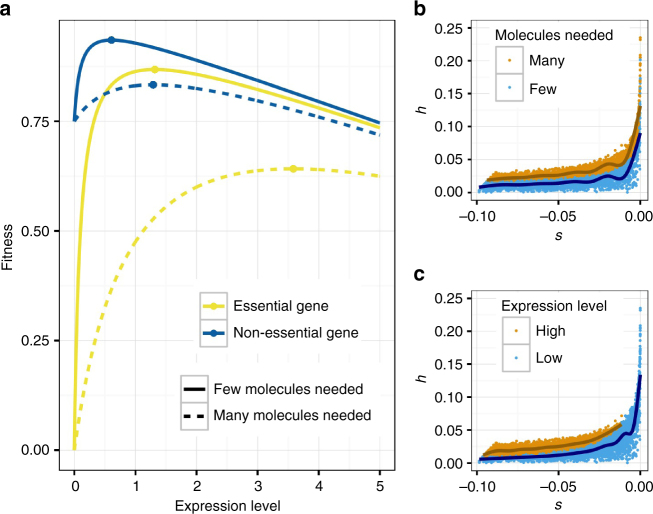
Dominance is a fundamental concept in molecular genetics and has implications for understanding patterns of genetic variation, evolution, and complex traits. However, despite its importance, the degree of dominance in natural populations is poorly quantified. Here, we leverage multiple mating systems in natural populations of Arabidopsis to co-estimate the distribution of fitness effects and dominance coefficients of new amino acid changing mutations. We find that more deleterious mutations are more likely to be recessive than less deleterious mutations. Further, this pattern holds across gene categories, but varies with the connectivity and expression patterns of genes. Our work argues that dominance arises as a consequence of the functional importance of genes and their optimal expression levels.


Conflict of interest statement

The authors declare no competing interests.

Figures

Fig. 1
Fig. 1
The effect of dominance and mating system on the site frequency spectrum (SFS). a The SFS from an outcrossing species simulated under different DFEs and h values. Note that different combinations of DFEs and values of h yield similar SFS. b The SFS for the same DFEs and values of h as in a for a highly selfing species. Differences in h result in large differences in the SFS in selfing species, allowing us to reliably co-estimate the DFE and h. c A schematic of the species history between A. thaliana and A. lyrata. d Examples of the relationship between h and s under the three different models of dominance tested here
Fig. 2
Fig. 2
Genome-wide estimates of dominance. a Likelihood ratio test statistics (Λ) and P-values when comparing different models of dominance. The h–s relationship fits the data significantly better than the additive model and significantly better than a model with a single dominance coefficient. b Inferred relationship between h and s based on whole genome data. More nearly neutral mutations tend to be more dominant than strongly deleterious mutations. c, d Simulations demonstrating the performance of our inference procedure. c Likelihood ratio tests comparing a constant h model to an additive model. When data are simulated under an additive model (green), Λ nearly follows a chi-square (1 df) distribution (red line). However, when the data are simulated under a model with h = 0.46 (tan), the distribution of Λ is substantially larger, indicating excellent statistical power. d Likelihood ratio tests comparing the h–s relationship model to an additive model. When data are simulated under an additive model (green), Λ nearly follows a chi-square (2 df) distribution (red line). However, when the data are simulated under the h–s relationship model (blue), the distribution of Λ is substantially larger, indicating excellent statistical power
Fig. 3
Fig. 3
Robustness of the inferred hs relationship. a The inferred hs relationship depends on the assumed functional form of the relationship and on assumptions regarding the DFE. However, all estimated curves converge to strong recessivity for selection coefficients s < −0.0005 (see also Supplementary Table 3). The inverse hs relationship is defined by Eq. (1), the logistic relationship is defined by the formula h=θintercept(1+e-θoffset1+eθrates-θoffset). b Substantial variation in the dominance coefficient h for particular values of s has only a modest effect on the estimation of the hs relationship. The estimated curves (green; 10 replicates) closely follow the simulated mean relationship between h and s (dashed blue line). However, the estimated intercept parameter, defining the dominance of almost-neutral mutations, is upwardly biased. Orange dots denoted individual h and s coefficients for mutations
Fig. 4
Fig. 4
Distribution of dominance per gene category. a h–s relationship inferred for different gene categories. Bootstrap replicates are shown in lighter colors and in gray for the genome-wide estimates. The blue lines in the middle and right panel strongly overlap with the gray lines of the genome-wide estimates. b Expression profiles are correlated with gene connectivity. Note that structural genes have higher connectivity and expression than do other types of genes. Background refers to genes not in catalytic or structural GO categories. c Differences in the decay rate of h (θrate) across gene categories. 95% confidence intervals (CI) are shown. Larger decay rates indicate that for a given value of s, mutations tend to be more recessive. d Z-scores for tests of differences in decay rate (upper triangle) and intercept (lower triangle) between different categories of genes. Color indicates degree of significance (red is more significant). Comparisons not significantly different after Bonferroni correction are denoted by “X”s
Fig. 5
Fig. 5
A new, comprehensive model for the evolution of dominance. a The relationship between fitness and expression level (arbitrary units). A fitness cost for increasing gene expression is assumed (see the main text). b Predicted h–s relationship when many molecules (orange) and few molecules (blue) are needed. c Predicted h–s relationship when the expression level is high (orange) and low (blue). Note that the patterns predicted in b, c mirror those seen empirically in our analysis

References

    1. Henn BM, Botigué LR, Bustamante CD, Clark AG, Gravel S. Estimating the mutation load in human genomes. Nat. Rev. Genet. 2015;16:333–343. doi: 10.1038/nrg3931. - DOI - PMC - PubMed
    1. Simons YB, Sella G. The impact of recent population history on the deleterious mutation load in humans and close evolutionary relatives. Curr. Opin. Genet. Dev. 2016;41:150–158. doi: 10.1016/j.gde.2016.09.006. - DOI - PMC - PubMed
    1. Teshima KM, Przeworski M. Directional positive selection on an allele of arbitrary dominance. Genetics. 2006;172:713–718. doi: 10.1534/genetics.105.044065. - DOI - PMC - PubMed
    1. Sanjak JS, Long AD, Thornton KR. A Model of compound heterozygous, loss-of-function alleles is broadly consistent with observations from complex-disease GWAS datasets. PLoS Genet. 2017;13:e1006573. doi: 10.1371/journal.pgen.1006573. - DOI - PMC - PubMed
    1. Fisher RA. The possible modification of the response of the wild type to recurrent mutations. Am. Nat. 1928;62:115–126. doi: 10.1086/280193. - DOI

Publication types