. 2018 Aug;19(8):859-870.
doi: 10.1038/s41590-018-0161-8. Epub 2018 Jul 16.

Epithelial damage and tissue γδ T cells promote a unique tumor-protective IgE response

Affiliations

Epithelial damage and tissue γδ T cells promote a unique tumor-protective IgE response

Greg Crawford et al. Nat Immunol. 2018 Aug.

Abstract

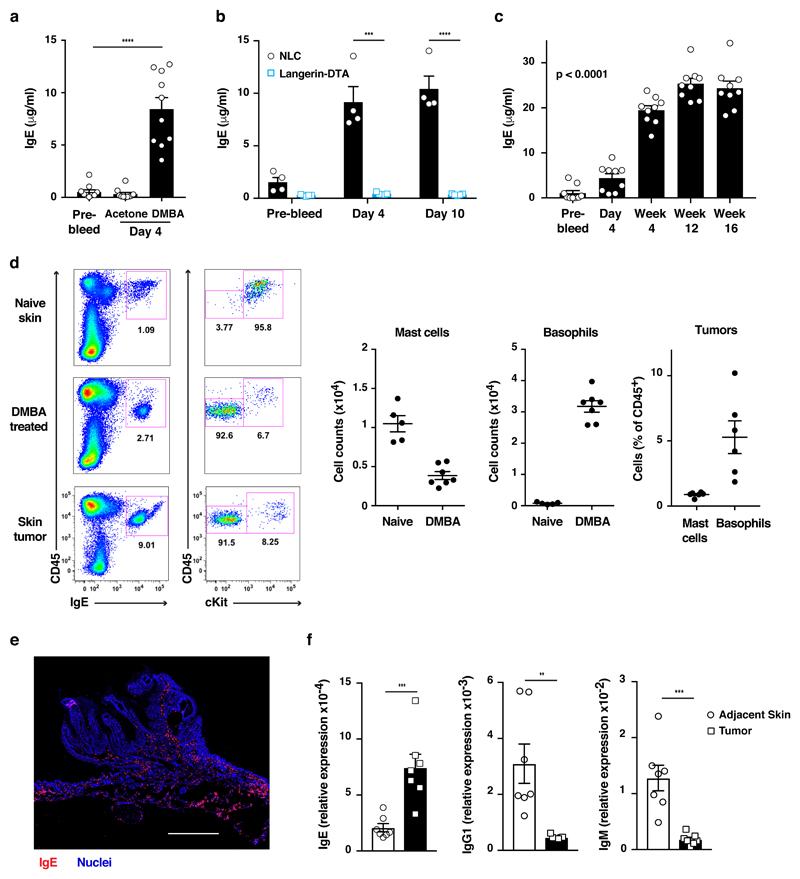
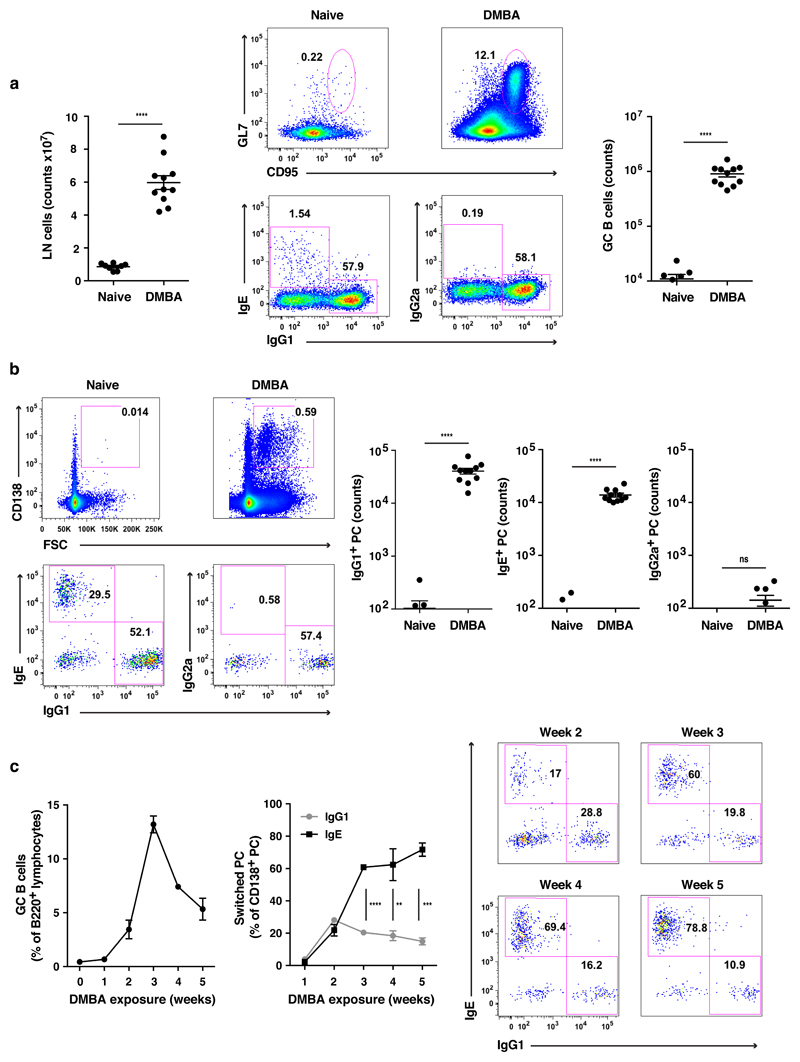
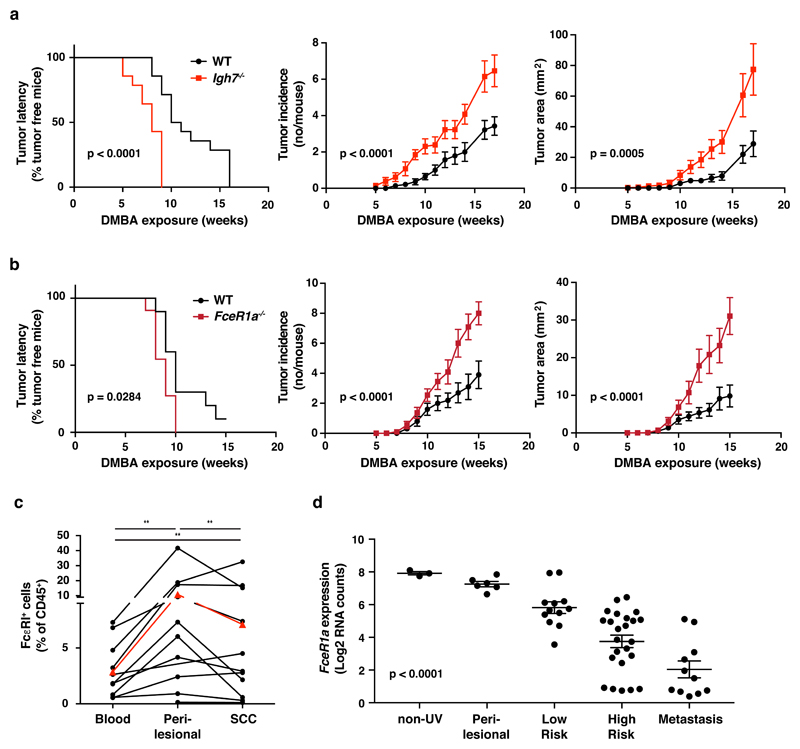
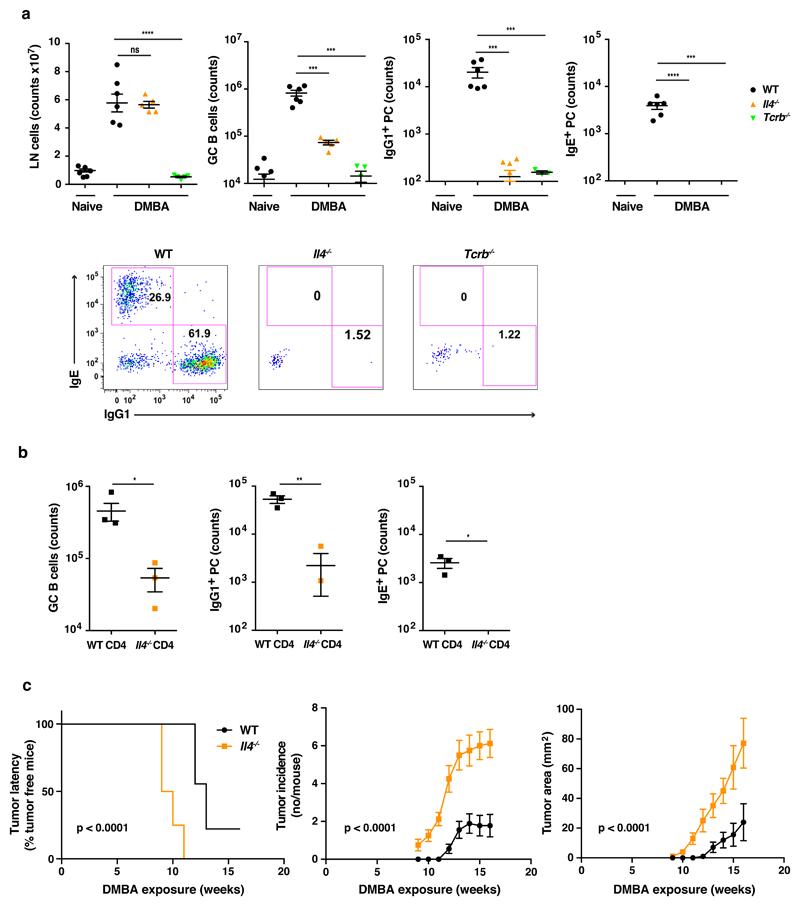
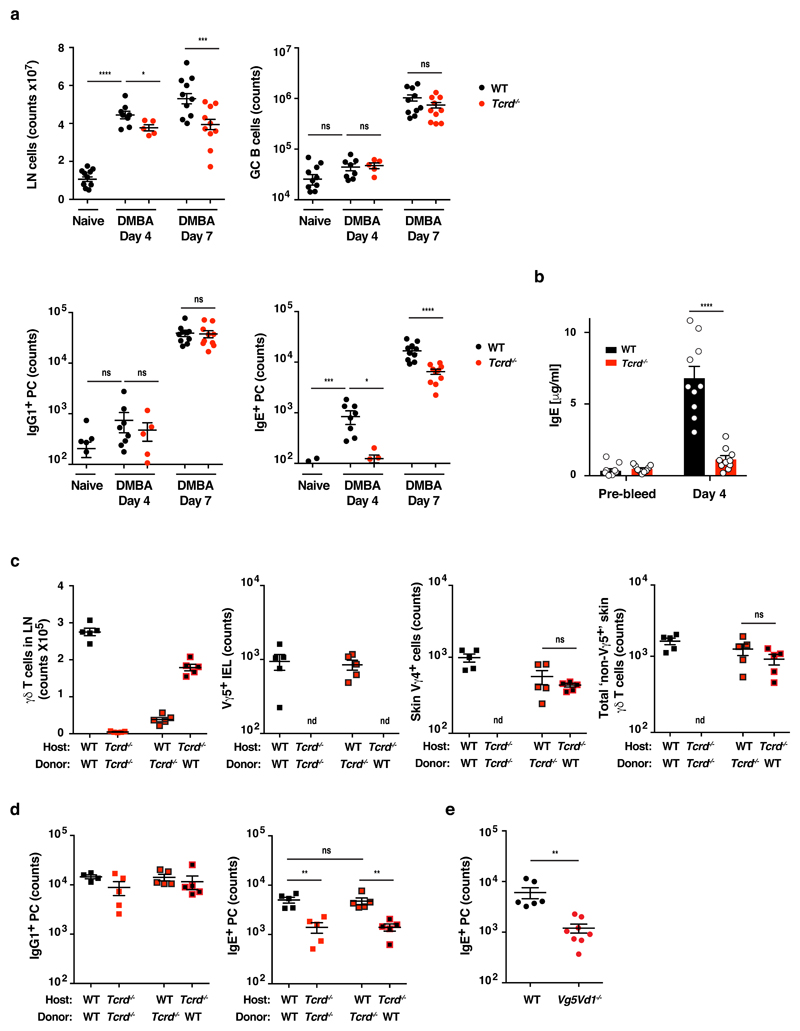
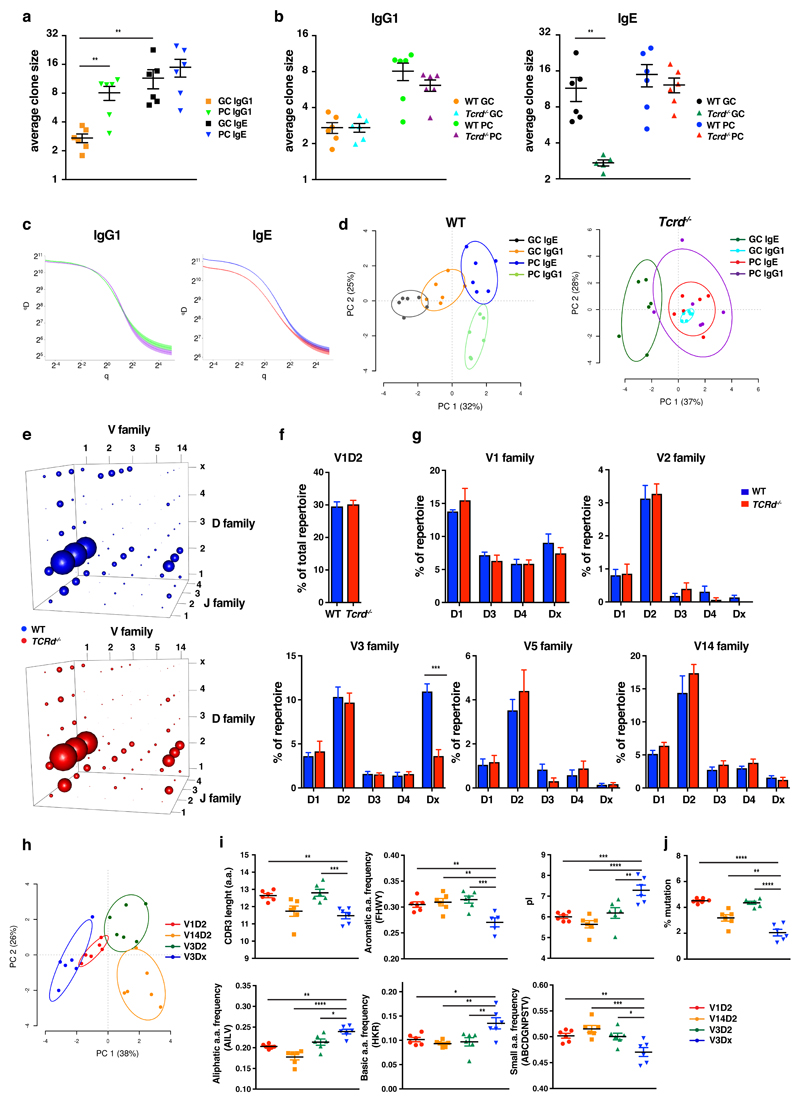
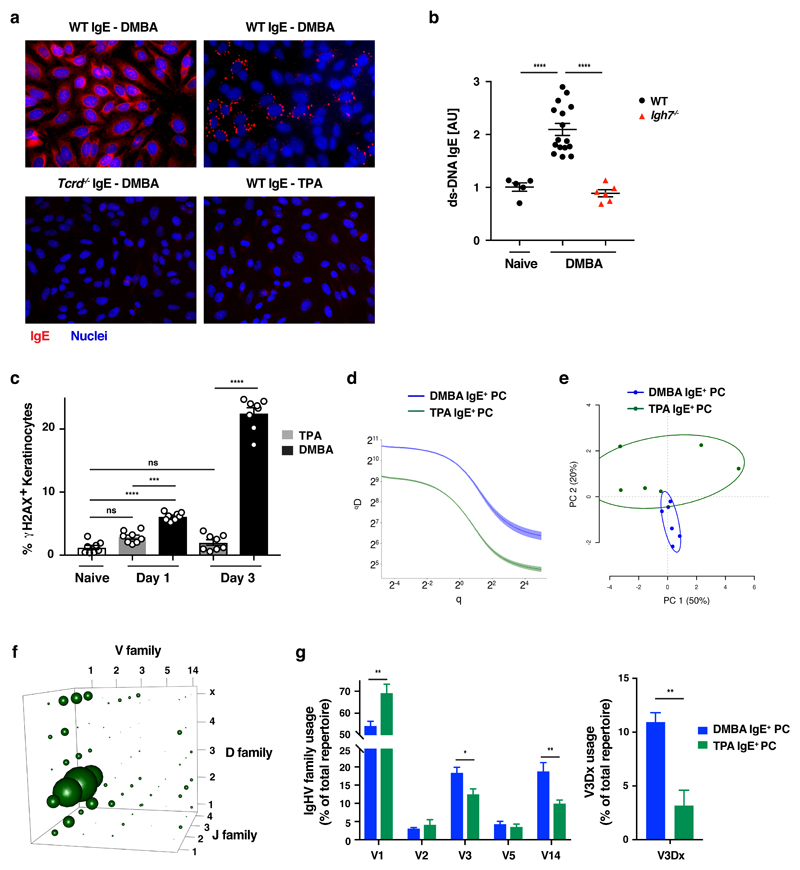
IgE is an ancient and conserved immunoglobulin isotype with potent immunological function. Nevertheless, the regulation of IgE responses remains an enigma, and evidence of a role for IgE in host defense is limited. Here we report that topical exposure to a common environmental DNA-damaging xenobiotic initiated stress surveillance by γδTCR+ intraepithelial lymphocytes that resulted in class switching to IgE in B cells and the accumulation of autoreactive IgE. High-throughput antibody sequencing revealed that γδ T cells shaped the IgE repertoire by supporting specific variable-diversity-joining (VDJ) rearrangements with unique characteristics of the complementarity-determining region CDRH3. This endogenous IgE response, via the IgE receptor FcεRI, provided protection against epithelial carcinogenesis, and expression of the gene encoding FcεRI in human squamous-cell carcinoma correlated with good disease prognosis. These data indicate a joint role for immunosurveillance by T cells and by B cells in epithelial tissues and suggest that IgE is part of the host defense against epithelial damage and tumor development.


Conflict of interest statement

Competing financial interest statement

The authors declare no competing financial interests.

Figures

Figure 1
Figure 1. Carcinogen-induced epithelial cell damage triggers a rapid local and systemic IgE response
(a-c) ELISA of IgE in serum of (a) wild-type FVB mice treated with a single topical dose of 200nmol DMBA or vehicle control (acetone) on shaved back skin (n=10), (b) Langerin-DTA mice (n=5) and their non-transgenic littermate controls (NLC) (n=4) exposed to DMBA as in (a), (c) wild-type FVB mice exposed topically to 200nmol DMBA once weekly (n=9/group). Sera were analyzed for IgE at indicated time points and data expressed as mean ± SEM. (d) FACS analysis of IgE-bearing cells in naïve skin, DMBA-treated skin 7 days after exposure and in DMBA-induced skin tumors. Mast cells were defined as CD45hicKit+IgE+ and basophils as CD45locKit-IgE+. Representative flow plots and enumeration shown (n=5 naïve skin, n=7 DMBA skin, n=6 tumors). (e) Representative image of IgE staining (red) in a DMBA-induced tumor. Nuclei in blue. Scale = 1mm. Image is representative of tile-scans from 6 independent tumors. (f) Quantitative RT-PCR analysis of mature immunoglobulin transcripts in tumors or tumor adjacent skin following DMBA carcinogenesis. Data are expressed as mean ± SEM relative to the control gene cyclophylin (n=7/group). Statistics using two-tailed unpaired Student’s t-test (a and f), multiple t-tests (b) or one-way ANOVA testing for linear trend of IgE increase with time (c); **p<0.01, ***p<0.001 and ****p<0.0001. Data are representative of 3 (a,c,f), 2 (b) or 4 (d) independent experiments with similar results.
Figure 2
Figure 2. Topical carcinogen exposure induces local B cell class-switching resulting in a dominant IgE response
(a-c) FACS analysis of humoral immunity in the skin draining LNs of (a-b) wild-type FVB mice exposed topically to DMBA on the dorsal side of the ears twice, 3 days apart, and analyzed 7 days after last exposure and (c) wild-type FVB mice exposed to DMBA once weekly on shaved back skin and analysed 7 days after last exposure. (a) Total LN cells (left panel) and the number of GC B cells (right panel) defined as B220+CD95+GL7+ LN cells were enumerated and compared to naïve wild-type mice. Representative flow plots show GC gated B cells and intracellular immunoglobulin staining to analyse GC B cell class-switching. (b) Representative flow plots and enumeration of PCs, gated as FSChiCD95+CD138+ cells, and intracellular immunoglobulin staining to determine isotype switching. (a-b) naïve controls (n=9), DMBA treated (n=11). (c) The axillary LN B cell response was analyzed weekly at indicated time-points (n=3 per time-point). Statistical analysis by two-tailed Student’s t-test for unpaired data; *p<0.05, ***p<0.001 and ****p<0.0001. ns = not significant. Data show one experiment representative of 5 (a,b) and 2 (c) independent experiments with similar results. Enumerated data are presented as mean ± SEM.
Figure 3
Figure 3. Carcinogen-induced IgE protects against carcinogenesis
(a-b) Tumor susceptibility expressed as tumor latency (time to appearance of first tumor), tumor incidence (average number of tumors per mouse) and tumor area (average tumor size per mouse) in (a) BALB/c wild-type and Igh7-/- mice (n=14/group) and (b) BALB/c wild-type (n=10) and FceR1a-/- (n=11) mice following DMBA-induced carcinogenesis. Data are expressed as mean ± SEM and statistical significance assessed using Log-rank (Mantel-Cox) test for tumor latency and linear regression for tumor incidence and area. (c) FACS analysis of FcεRI+ cells among total CD45+ leukocyte infiltrate in human SSC tissue, peri-lesional skin and matched blood samples (n=12 for SSC and n=10 for peri-lesional skin and blood). Red triangles depict mean proportion of FcεRI+ cells in the group. Statistical analysis by paired Wilcoxon test; **p<0.01. (d) Tissue transcripts of FceR1a in whole human skin and SSC tissue were analyzed by NanoString nCounter. The tissue was collected and scored independently for ‘tumor risk’ by an experienced dermatopathologist; non-UV (n=3), peri-lesional (n=6), low risk SSC (n=12), high risk SSC (n=24) and metastasis (n=11). Log2 RNA counts of FcεRI are shown for individual ‘risk groups’ and presented as mean ± SEM. Statistics using one-way ANOVA and testing for linear trend of expression between ‘risk groups’. Data in (a,b) are representative of 2 independent experiments with similar results. WT = wild-type.
Figure 4
Figure 4. Carcinogen-induced humoral immunity depends on αβ T cell-derived IL-4
(a) FACS analysis of humoral immunity in the skin draining LNs of FVB wild-type (n=6), Il4-/- (n=5) and Tcrb-/- (n=5) mice exposed topically to DMBA on the dorsal side of the ears twice, 3 days apart, and analysed 7 days after the last exposure relative naïve wild-type controls (n=6). Graphs show number of total LN cells, B220+CD95+GL7+ GC B cells and IgG1+ or IgE+ FSChiCD95+CD138+ PCs presented as mean ± SEM. Representative flow plots show IgG1+ and IgE+ PCs in wild-type, Il4-/- and Tcrb-/- mice. (b) FACS analysis of humoral immunity in the skin draining LNs of Tcrb-/- mice reconstituted with wild-type CD4+ αβ T cells (n=3) or Il4-/- CD4+ αβ T cells (n=4) 1 day prior to topical DMBA exposure as described in (a). Statistics in (a-b) by two-tailed Student’s t-test for unpaired data; *p<0.05, **p<0.01, ***p<0.001 and ****p<0.0001. ns = not significant. (c) Tumor susceptibility expressed as tumor latency (time to appearance of first tumor), tumor incidence (average number of tumors per mouse) and tumor area (average tumor size per mouse) in FVB wild-type and Il4-/- mice (n=9/group) following DMBA-induced carcinogenesis. Data are expressed as mean ± SEM and statistical significance assessed using Log-rank (Mantel-Cox) test for tumor latency and linear regression for tumor incidence and area. Data in (a,b) are representative of 3 independent experiments with similar results. WT = wild-type.
Figure 5
Figure 5. Induction of tumor-protective IgE requires γδ TCR+ IEL
(a) FACS analysis of humoral immunity in the skin draining LNs of FVB wild-type and Tcrd-/- mice exposed topically to DMBA on the dorsal side of the ears twice, 3 days apart, and analyzed 4 or 7 days after last exposure (wild-type naïve (n=10), wild-type 4 days (n=8), wild-type 7 days (n=10), Tcrd-/- 4 days (n=5), Tcrd-/- 7 days (n=10)). Graphs show number of total LN cells, B220+CD95+GL7+ GC B cells and IgG1+ or IgE+ FSChiCD95+CD138+ PCs. (b) ELISA of IgE in serum of wild-type and Tcrd-/- mice topically exposed to DMBA on shaved back skin and bled before and 4 days after exposure (n=10/group). (c-d) FACS analysis and enumeration of (c) LN and skin γδ T cells and (d) humoral immunity in the skin draining LNs of Tcrd-/-→wild-type and wild-type→Tcrd-/- chimeric mice relative to chimeric control mice following exposure to DMBA and analysis at day 7 as in (a) (n=5/group). (e) FACS analysis of IgE+ PCs in the skin draining LNs of FVB wild-type (n=6) and Vg5Vd1-/- (n=8) mice exposed to DMBA and analysed as in (a). Statistics in (a-d) by one-way ANOVA multiple comparison and (e) two-tailed Student’s t-test for unpaired data; *p<0.05, **p<0.01, ***p<0.001 and ****p<0.0001. ns = not significant. nd = not detected. All data presented as mean ± SEM. Data show one experiment representative of 3 (a,b) and 2 (c,d) independent experiments with similar results. WT = wild-type.
Figure 6
Figure 6. γδ T cells promote a distinct IgE repertoire in response to carcinogen
(a-j) High-throughput sequencing and heavy-chain repertoire analysis of IgG1 and IgE in sorted B220+CD95+GL7+ GC B cells and FSChiCD95hiCD138+ PCs from skin draining LNs of wild-type and Tcrd-/- mice 7 days after the last of two topical exposures to DMBA (n=6/group). (a-b) Average clone size. (c) Average clonal diversity of IgG1 and IgE PC repertoires in wild-type and Tcrd-/- mice (‘General diversity index (qD)’ displayed as a measure of ‘clonal frequencies (q)’; p<0.05 for IgE from q<22). (d) Kidera factor PCA showing IgG1+ and IgE+ GC B cells and PCs in wild-type (left) and Tcrd-/- mice (right). (e) 3D plot of average VDJ gene family usage in IgE+ PCs in wild-type (top) versus Tcrd-/- (bottom) mice. V and D genes used <1% in the repertoire removed for clarity. (f-g) VD repertoire of IgE+ PCs in wild-type and Tcrd-/- mice with (f) showing % use of V1D2 and (g) % use of other VD combinations after V1D2 exclusion. (h) Kidera factor PCA, (i) CDRH3 length and indicated characteristics and (j) % mutations in CDRH3 compared to germline in V3Dx clones compared to other indicated VD families in wild-type IgE+ PCs. Statistics by two-tailed Student’s t-test for unpaired data (a, b, f and g) and one-way ANOVA multiple comparison (i-j); *p<0.05, **p<0.01, ***p<0.001 and ****p<0.0001. Data in a,b,f,g,i presented as mean ± SEM. WT = wild-type.
Figure 7
Figure 7. DMBA-induced IgE is autoantigenic and differs from TPA-induced IgE
(a) Autoreactive binding to HEp-2 cells of IgE in serum from DMBA-treated wild-type or Tcrd-/- mice and TPA-treated wild-type mice (serum diluted 1:25, 1:5 and 1:5 respectively to match IgE titers). Examples of the most common patterns are shown, IgE binding (red) and nuclei (blue). (b) ELISA of anti-ds-DNA autoreactivity of IgE in serum from DMBA-treated wild-type (n=16) or Igh7-/- (n=6) mice and naïve wild-type controls (n=5). (c) FACS analysis of γH2AX expression in CD45- skin epithelial cells, as a measure of ds-DNA breaks, at indicated time-points after topical DMBA or TPA (n=8/group). (d-g) High-throughput sequencing and heavy-chain repertoire analysis of IgE in sorted FSChiCD95hiCD138+ PCs from skin draining LNs of wild-type mice 7 days after topical exposures to DMBA or TPA (n=6/group). (d) Average clonal diversity throughout the IgE+ PC repertoire (‘General diversity index (qD)’ displayed as a measure of ‘clonal frequencies (q)’; p<0.05 throughout the repertoire). (e) Kidera factor PCA showing CDRH3 properties, (f) 3D plot of average VDJ gene family usage in TPA-induced IgE and (g) use of the 5 most common V families as % of the total repertoire and frequency of the V3Dx clones after topical DMBA or TPA treatment. Statistics by one-way ANOVA multiple comparison (b and c) or two-tailed Student’s t-test for unpaired data (g); *p<0.05, **p<0.01, ***p<0.001 and ****p<0.0001. ns = not significant. Data in b,c,g expressed as mean ± SEM. WT = wild-type.

Comment in

References

    1. Vernersson M, Aveskogh M, Hellman L. Cloning of IgE from the echidna (Tachyglossus aculeatus) and a comparative analysis of epsilon chains from all three extant mammalian lineages. Dev Comp Immunol. 2004;28:61–75. - PubMed
    1. Harris N, Gause WC. To B or not to B: B cells and the Th2-type immune response to helminths. Trends in immunology. 2011;32:80–88. - PMC - PubMed
    1. Profet M. The function of allergy: immunological defense against toxins. The Quarterly review of biology. 1991;66:23–62. - PubMed
    1. Marichal T, et al. A beneficial role for immunoglobulin E in host defense against honeybee venom. Immunity. 2013;39:963–975. - PMC - PubMed
    1. Palm NW, et al. Bee venom phospholipase A2 induces a primary type 2 response that is dependent on the receptor ST2 and confers protective immunity. Immunity. 2013;39:976–985. - PMC - PubMed

Publication types

MeSH terms

Substances