. 2018 Aug;50(8):1189-1195.
doi: 10.1038/s41588-018-0165-1. Epub 2018 Jul 16.

Genome doubling shapes the evolution and prognosis of advanced cancers

Affiliations

Genome doubling shapes the evolution and prognosis of advanced cancers

Craig M Bielski et al. Nat Genet. 2018 Aug.

Abstract

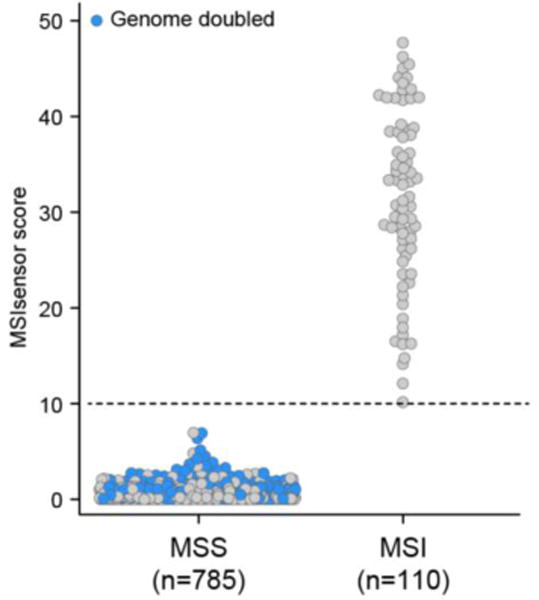
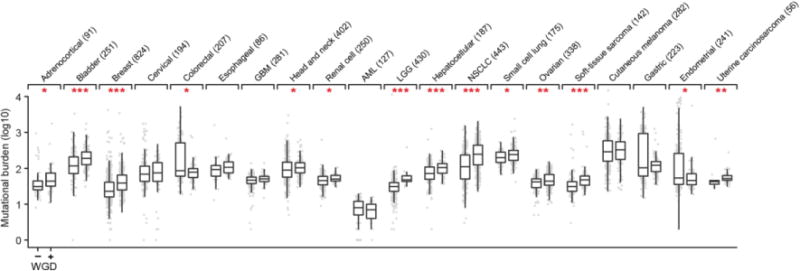
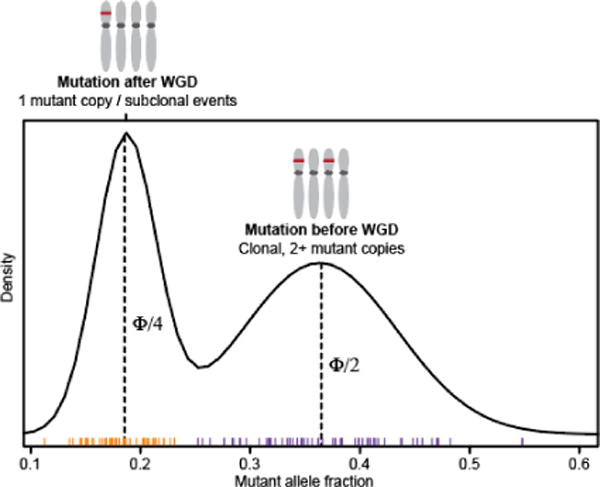
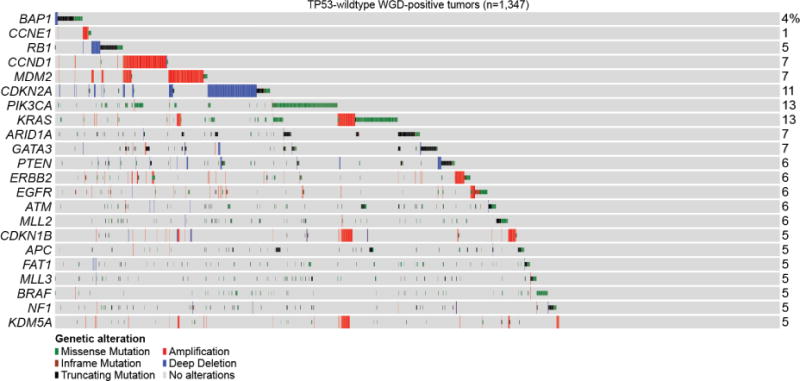
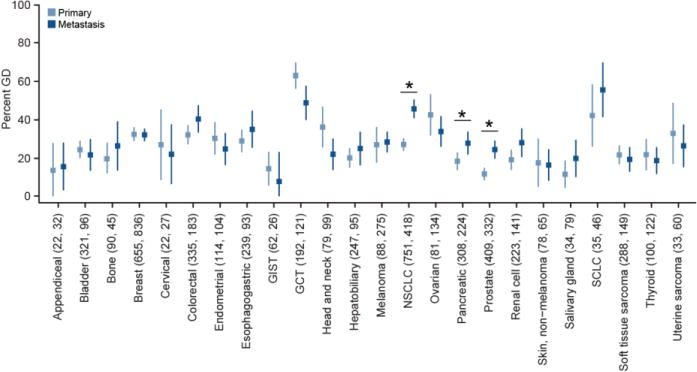
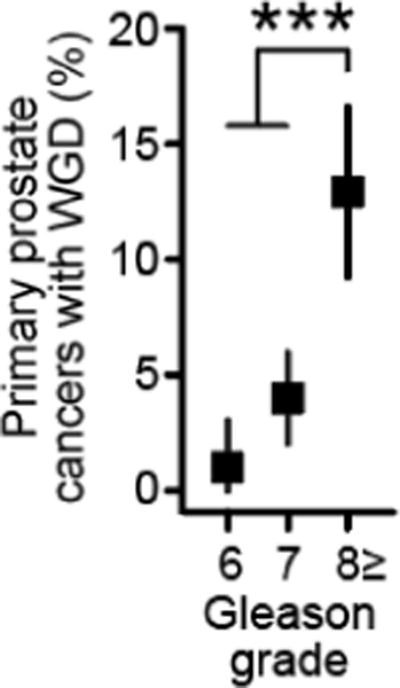
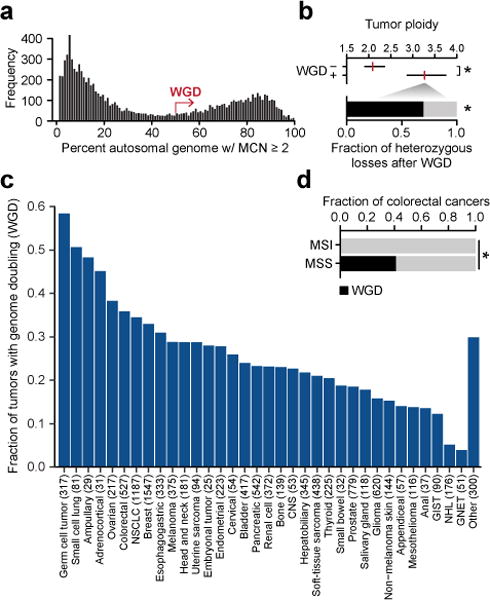
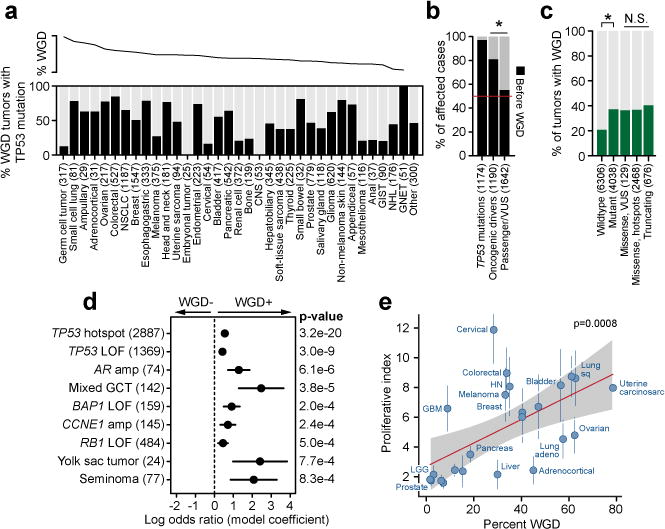
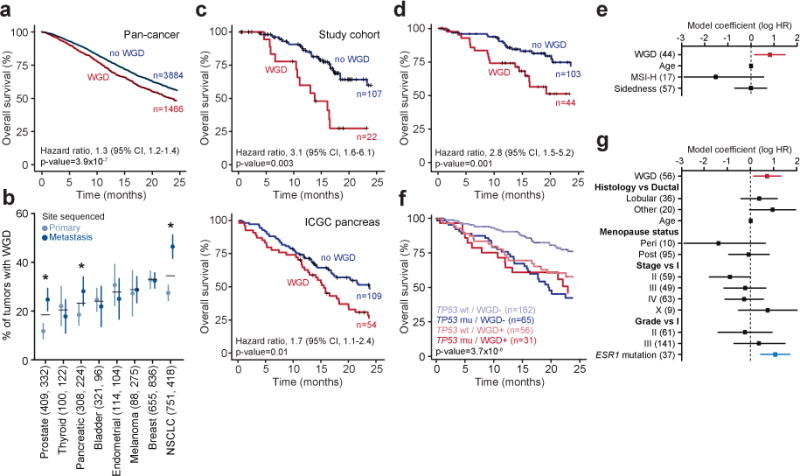
Ploidy abnormalities are a hallmark of cancer, but their impact on the evolution and outcomes of cancers is unknown. Here, we identified whole-genome doubling (WGD) in the tumors of nearly 30% of 9,692 prospectively sequenced advanced cancer patients. WGD varied by tumor lineage and molecular subtype, and arose early in carcinogenesis after an antecedent transforming driver mutation. While associated with TP53 mutations, 46% of all WGD arose in TP53-wild-type tumors and in such cases was associated with an E2F-mediated G1 arrest defect, although neither aberration was obligate in WGD tumors. The variability of WGD across cancer types can be explained in part by cancer cell proliferation rates. WGD predicted for increased morbidity across cancer types, including KRAS-mutant colorectal cancers and estrogen receptor-positive breast cancers, independently of established clinical prognostic factors. We conclude that WGD is highly common in cancer and is a macro-evolutionary event associated with poor prognosis across cancer types.


Conflict of interest statement

Competing financial interests

The authors declare no competing financial interests.

Figures

Extended Data Figure 1
Extended Data Figure 1. WGD inference from targeted capture and deep sequencing
Total (top), allele-specific (middle), and integer (bottom) DNA copy number segmentation (red) in a single tumor and matched blood normal from a patient with a TP53-mutant uterine leiomyosarcoma profiled by MSK-IMPACT (left) as well as by whole-exome sequencing (right) indicating their concordance and how WGD was inferred cohort-wide.
Extended Data Figure 2
Extended Data Figure 2. Modeling WGD in simulated cancer genomes
At top is the fraction of autosomal tumor genome with a major copy number (MCN) greater than or equal to two, as in panel A of figure 1 in the main text. In red is the threshold used to determine genome doubling. In green are 1000 simulated cancer genomes constructed from randomly sampling 22 autosomes from all samples in the cohort indicated the majority are weighted to WGD-negative samples. Light and dark blue are same simulations (as in green) repeated but only from randomly sampling either WGD-negative and WGD-positives cases respectively, indicating the inability to simulate a WGD-positive genome (having greater than or equal to 50% of the genome with MCN of two or greater) from chromosomal aberrations drawn from WGD-negative cases.
Extended Data Figure 3
Extended Data Figure 3. Assessing WGD-positive FACETS solutions
The top row shows the distribution of observed mutant allele fractions for somatic mutations in balanced regions of the genome with a) total copy number (TCN) of 2 in WGD-negative samples, b) TCN of 2 in WGD-positive tumors, and c) TCN of 4 in WGD-positive tumors. Predicted values for 2-copy and 4-copy solutions are indicated with dashed and solid lines respectively. d) The distribution of mutant allele fractions for somatic mutations in balanced regions of the subset of WGD-positive tumors with an alternative WGD-negative solution. The peak located at approximately 0.25*purity is consistent with 1 mutant allele out of 4 total copies under the WGD-positive solution. e) A representative FACETS segmentation profile for an individual tumor with a WGD-positive solution, and f) its alternative WGD-negative solution. Problematic segments (those with either no copy number assignment or those that imply multiple tumor-normal log-ratios associated with diploidy) are highlighted (arrows) indicating the alternative WGD-negative solution fits the segmentation data less well than does the WGD-positive fit.
Extended Data Figure 4
Extended Data Figure 4. Thyroid cancer type-specific rates of WGD
The percent of different thyroid cancer subtypes (sample sizes indicated in parentheses) that have undergone WGD. Asterisks reflect statistically significant differences (two-sided Fisher’s exact test; p-value=0.02, 0.002, 4.2×10⁻⁵, and 7,9×10⁻⁵ for PTC versus PDTC, MTC, ATC, and HCTC, respectively).
Extended Data Figure 5
Extended Data Figure 5. WGD and microsatellite instability
The microsatellite status of colorectal cancers, endometrial cancers, and stomach adenocarcinomas in this cohort according to their MSIsensor score, as described in Supplementary Methods. Tumors that underwent WGD are annotated in blue; dotted line corresponds to the threshold for MSI positivity.
Extended Data Figure 6
Extended Data Figure 6. WGD and mutational burden
Somatic mutational burden (point mutations and small insertions and deletions) in tumors with and without WGD in each of 20 cancer types with 20 or more WGD-positive specimens (sample sizes indicated in parentheses). All box plots represent the minimum, first quartile, median, third quartile, and maximum values (outliers detected using the standard 1.5*IQR method) within a given cancer type. Asterisks reflect statistically significant differences within cancer types (nominal p-value < 0.05, two-sided Wilcoxon test; one, two and three asterisks correspond to p-values between 0.01 and 0.05, 0.001 and 0.01, and less than 0.001 respectively). Data utilized here is from whole-exome sequencing from specimens in The Cancer Genome Atlas (TCGA) that are of cancer types overlapping with those included in our prospective cohort. TCGA data was utilized for its increased power to determine mutational burden.
Extended Data Figure 7
Extended Data Figure 7. Timing the chronology of mutations relative to WGD
Schematic representation of the timing of mutations relative to WGD in affected cases.
Extended Data Figure 8
Extended Data Figure 8. WGD and telomere length
Telomere length (TL ratio is matching tumor over normal samples) as a function of WGD status in 25 cancer types. TL was inferred from either high or low-pass whole-genome sequencing or from whole-exome sequencing data from The Cancer Genome Atlas. All box plots represent the minimum, first quartile, median, third quartile, and maximum values (outliers detected using the standard 1.5*IQR method) within a given cancer type. Individual samples are dots that are colored based on TERT status (when available; wildtype, those harboring a known TERT promoter mutation, or TERT rearrangements).
Extended Data Figure 9
Extended Data Figure 9. Genomic alterations in TP53-wildtype WGD-positive tumors
The most common genomic alterations in the 1,347 TP53-wildtype WGD-positive tumors are shown including key effectors of E2F-mediated G1 arrest, which account for 31.8% of such tumors (15% when including only those covariates identified as significant in our model, see Methods). Alteration types are indicated by the legend (bottom).
Extended Data Figure 10
Extended Data Figure 10. WGD in primary and metastatic cancers
The rate of WGD in primary and metastatic samples in the indicated cancer types in the prospective cohort is shown (number of primary and metastatic samples indicated in parentheses; error bars are the binomial confidence intervals). Asterisks reflect statistically significant differences as in Fig. 3b.
Extended Data Figure 11
Extended Data Figure 11. WGD and Gleason grade in primary prostate cancers
The rate of WGD in 797 primary prostate cancers as a function of Gleason grade (n=97, 375, and 325 for Gleason grades 6, 7, 8+, respectively). Error bars are the binomial confidence intervals. Asterisks reflect statistical significance (p-value=7.3×10⁻⁷, two-sided Chi-squared test).
Figure 1
Figure 1. The prevalence of genome doubling in advanced cancers
a) The bimodal distribution of the fraction of autosomal genome with a major copy number of two or greater in the prospectively characterized cohort (not shown, specimens of largely copy-neutral genomes with <2% MCN of two or greater). b) At top is the median (red) and IQR of ploidy among cases with and without WGD (n=2833 and 7511, respectively; p-value<10−16, two-sided Mann-Whitney U test). At bottom is the fraction of large-scale heterozygous losses that molecular timing analysis indicates arose after WGD (p-value=2.7×10−68, two-sided Chi-squared test after adjusting for doubled genome content). c) The prevalence of WGD by cancer type (NSCLC, non-small cell lung cancer; CNS, central nervous system; GIST, gastrointestinal stromal tumor; GNET, gastrointestinal neuroendocrine tumor; NHL, non-hodgkin lymphoma). d) The prevalence of WGD in colorectal cancers as a function of their microsatellite status (MSS, microsatellite stable; MSI, microsatellite instability; n=430 and 72, respectively; p-value = 1.8×10⁻¹¹, two-sided Chi-squared test).
Figure 2
Figure 2. Genome correlates of genome doubling
a) At top is the percent of cases with WGD by cancer type, as sorted in panel 1a. At bottom is the percent of WGD-positive tumors in each cancer type that also possess a TP53 mutation. b) The percent of WGD-positive cases in which TP53 mutations, other oncogenic driver mutations, or presumed passenger mutations or variants of unknown significance preceded the WGD event (number of samples per class indicated in parentheses; asterisk p-value=4×10−39, two-sided Chi-squared test). c) The rate of WGD in cases with different TP53 genotypes, from wildtype to mutant and among different classes of mutations (number of samples per class indicated in parentheses). Asterisk reflects statistical significance (p-value=7.2×10−77, two-sided Chi-squared test). N.S. denotes not significant (p-values ranging from 0.10 to 0.98). d) The statistically significant associations (nominal p-value < 0.001) with WGD across the cohort as assessed by a multivariable regression model. Error bars on the model coefficients (log odds ratio) are plus/minus two times the standard error, number of samples per variable indicated in parentheses. e) The correlation between the rate of WGD and the median proliferative index inferred from DNA and RNA sequencing of the same specimens in 24 cancer types from TCGA. Vertical lines represent the MAD of the proliferative index, red line is Spearman correlation (p-value as indicated), and shaded area is the 95% prediction interval. For clarity, cancer types shown but not labeled include endometrial, esophageal, renal cell, renal papillary, sarcoma, stomach, and thyroid.
Figure 3
Figure 3. Genome doubling and outcome
a) The presence of WGD in the genomes of advanced cancers was associated with worse overall survival (statistics as indicated). b) The prevalence of WGD in primary and metastatic tumors of multiple cancer types (number of primary and metastatic samples indicated in parentheses, error bars are the binomial confidence intervals, asterisks indicate statistical significance as determined by a two-sided Fisher’s exact test, p-value=1.3×10⁻⁴, 0.042, and 8.1×10⁻⁶ for prostate, pancreas, and NSCLC, respectively). c) While significantly more common in metastatic pancreas cancers (panel b), WGD in primary pancreas cancers was associated with worse prognosis in our study cohort even after adjusting for age and both resection and TP53 mutational status (top; statistics as indicated, LRT p-value) as well as in an independent cohort of surgically resected primary pancreas cancers from the International Cancer Genome Consortium (bottom; statistics as indicated, LRT p-value). d-e) The presence of WGD in the tumor genomes of patients with KRAS-mutant colorectal cancers was associated with worse overall survival (statistics as indicated, LRT p-value), including in a multi-variable model (panel e) with known prognostic variables including age at diagnosis, microsatellite status, and right versus left-sided disease (number of samples per variable indicated in parentheses). f-g) Tumor-specific WGD in patients with HR-positive/HER2-negative TP53-wildtype breast cancers was associated with worse overall survival (shown is the LRT p-value for the four classes included in panel (f) including in a multi-variable model (panel g) of prognostic variables at breast cancer diagnosis as well as ESR1 mutations (number of samples per variable indicated in parentheses).

References

    1. Van de Peer Y, Mizrachi E, Marchal K. The evolutionary significance of polyploidy. Nat Rev Genet. 2017;18:411–424. - PubMed
    1. Davoli T, de Lange T. The causes and consequences of polyploidy in normal development and cancer. Annu Rev Cell Dev Biol. 2011;27:585–610. - PubMed
    1. Storchova Z, Pellman D. From polyploidy to aneuploidy, genome instability and cancer. Nat Rev Mol Cell Biol. 2004;5:45–54. - PubMed
    1. Fujiwara T, et al. Cytokinesis failure generating tetraploids promotes tumorigenesis in p53-null cells. Nature. 2005;437:1043–7. - PubMed
    1. Carter SL, et al. Absolute quantification of somatic DNA alterations in human cancer. Nature biotechnology. 2012;30:413–21. - PMC - PubMed

Publication types

Substances