. 2018 Aug;50(8):1180-1188.
doi: 10.1038/s41588-018-0159-z. Epub 2018 Jul 16.

High-throughput identification of noncoding functional SNPs via type IIS enzyme restriction

Affiliations

High-throughput identification of noncoding functional SNPs via type IIS enzyme restriction

Gang Li et al. Nat Genet. 2018 Aug.

Abstract

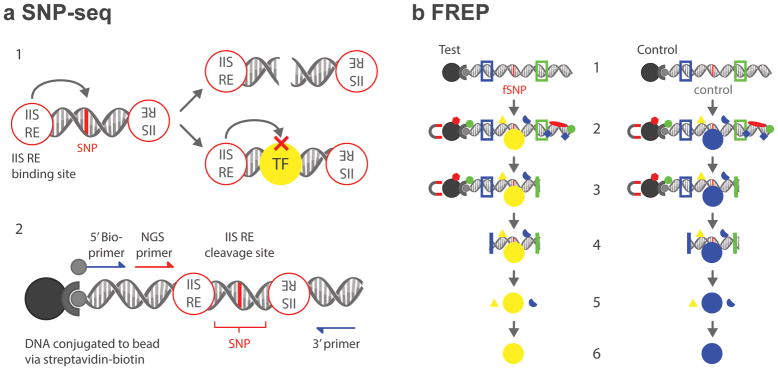
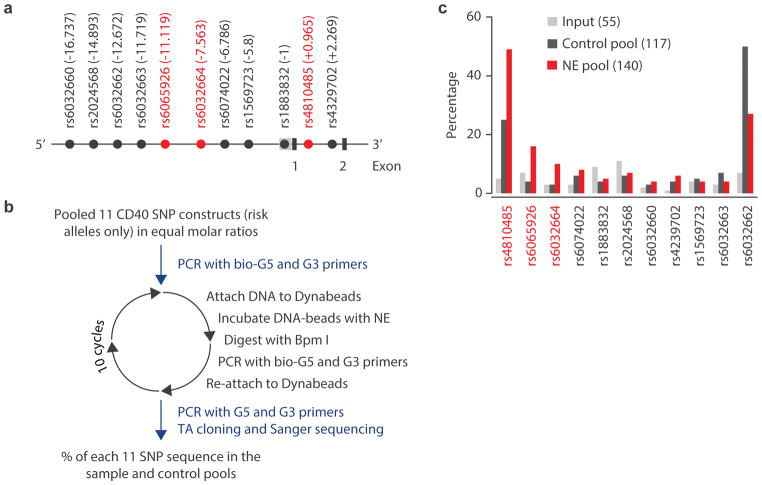
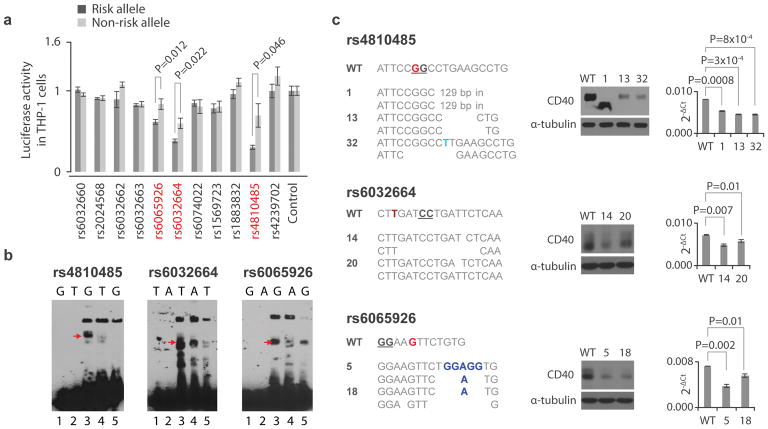
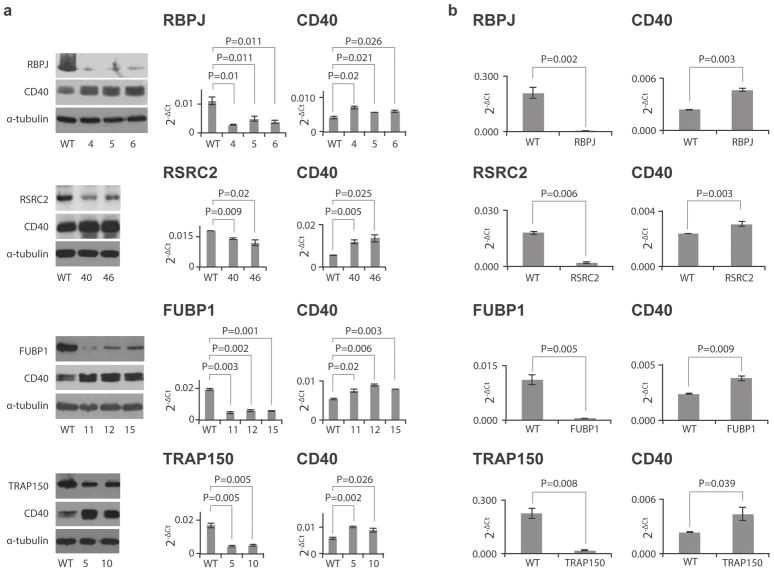
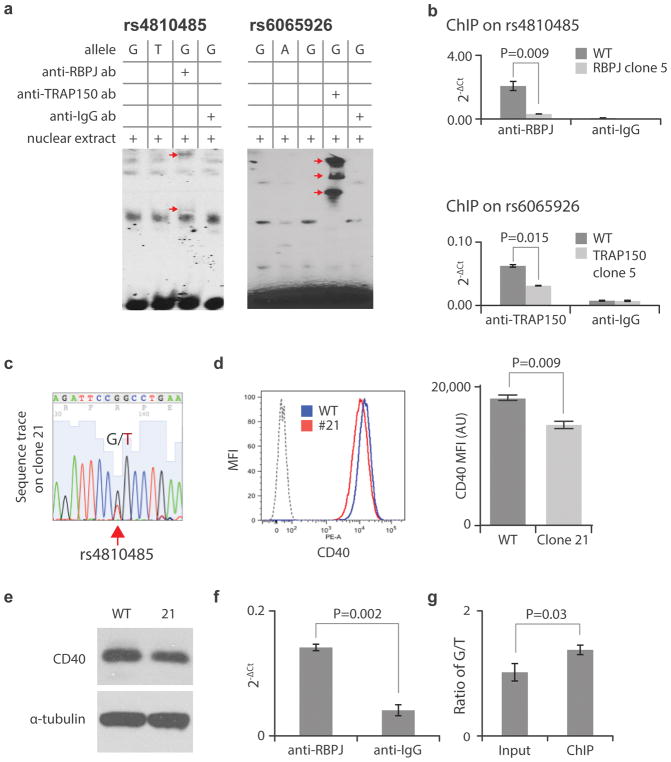
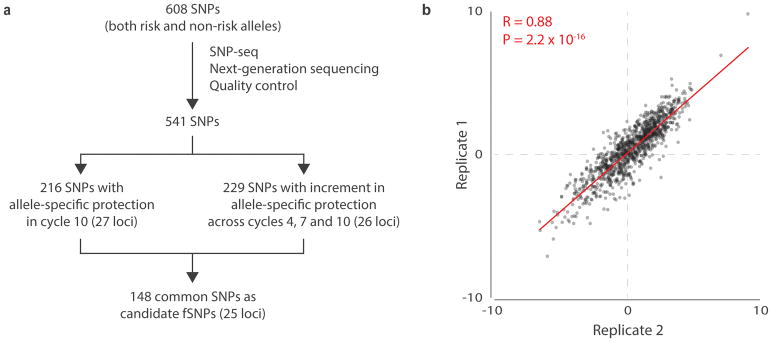
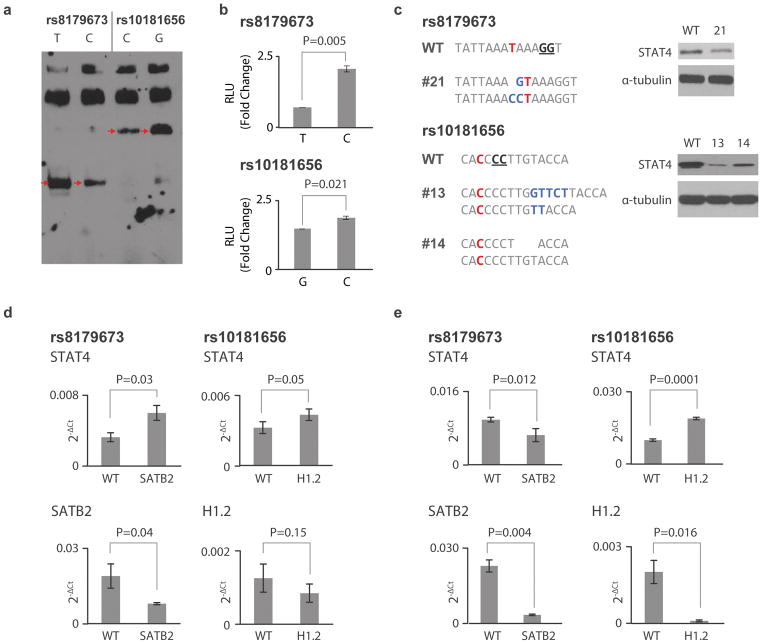
Genome-wide association studies (GWAS) have identified many disease-associated noncoding variants, but cannot distinguish functional single-nucleotide polymorphisms (fSNPs) from others that reside incidentally within risk loci. To address this challenge, we developed an unbiased high-throughput screen that employs type IIS enzymatic restriction to identify fSNPs that allelically modulate the binding of regulatory proteins. We coupled this approach, termed SNP-seq, with flanking restriction enhanced pulldown (FREP) to identify regulation of CD40 by three disease-associated fSNPs via four regulatory proteins, RBPJ, RSRC2 and FUBP-1/TRAP150. Applying this approach across 27 loci associated with juvenile idiopathic arthritis, we identified 148 candidate fSNPs, including two that regulate STAT4 via the regulatory proteins SATB2 and H1.2. Together, these findings establish the utility of tandem SNP-seq/FREP to bridge the gap between GWAS and disease mechanism.


Figures

Figure 1
Figure 1. Diagram of tandem SNP-seq and FREP
A. 1. SNPs that fail to bind regulatory proteins such as transcription factors (TF) are negatively selected by PCR after type IIS restriction enzyme (IIS RE) cleavage (upper); protected fSNPs can then be enriched by PCR. A. 2. SNP-seq construct. A 31 bp SNP sequence with the SNP centered in the middle on the Bpm I cutting site is flanked with two Bpm I binding sites. A next-generation sequencing (NGS) primer is included for high throughput sequencing. The whole construct can be amplified using G5 and G3 primers. B. 1. The FREP construct with BamH I (blue) and EcoR I (green) restriction sites flanking a 31bp sequence centered on the fSNP of interest (red) and attached to a magnetic bead by streptavidin and biotin. Parallel procedures using the test fSNP and a control sequence enables identification of sequence-specific protein associations. B. 2. Incubation with nuclear extract followed by extraction of constructs from unbound nuclear proteins by magnetic bead separation. B. 3. EcoR I digestion removes 3′ DNA and proteins. B. 4. BamH I digestion removes 5′ DNA, the beads and proteins and proteins binding single stranded-DNA, which is not cut and therefore is extracted with the bead. B. 5. Protein complex identification with mass spectrometry. B. 6. Identification of associated proteins for each SNP.
Figure 2
Figure 2. Screening of fSNPs within the CD40 locus
A. Partial genomic arrangement at CD40 showing the relative positions of the 11 SNPs (in LD R2> 0.8) to the transcription start site +1 and exons 1 and 2. SNPs ultimately implicated by SNP-seq are shown in red. B. The experimental procedure for SNP-seq for the CD40 locus; NE, nuclear extract. C. Screening by SNP-seq at CD40 showing the percentage of each SNP in the input (grey), control (black) and NE (red) pools. The numbers in the parenthesis represent the total numbers that were counted after Sanger sequencing. The uneven amplification reflects PCR bias towards certain sequences such as rs4810485 and rs6032662.
Figure 3
Figure 3. Validation of fSNPs rs4810485, rs6032664, rs6065926, rs1883832, and rs6074022 as CD40 fSNPs
A. Reporter assay showing relative luciferase activity in human THP-1 cells between the risk (black) and non-risk (grey) alleles of 11 CD40 SNPs. Candidate fSNPs identified by SNP-seq highlighted in red (mean +/− SD, n=3 biological replicates, t-test with 2 tails without correction for multiple hypothesis testing). B. EMSA showing allele-specific gel shifting (arrows, n=3 independent biological replicates with similar results). rs4810485, G: risk/major allele, T: non-risk/minor allele; rs6032664, T: risk/major allele, A: non-risk/minor; rs6065926: G; risk/major, A: non-risk/minor; rs1883832: C: risk/major allele, T: non-risk/minor allele; and rs6074022, C: risk/major allele, T: non-risk/minor allele; Red arrow, allele-specific shift. Lane 1: risk allele probe only; lane 2: non-risk allele probe only; lane 3:risk allele probe with nuclear extract; lane 4: non-risk allele probe with nuclear extract; lane 5: risk allele probe with nuclear extract and excess unlabeled probe as cold competitor. C. CRISPR/Cas9 targeting rs4810485 (upper), rs6032664 (middle) and rs6065926 (lower) in the human B cell line BL2. Left: sequences showing mutations at the three SNP sites; Middle: Western blots (n=3 independent replicates with similar results); and Right: qPCR showing CD40 expression in all mutants (mean +/− SD, n=3 biological replicates, t-test with 2 tails). Red nucleotides (nts) represent the fSNPs. The genotype of WT BL2 cells at the three SNPs is homozygous. Blue nts reflect insertion; underlined nts indicate the NGG PAM for CRISPR/Cas9 targeting; in: insertion. WT: control for CRISPR/Cas9. Numbers indicate mutant clone designations.
Figure 4
Figure 4. Expression of CD40 in RNAi knockdown human B cells and human synovial fibroblasts
A. Expression of CD40 in human BL2 clones with down-regulation of RBPJ, RSRC2, FUBP1 and TRAP150 (from top to bottom) by stable shRNA targeting. Left: Western blots showing expression of targeted protein and CD40; Middle: qPCR showing the expression of RBPJ, RSRC2, FUBP1 and TRAP150 in knockdown cells (mean +/− SD, n=3 biological replicates, t-test with 2 tails); and Right: qPCR showing CD40 expression in the same cells (mean +/− SD, n=3 biological replicates, t-test with 2 tails). B. qPCR showing the expression of CD40 in human synovial fibroblasts (right) (mean +/− SD, n=3 biological replicates, t-test with 2 tails) with down-regulation of RBPJ, RSRC2, FUBP1 and TRAP150 (from top to bottom at left) by transient siRNA targeting (mean +/− SD, n=3 biological replicates, t-test with 2 tails). Western blots reflect 3 independent replicates with similar results.
Figure 5
Figure 5. Demonstration of the binding of RBPJ to rs4810485 and TRAP150 to rs6065926
A Gel super-shifting showing the binding of RBPJ to rs4810485 and TRAP150 to rs6065926. Arrows indicate the super-shifted bands in lane 3 containing the relevant antibody for risk alleles at rs4810485 and rs6065926. G and T: risk and non-risk allele for rs4810485; G and A: risk and non-risk allele for rs6065923. ab: antibody. Data reflective of 3 independent replicate experiments with similar results. B. ChIP showing endogenous binding of RBPJ to rs4810485 (upper) and TRAP150 to rs6065926 (lower); (mean +/− SD, n=3 biological replicates, t-test with 2 tails). C. Sequencing trace showing the heterozygous genotype G/T on rs4810485 from mutant 21. D. and E. Flow cytometry (representative histogram from triplicate biological repeats) (mean +/− SD, n=3 biological replicates, t-test with 2 tails) and Western blot showing reduced expression of CD40 in mutant 21 versus WT control (data reflect 3 independent biological replicates with similar results). F. ChIP of mutant 21 with an anti-RBPJ antibody showing the specific binding of RBPJ to rs4810485 site by comparison with an anti-IgG antibody (mean +/− SD, n=3 biological replicates, t-test with 2 tails). G. The ratio of risk allele G versus non-risk allele T at rs4810485 in input and ChIP DNA showing a significant enrichment of the G allele in the ChIP sample (mean +/− SD, n=3 biological replicates, t-test with 2 tails).
Figure 6
Figure 6. SNP-seq high-throughput screening of 608 JIA-associated SNPs
A. Diagram the data analysis procedure for SNP-seq. The arms are described in detail in Figs. S2 and S3. B. Correlation of the normalized sequence counts (count from sample treated with nuclear extract divided by count from control without nuclear extract) across 2 SNP-seq replicates (n=2) at cycle 10 in 541 SNPs, plotted in log2 transformation using R (See URLs https://cran.r-project.org, version 3.4.1) function “cor” and “cor.test” with the default setting using two-sided P value for Pearson correlation.
Figure 7
Figure 7
Characterization of fSNPs at the STAT4 locus. A. EMSA showing allele-specific gel shifting (arrows, n=3 independent biological replicates with similar results). rs8179673, T: risk/major allele, C: non-risk/minor; rs10181656, C: risk/major allele and G: non-risk/minor allele. B. Luciferase reporter assay showing allele-imbalanced reporter activity between the two alleles of rs8179673 and rs10181656 (mean +/− SD, n=4 biological repeats, t-test with 2 tails). C. Sequences showing mutations at SNPs rs8179673 (clone 21) and rs10181656 (clone 13 and 14) in human Jurkat T cells targeted with CRISPR/Cas9 (left). Red nts represent the fSNPs. The genotype of WT Jurkat T cells at the two SNPs is homozygous. Blue nts represent insertion; underlined nts indicate the NGG PAM for CRISPR/Cas9 targeting. Western blots showing expression of STAT4 in the targeted clones (right, reflective of 3 independent biological replicates with similar results.). D. and E. qPCR showing expression of STAT4 (upper) in SATB2 (right) and H1.2 (left) knockdown human Jurkat T cells (D) and human synovial fibroblasts (E) (mean +/− SD, n=3 biological repeats, t-test with 2 tails). WT: WT control transfected with either an empty CRISPR/Cas9 vector (Addgene) or control lentivirus (Santa Cruz, Cat#: sc-108080) for RNAi knockdown.

References

    1. Bogdanos DP, et al. Twin studies in autoimmune disease: genetics, gender and environment. J Autoimmun. 2012;38:J156–69. - PubMed
    1. Stahl EA, et al. Bayesian inference analyses of the polygenic architecture of rheumatoid arthritis. Nat Genet. 2012;44:483–9. - PMC - PubMed
    1. Lucas CL, Lenardo MJ. Identifying genetic determinants of autoimmunity and immune dysregulation. Curr Opin Immunol. 2015;37:28–33. - PMC - PubMed
    1. Little boxes. Nat Genet. 2014;46:659. - PubMed
    1. Okada Y, et al. Genetics of rheumatoid arthritis contributes to biology and drug discovery. Nature. 2014;506:376–81. - PMC - PubMed

Publication types