. 2018 Jul 16;9(1):2746.
doi: 10.1038/s41467-018-04929-8.

Intravital imaging-based analysis tools for vessel identification and assessment of concurrent dynamic vascular events

Affiliations

Intravital imaging-based analysis tools for vessel identification and assessment of concurrent dynamic vascular events

Naoki Honkura et al. Nat Commun. .

Abstract

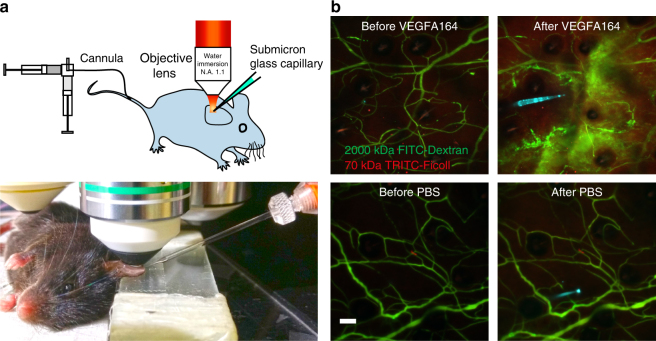
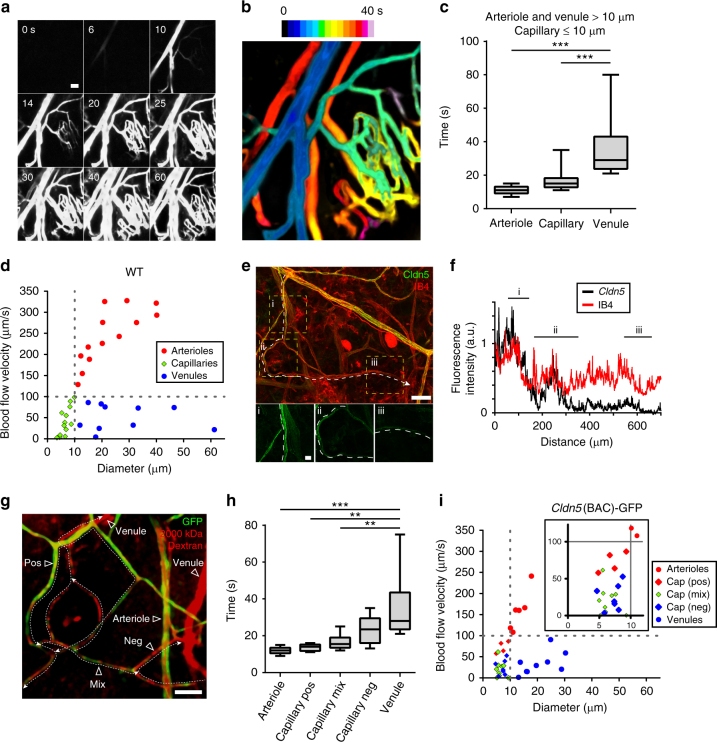
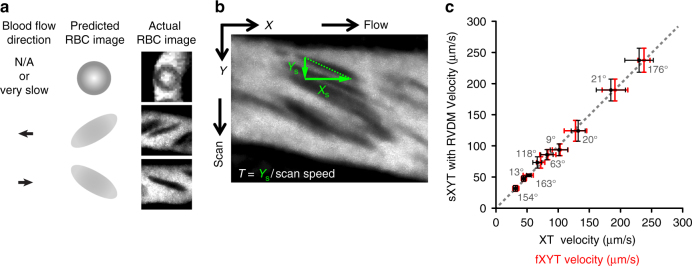
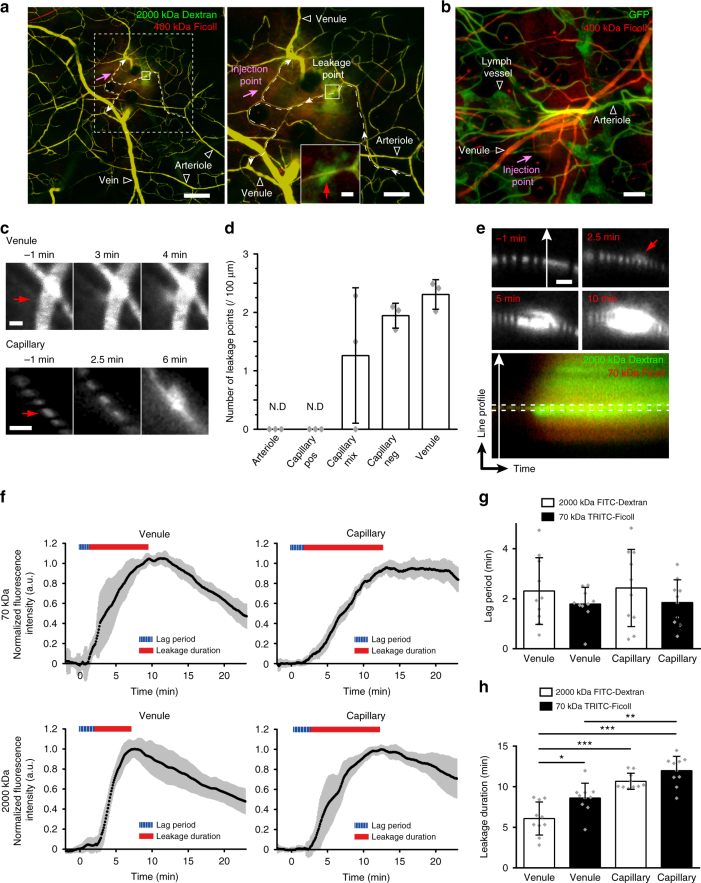
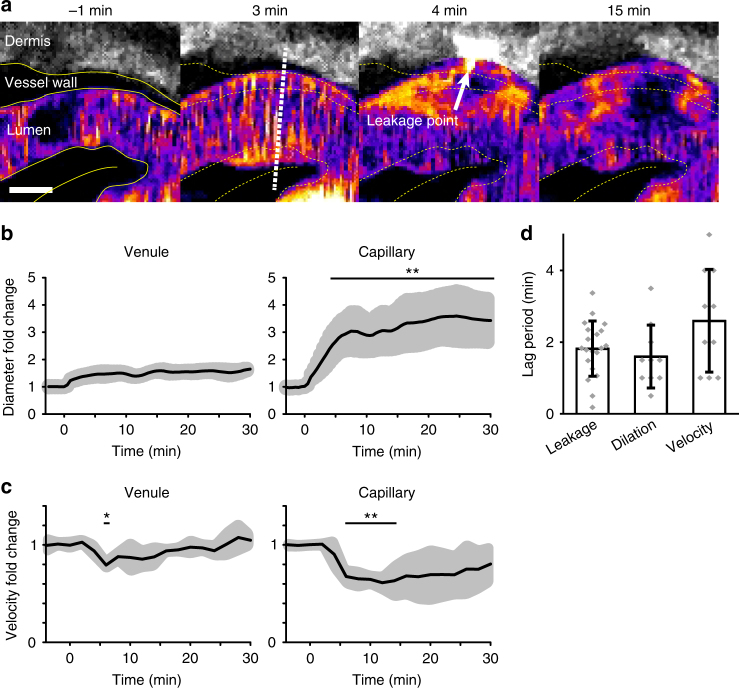
The vasculature undergoes changes in diameter, permeability and blood flow in response to specific stimuli. The dynamics and interdependence of these responses in different vessels are largely unknown. Here we report a non-invasive technique to study dynamic events in different vessel categories by multi-photon microscopy and an image analysis tool, RVDM (relative velocity, direction, and morphology) allowing the identification of vessel categories by their red blood cell (RBC) parameters. Moreover, Claudin5 promoter-driven green fluorescent protein (GFP) expression is used to distinguish capillary subtypes. Intradermal injection of vascular endothelial growth factor A (VEGFA) is shown to induce leakage of circulating dextran, with vessel-type-dependent kinetics, from capillaries and venules devoid of GFP expression. VEGFA-induced leakage in capillaries coincides with vessel dilation and reduced flow velocity. Thus, intravital imaging of non-invasive stimulation combined with RVDM analysis allows for recording and quantification of very rapid events in the vasculature.


Conflict of interest statement

The authors declare no competing interests.

Figures

Fig. 1
Fig. 1
Non-invasive imaging of the ear dermis vasculature. a Mice were anesthetized and immobilized to fix the ear under a water-immersion objective lens for intravital imaging. Cannulation of the tail vein allowed administration of fluorescent labeled dextrans or other carriers into the circulation. A sub-micron glass capillary was used for atraumatic intradermal injection. b Examples of the leakage from blood vessels in response to micro-injection of VEGFA164 but not PBS. Glass capillary was filled with 1 μl VEGFA164 (1 μg/μl) and Alexa633 dye (cyan); about 0.1 μl was injected. Green, 2000 kDa FITC-Dextran. Red, 70 kDa TRITC-Ficoll. Images were acquired 5 min before and 30 min after injection. Bar, 50 μm
Fig. 2
Fig. 2
Identification of vessel types in the ear dermis. a Distribution kinetics (frames shown at 0 up to 60 s after injection) of 2000 kDa FITC-Dextran injected as a bolus in the tail vein. Single-photon time-lapse imaging (0.5–1 s/frame) was performed without pinhole to capture a wide focal depth. Bar, 50 μm. b Heatmap of the distribution kinetics of 2000 kDa FITC-Dextran, visualizing arterioles (dark blue), capillaries (green to yellow) and venules (yellow to dark red). c Box plot showing distribution kinetics of 2000 kDa FITC-Dextran for different vessel types, defined as arterioles and venules (>10 μm) and capillaries (≤10 μm), with median (center line), 25th and 75th percentiles (box bounds), and whiskers (maximum and minimum data point) indicated. n = 7 mice. Tukey–Kramer test; ***p < 0.001. d RBC velocity in arterioles, capillaries, and venules in wild-type C57BL/6 ear dermis. n = 7 mice with >20 RBCs measured/vessel-type (10–14 vessels of each type). e Ear dermis vasculature, merged immunostaining for Cldn5 (green), and Isolectin B4 (IB4; red). Boxes labeled i–iii with white dashed vessel outlines are shown as enlarged images below, illustrating consecutive capillary segments that gradually lose Cldn5 expression. Bar, 50 μm and 10 μm in lower panels. f Line plot of Cldn5 and IB4 fluorescence intensities along capillary segments in e. g Cldn5(BAC)-GFP mouse ear dermis after injection of 2000 kDa TRITC-Dextran, with different vessel types indicated. Note that venules and certain capillary segments show circulating TRITC-Dextran (red) but do not express GFP (green). Capillaries with GFP expression (positive; pos), with mixed expression (mix) and no GFP expression (negative; neg) are indicated. Dashed lines with arrowheads show the direction of blood flow. Bar, 50 μm. h Box plot showing distribution kinetics of 2000 kDa TRITC-Dextran to different vessel types with median (center line), 25th and 75th percentiles (box bounds) and whiskers (maximum and minimum data points) indicated. Note that dextran reached the GFP-expressing capillaries before non-expressing capillaries. n = 3 mice (independent biological repeats). Tukey–Kramer test; **p < 0.01, ***p < 0.001. i RBC velocity in arterioles, venules, and different capillaries, positive (pos), mixed (mix), and negative (neg), for GFP expression in Cldn5(BAC)-GFP ear dermis. n = 3 mice with >20 measurements/vessel-type
Fig. 3
Fig. 3
RVDM principles and verification. a RBC image is influenced by the speed of laser scanning relative to blood flow velocity and direction resulting in distorted RBC dimensions. b sXYT imaging produces distorted RBC images from which RBC dimensions Xs and Ys and RBC residence time are measured within the scan field (T), thus allowing RBC velocity quantification (see Supplementary Fig. 2 and Methods). c Comparison of RBC velocities estimated from sXYT combined with RVDM, XT, and fXYT image acquisition in the same vessels. Flow angles are indicated for each measurement. n = 3 mice with more than 20 measurements/vessel
Fig. 4
Fig. 4
Dynamics of VEGFA-induced vascular leakage. a Point of leakage of circulating 2000 kDa FITC-Dextran and 400 kDa TRITC-Ficoll in a large observation area (left) and zoom-in (right). Flow direction (arrows) and leakage point in a capillary (dashed line), with leakage point boxed (solid line). Right panel, magnification of dashed box area. Capillary leakage point indicated by red arrow. Bar, 200 (left), 100 (right) and 10 μm (inset). b Leakage of 400 kDa Ficoll in response to VEGFA164 in the ear dermis of Cldn5(BAC)-GFP mice. Bar, 100 μm. c Leakage points (red arrow) in Cldn5(BAC)-GFP mouse dermis, in venule (upper) and capillary (lower), showing progressive leakage over time of 400 kDa TRITC-Ficoll in response to VEGFA164. Bar, 10 μm. d Quantification of leakage points/vessel length in the Cldn5(BAC)-GFP ear dermis. Capillaries with GFP expression (positive; pos), mixed (mix) or no GFP (negative; neg) expression were analyzed. Note that Cldn5-expressing capillaries do not leak. N.D.; not detected. n = 3 mice with 6 vessels of each type analyzed/mouse. e Representative leakage point captured by sXYT imaging at −1, 2.5, and 10 min after injection of VEGFA164 (upper and middle panels). Kymograph image (lower panel) for analysis of leakage dynamics of 2000 kDa FITC-Dextran and 70 kDa TRITC-Ficoll was made from the point indicated by the white arrow line in upper panels. Red arrow indicates the leakage point. Bar, 10 μm. f Leakage kinetics from venules (left) and capillaries (right) of 70 kDa TRITC-Ficoll (upper) and 2000 kDa FITC-Dextran (lower) with lag periods and leakage durations indicated. Gray area around solid black line indicates variability (S.D.). n = 7 mice with 10 capillaries and 10 venules analyzed. g Quantification of lag periods (min) for the different conditions. n = 7 mice and 10 vessels/condition as in f. No significant difference by Tukey–Kramer test. h Quantification of leakage duration (min) for the different conditions. n = 7 mice and 10 vessels/condition as in f. Tukey–Kramer test; *p < 0.05, **p < 0.01, ***p < 0.001
Fig. 5
Fig. 5
Vasodilation and RBC velocity dynamics in response to VEGFA. a Illustration of vasodilation at a leakage point induced in response to VEGFA164 administration. Colors: 2000 kDa FITC-Dextran in lumen; pseudocolor, 2000 kDa FITC-Dextran in dermis; white. White dotted line marks the position used for measurement of vessel diameter dynamics by FWHM at a leakage point (arrow). Bar, 5 μm. b Kinetics of vasodilation at different time points after administration of VEGFA164, in venules (left) and capillaries (right). Gray area around solid black line indicates variability (S.D.) n = 3 mice (individual biological repeats) with 5 vessels of each kind analyzed. Student’s t-test; **p < 0.01. c RBC velocity dynamics in response to VEGFA164 in venules (left) and capillaries (right). Gray area around solid black line indicates variability (S.D.) n = 3 mice and 5 vessels of each kind analyzed with more than 20 RBCs/time point. Student’s t-test; *p < 0.05, **p < 0.01. d Comparison of lag periods for the different responses to VEGFA164, leakage, vasodilation, and velocity changes. n = 20 vessels for leakage analysis in 7 mice and n = 10 vessels in 3 mice (combined capillaries and venules) for dilation and velocity analyses as in b and c panels, respectively. No significant difference by the Tukey–Kramer test

References

    1. Hanahan D, Weinberg RA. Hallmarks of cancer: the next generation. Cell. 2011;144:646–674. doi: 10.1016/j.cell.2011.02.013. - DOI - PubMed
    1. Carmeliet P, Jain RK. Angiogenesis in cancer and other diseases. Nature. 2000;407:249–257. doi: 10.1038/35025220. - DOI - PubMed
    1. Bates DO, Lodwick D, Williams B. Vascular endothelial growth factor and microvascular permeability. Microcirculation. 1999;6:83–96. doi: 10.1111/j.1549-8719.1999.tb00091.x. - DOI - PubMed
    1. Egawa G, et al. Intravital analysis of vascular permeability in mice using two-photon microscopy. Sci. Rep. 2013;3:1932. doi: 10.1038/srep01932. - DOI - PMC - PubMed
    1. Bates DO. Vascular endothelial growth factors and vascular permeability. Cardiovasc. Res. 2010;87:262–271. doi: 10.1093/cvr/cvq105. - DOI - PMC - PubMed

Publication types

MeSH terms

Substances