. 2018 Aug;3(8):870-880.
doi: 10.1038/s41564-018-0190-y. Epub 2018 Jul 16.

Host-linked soil viral ecology along a permafrost thaw gradient

Affiliations

Host-linked soil viral ecology along a permafrost thaw gradient

Joanne B Emerson et al. Nat Microbiol. 2018 Aug.

Abstract

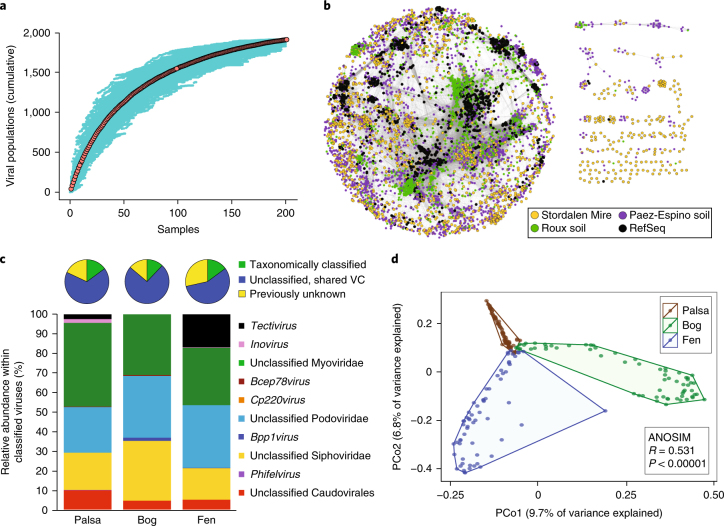
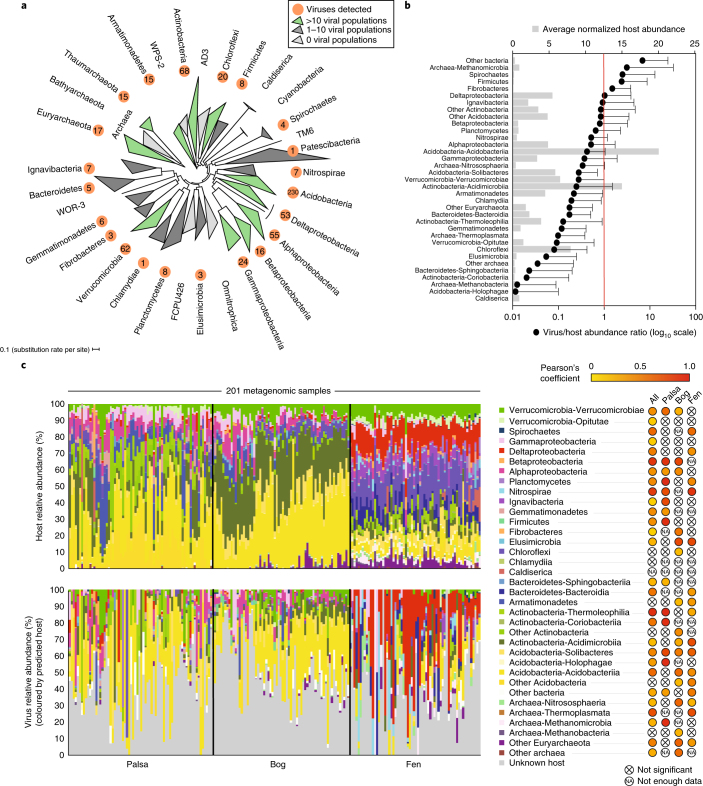
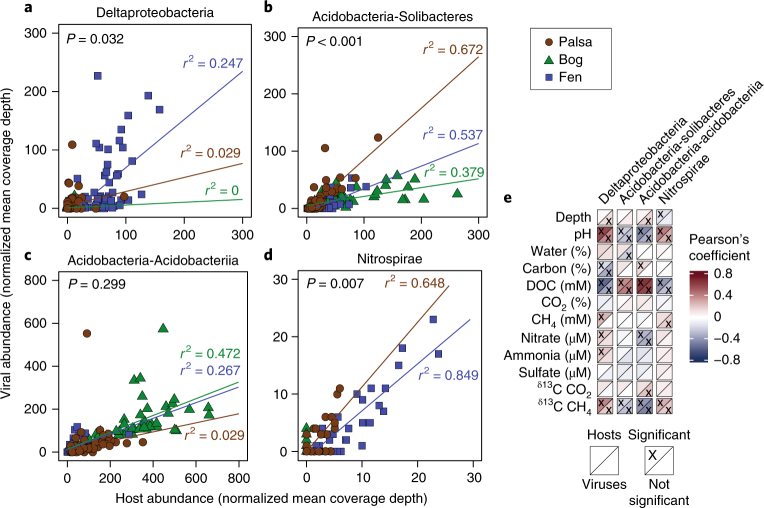
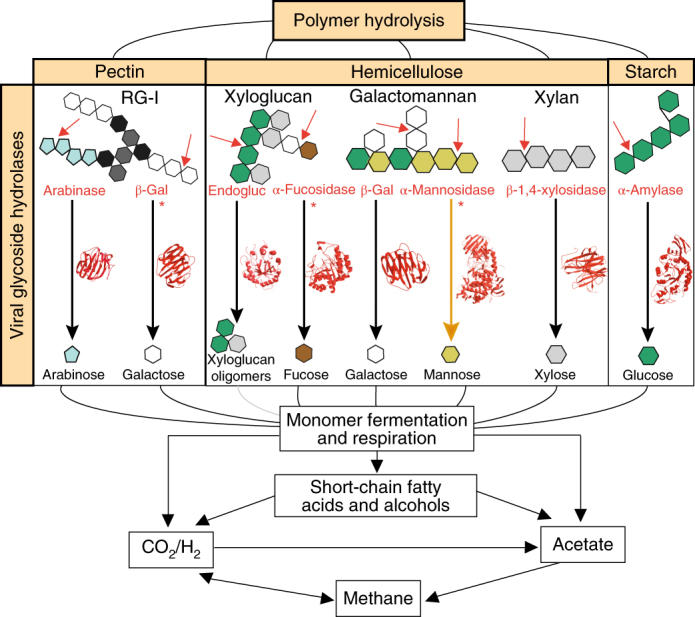
Climate change threatens to release abundant carbon that is sequestered at high latitudes, but the constraints on microbial metabolisms that mediate the release of methane and carbon dioxide are poorly understood1-7. The role of viruses, which are known to affect microbial dynamics, metabolism and biogeochemistry in the oceans8-10, remains largely unexplored in soil. Here, we aimed to investigate how viruses influence microbial ecology and carbon metabolism in peatland soils along a permafrost thaw gradient in Sweden. We recovered 1,907 viral populations (genomes and large genome fragments) from 197 bulk soil and size-fractionated metagenomes, 58% of which were detected in metatranscriptomes and presumed to be active. In silico predictions linked 35% of the viruses to microbial host populations, highlighting likely viral predators of key carbon-cycling microorganisms, including methanogens and methanotrophs. Lineage-specific virus/host ratios varied, suggesting that viral infection dynamics may differentially impact microbial responses to a changing climate. Virus-encoded glycoside hydrolases, including an endomannanase with confirmed functional activity, indicated that viruses influence complex carbon degradation and that viral abundances were significant predictors of methane dynamics. These findings suggest that viruses may impact ecosystem function in climate-critical, terrestrial habitats and identify multiple potential viral contributions to soil carbon cycling.


Conflict of interest statement

The authors declare no competing interests.

Figures

Fig. 1
Fig. 1. Overview of Stordalen Mire soil viruses.
a, An accumulation curve of viral populations in bulk soil metagenomes (n = 201). The means are represented by red circles and 200 randomizations of sample order are shown in teal. b, A network of shared predicted protein content among Stordalen Mire viruses (n = 1,907), RefSeq prokaryotic viral genomes (n = 2,010) and soil-associated viral contigs >10 kb from Paez-Espino et al. (n = 3,112) and Roux et al. (n = 2,040). Nodes (circles) represent genomes and contigs, and the shared edges (lines) indicate shared protein content. c, Pie charts indicate per cent relative abundances of Stordalen Mire viral populations (n = 828, 782 and 475 populations detected in palsa, bog and fen, respectively; palsa: n = 72 samples, bog: n = 65 samples and fen: n = 64 samples) that: have predicted taxonomy (green), have unknown taxonomy but share a viral cluster (VC) with viruses from public datasets (from b, blue), or were previously unknown (in a Stordalen Mire-exclusive VC, yellow). The bar graphs indicate the per cent relative abundances of viral taxa in each habitat, considering only viruses with predicted taxonomy (n = 323). d, Principal coordinates analysis (PCoA) of viral community composition, as derived from read mapping to viral contigs (n = 1,907) and Bray–Curtis dissimilarities; each point is one sample (n = 201). The analysis of similarity (ANOSIM) statistics consider viral community composition grouped by habitat (palsa: n = 72 samples, bog: n = 65 samples and fen: n = 64 samples).
Fig. 2
Fig. 2. Stordalen Mire virus–host linkages and abundance patterns.
a, Phylogenetic tree of bacterial and archaeal phyla (classes for Proteobacteria) with population genomes recovered from Stordalen Mire. The tree was constructed from concatenated protein sequences of single-copy genes, as in ref. . The orange circles indicate the lineages predicted to be infected by viruses, with the number of viruses shown within the circle. b, Virus/host abundance ratios by host lineage (bottom x-axis), calculated as the ratio of per base-pair average coverage depth from read mapping to viral contigs and host population genomes, respectively, normalized by the number of sequencing reads in each sample. The dots indicate the mean ratio across samples (n = 201), and the error bars indicate one standard deviation. The red line indicates the 1/1 virus/host abundance ratio. The normalized host abundance (top x-axis) is an average across all samples. c, Host and virus abundance, grouped by predicted host taxonomy. The host and virus relative abundances across the Stordalen Mire bulk soil metagenomes (n = 201), based on read mapping, are shown. Samples are separated by habitat (black vertical lines), and, within each habitat, are ordered by depth; within the depth regimes, samples are in chronological order of sampling date. Of the 140 virus–host pairs tested, Pearson’s correlation coefficients from 75 significantly correlated abundances (P < 0.05) are coloured according to the key (values appear in Supplementary Table 10); the probability of observing only 13 or more such P < 0.05 correlations given the 140 tests is less than 5% under the null hypothesis.
Fig. 3
Fig. 3. Examples of lineage-specific virus–host abundance patterns.
ad, Virus/host abundance ratios for specific host lineages, indicated at the top of each plot (palsa: n = 72, bog: n = 65 and fen: n = 64). Host lineage abundance and the abundance of viruses for that host (both calculated as the mean coverage depth from metagenomic read mapping, normalized by the number of reads in the sample) are plotted for each sample in which viruses and/or hosts were detected. Note the different axis maxima among graphs. Based on linear regression analysis (Supplementary Table 9), colour-coded best-fit lines and adjusted r2 values for each habitat are presented (there was not enough data for the bog habitat in panel d). ANOVA P values (999 permutations, significant when P < 0.05) indicate whether the interaction term in the linear regression models (that is, sample designations as palsa, bog or fen) was significantly different from not using an interaction term (that is, all samples together). e, Pearson’s correlation coefficients for the four host lineages from ad and their viruses, correlated with environmental and geochemical measurements (significant when P < 0.05; values appear in Supplementary Table 12); 38 significant correlations are depicted with an ‘x’. The probability of observing only 9 or more such P < 0.05 correlations given 96 tests is less than 5% under the null hypothesis.
Fig. 4
Fig. 4. Potential viral contributions to carbon cycling in Stordalen Mire.
Schematic overview of the carbon cycle, with light orange labels highlighting the potential viral contributions. Plant polymers that have the potential to be degraded by viral glycoside hydrolases are along the top, with examples of each below. Individual sugars are colour coded (see monomers beneath the black and orange arrows). The predicted enzymatic functions from computational protein models are listed in red, and example polymer cleavage points are indicated by the red arrows. Smaller molecules (monosaccharides and small oligosaccharides) cleaved from the polymers are shown at the ends of the black arrows, indicating the potential enzymatic conversion encoded by the viral glycoside hydrolase (the orange arrow indicates cleavage that was functionally confirmed by enzymatic assay), with the PHYRE2-modelled structure of each viral glycoside hydrolase in red. The asterisks indicate that multiple viral genes were recovered with the indicated predicted function. In those cases, the viral protein structure containing the most catalytic residues is shown (see Supplementary Table 14 for details). The grey line indicates a cleavage pathway of small oligosaccharides to monomers (non-viral). β-Gal, β-galactosidase; endogluc, endoglucanase; RG-I, rhamnogalacturonan I; black monomer, rhamnose; dark grey monomer, galacturonic acid.

Comment in

References

    1. Koven CD, et al. Permafrost carbon-climate feedbacks accelerate global warming. Proc. Natl Acad. Sci. USA. 2011;108:14769–14774. doi: 10.1073/pnas.1103910108. - DOI - PMC - PubMed
    1. Hodgkins SB, et al. Changes in peat chemistry associated with permafrost thaw increase greenhouse gas production. Proc. Natl Acad. Sci. USA. 2014;111:5819–5824. - PMC - PubMed
    1. Johansson T, et al. Decadal vegetation changes in a northern peatland, greenhouse gas fluxes and net radiative forcing. Glob. Change Biol. 2006;12:2352–2369.
    1. Schuur EAG, et al. Climate change and the permafrost carbon feedback. Nature. 2015;520:171–179. - PubMed
    1. Hultman J, et al. Multi-omics of permafrost, active layer and thermokarst bog soil microbiomes. Nature. 2015;521:208–212. - PubMed

Publication types

LinkOut - more resources