Changing Trends in Etiology-Based and Ethnicity-Based Annual Mortality Rates of Cirrhosis and Hepatocellular Carcinoma in the United States
- PMID: 30014489
- PMCID: PMC6709988
- DOI: 10.1002/hep.30161
Changing Trends in Etiology-Based and Ethnicity-Based Annual Mortality Rates of Cirrhosis and Hepatocellular Carcinoma in the United States
Abstract
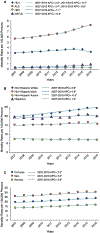
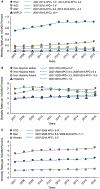
With recent improvements in the treatment of end-stage liver disease (ESLD), a better understanding of the burden of cirrhosis and hepatocellular carcinoma (HCC) is needed in the United States. A population-based study using the US Census and national mortality database was performed. We identified the age-standardized etiology-specific mortality rates for cirrhosis and HCC among US adults ages 20 years or older from 2007 to 2016. We determined temporal mortality rate patterns by joinpoint analysis with estimates of annual percentage change (APC). Age-standardized cirrhosis-related mortality rates increased from 19.77/100,000 persons in 2007 to 23.67 in 2016 with an annual increase of 2.3% (95% confidence interval [CI] 2.0-2.7). The APC in mortality rates for hepatitis C virus (HCV)-cirrhosis shifted from a 2.9% increase per year during 2007 to 2014 to a 6.5% decline per year during 2014 to 2016. Meanwhile, mortality for cirrhosis from alcoholic liver disease (ALD, APC 4.5%) and NAFLD (APC 15.4%) increased over the same period, whereas mortality for hepatitis B virus (HBV)-cirrhosis decreased with an average APC of -1.1%. HCC-related mortality increased from 3.48/100,000 persons in 2007 to 4.41 in 2016 at an annual rate of 2.0% (95% CI 1.3-2.6). Etiology-specific mortality rates of HCC were largely consistent with cirrhosis-related mortality. Minority populations had a higher burden of HCC-related mortality. Conclusion: Cirrhosis-related and HCC-related mortality rates increased between 2007 and 2016 in the United States. However, mortality rates in HCV-cirrhosis demonstrated a significant decline from 2014 to 2016, during the direct-acting antiviral era. Mortality rates for ALD/NAFLD-cirrhosis and HCC have continued to increase, whereas HBV-cirrhosis-related mortality declined during the 10-year period. Importantly, minorities had a disproportionately higher burden of ESLD-related mortality.
© 2018 by the American Association for the Study of Liver Diseases.
Conflict of interest statement
Potential conflict of interest:
Figures


Comment in
-
Letter to the Editor: The Need for Complete Population-Based Studies on the Etiology of Liver Disease.Hepatology. 2019 Jun;69(6):2712. doi: 10.1002/hep.30415. Epub 2019 Apr 17. Hepatology. 2019. PMID: 30521108 No abstract available.
-
The Triumph of Bacchus: The Emergence of Nonalcoholic Steatohepatitis and Alcoholic Liver Disease as the Leading Causes of Mortality From Cirrhosis.Hepatology. 2019 Mar;69(3):931-933. doi: 10.1002/hep.30408. Epub 2019 Feb 19. Hepatology. 2019. PMID: 30570159 No abstract available.
-
Mortality from liver cirrhosis and HCC in the DAA era: success in viral control is darkened by raise of metabolic disease.Hepatobiliary Surg Nutr. 2019 Jun;8(3):307-310. doi: 10.21037/hbsn.2019.01.21. Hepatobiliary Surg Nutr. 2019. PMID: 31245422 Free PMC article. No abstract available.
References
-
- Bosetti C, Levi F, Lucchini F, Zatonski WA, Negri E, La Vecchia C. Worldwide mortality from cirrhosis: an update to 2002. J Hepatol 2007;46:827–839. - PubMed
MeSH terms
Grants and funding
LinkOut - more resources
Full Text Sources
Other Literature Sources
Medical

