Observational Study
. 2018 Aug;84(2):274-288.
doi: 10.1002/ana.25287. Epub 2018 Sep 6.

Natural History of Vanishing White Matter

Collaborators, Affiliations
Observational Study

Natural History of Vanishing White Matter

Eline M C Hamilton et al. Ann Neurol. 2018 Aug.

Abstract

Objective: To comprehensively describe the natural history of vanishing white matter (VWM), aiming at improving counseling of patients/families and providing natural history data for future therapeutic trials.

Methods: We performed a longitudinal multicenter study among 296 genetically confirmed VWM patients. Clinical information was obtained via disease-specific clinical questionnaire, Health Utilities Index and Guy's Neurological Disability Scale assessments, and chart review.

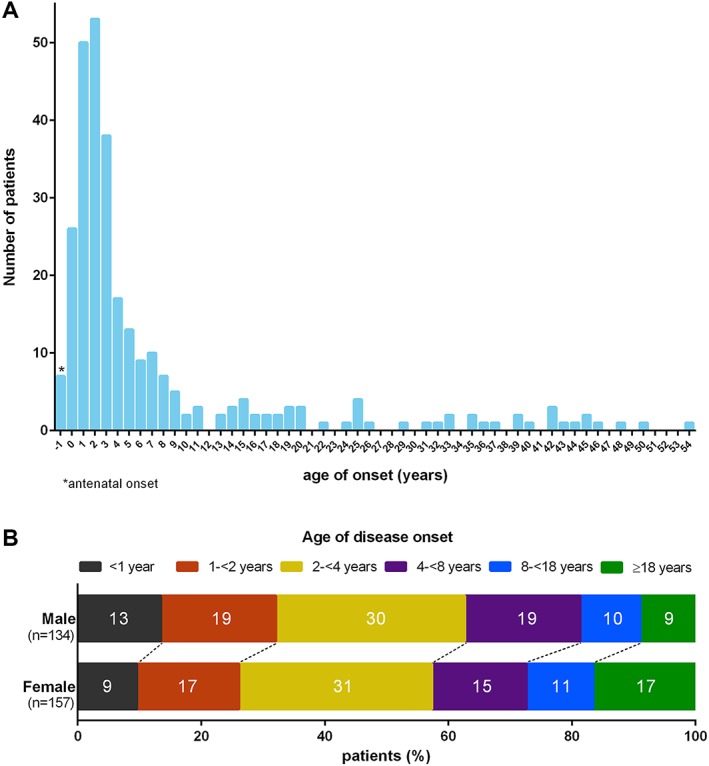
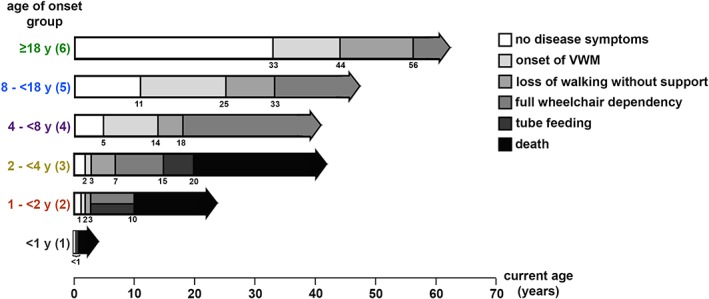
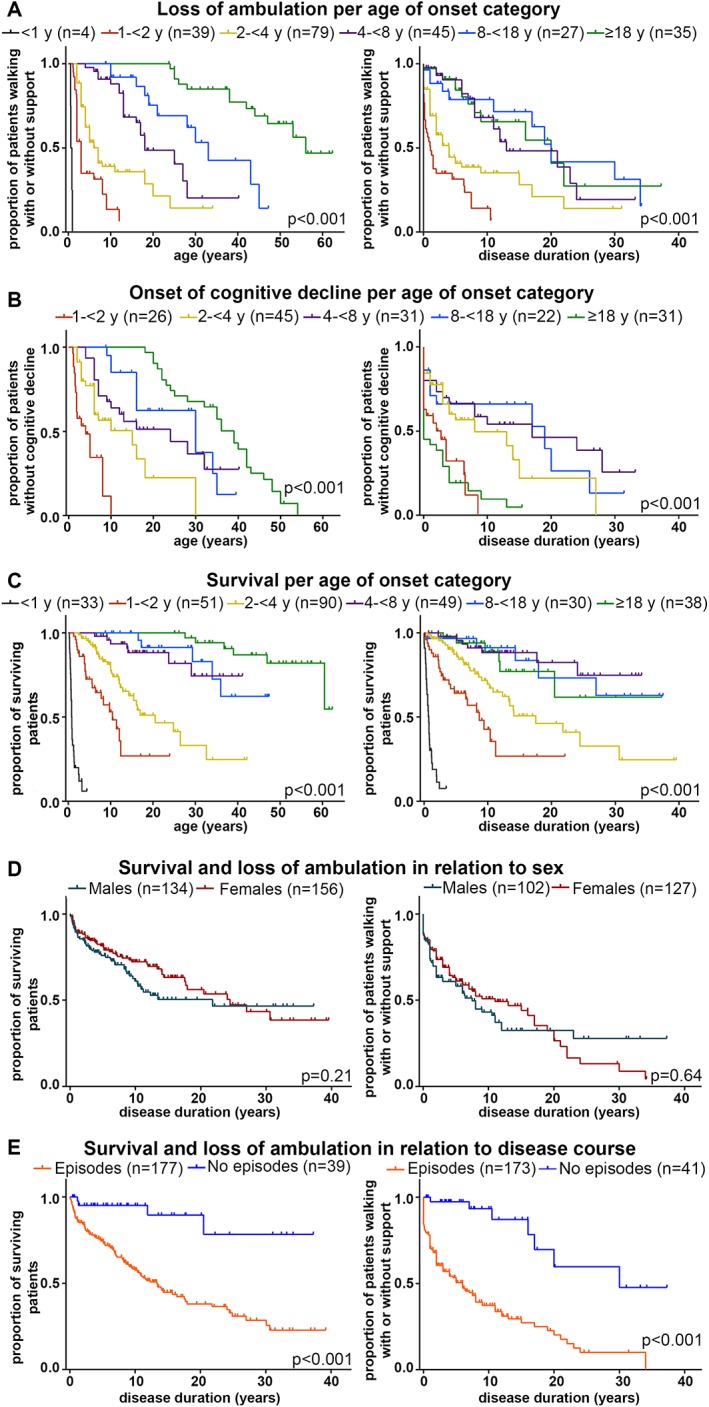
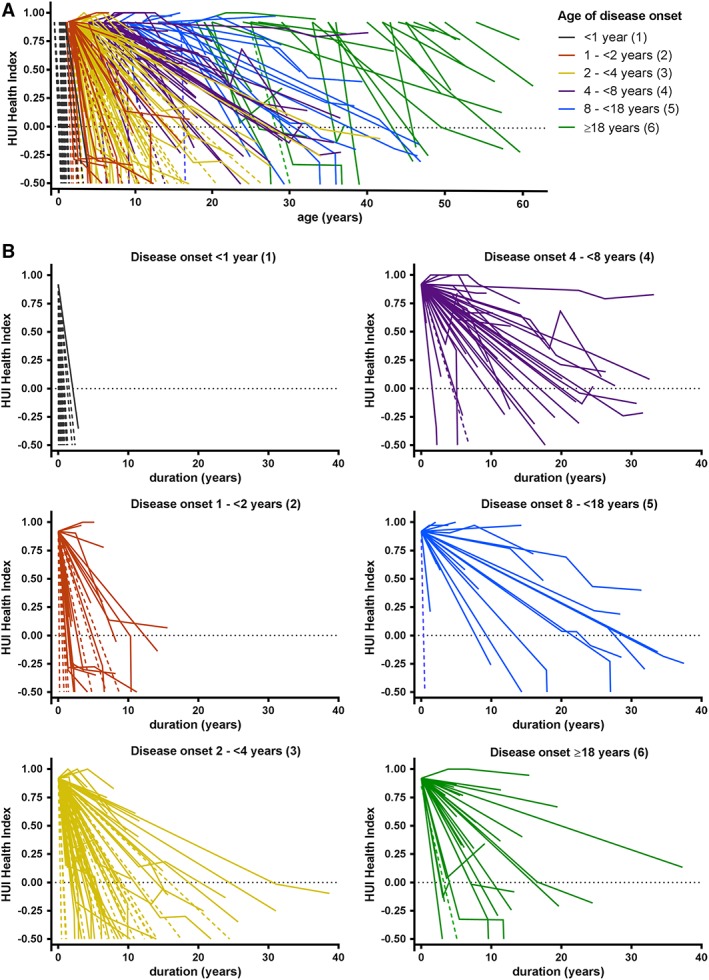
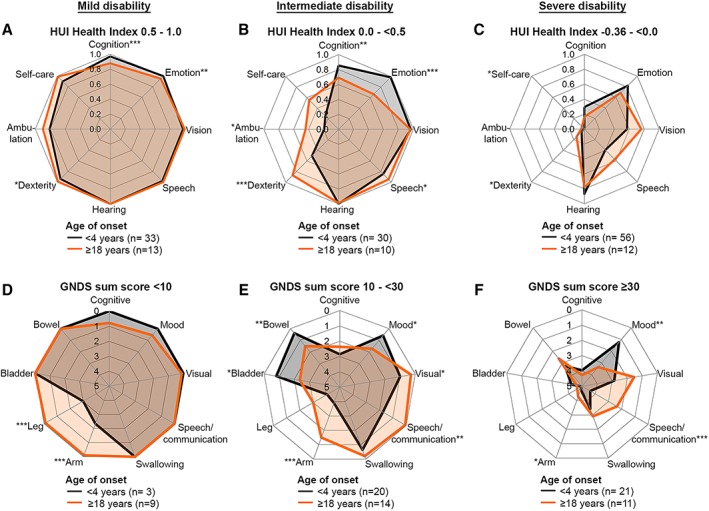
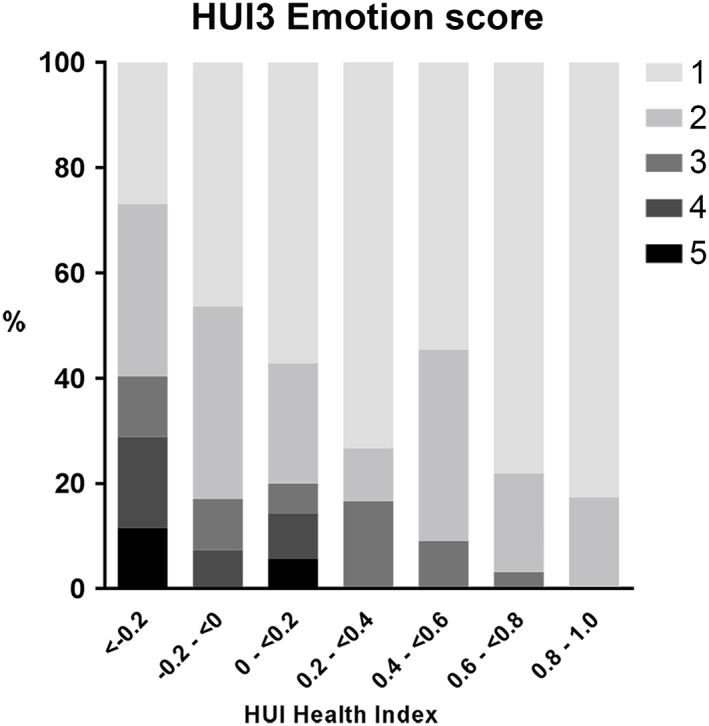
Results: First disease signs occurred at a median age of 3 years (mode = 2 years, range = before birth to 54 years); 60% of patients were symptomatic before the age of 4 years. The nature of the first signs varied for different ages of onset. Overall, motor problems were the most common presenting sign, especially in children. Adolescent and adult onset patients were more likely to exhibit cognitive problems early after disease onset. One hundred two patients were deceased. Multivariate Cox regression analysis revealed a positive relation between age at onset and both preservation of ambulation and survival. Absence of stress-provoked episodes and absence of seizures predicted more favorable outcome. In patients with onset before 4 years, earlier onset was associated with more severe disability and higher mortality. For onset from 4 years on, disease course was generally milder, with a wide variation in severity. There were no significant differences for sex or for the 5 eIF2B gene groups. The results confirm the presence of a genotype-phenotype correlation.

Interpretation: The VWM disease spectrum consists of a continuum with extremely wide variability. Age at onset is a strong predictor for disease course. Ann Neurol 2018;84:274-288.


Figures

Figure 1
Figure 1
Distribution of age at onset. (A) Histogram representing the number of patients per age at onset (years) for 291 vanishing white matter patients. (B) Distribution of patients per age at onset group per sex.
Figure 2
Figure 2
Disease course per age at onset group. Age at onset of vanishing white matter (VWM) and age at times of loss of walking without support, full wheelchair dependency, start of tube feeding, and death among 291 patients are shown (numbers of patients for each item are shown in Supplementary Table 3). The horizontal arrows range from birth to the longest follow‐up in the respective age at onset group. The numbers below the horizontal arrows indicate the median age (years) at the respective event as estimated with the use of Kaplan–Meier curves. [Color figure can be viewed at http://www.annalsofneurology.org]
Figure 3
Figure 3
Disease progression in relation to age at onset, episodic deterioration, and sex. Kaplan–Meier plots on (A) full wheelchair dependency (loss of walking with or without support) in relation to age (left) and disease duration (right), per age at onset group; (B) onset of cognitive decline in relation to age (left) and disease duration (right), per age at onset group; (C) survival in relation to age (left) and disease duration (right), per age at onset group; (D) survival (left) and loss of walking with or without support (right) in relation to disease duration, grouped by sex; (E) survival (left) and loss of walking with or without support (right) in relation to disease duration, grouped by disease course with and without episodic deterioration. In all plots, censored patients (absence of cognitive decline, still ambulant or alive at last follow‐up) are indicated by crosses.
Figure 4
Figure 4
Disease course in vanishing white matter patients as assessed by Health Utilities Index (HUI) Health Index scores. Graphs depict disease course in relation to age (A) and disease duration (B). One line represents 1 patient. Age at onset groups are marked by different colors. Scores range from −0.50 (dead) to 1 (perfectly healthy). Solid lines represent patients in whom ≥1 formal scores were obtained. Dotted lines represent patients in whom only baseline and death scores were available. In some patients, the score initially improves as a result of a better score at the first formal assessment compared to the standard baseline score.
Figure 5
Figure 5
Spider plots of selected Health Utilities Index (HUI) and Guy's Neurological Disability Scale (GNDS) scores in the early and late age at onset categories. Mean HUI single attribute scores and GNDS domain scores are shown for 3 different disease stages for early (<4 years, black lines) and late (≥18 years, orange lines) onset vanishing white matter. (A–C) HUI Health Index scores of ≥0.5 to 1.0 represent mild to no disability (A), scores of 0 to < 0.5 represent intermediate disability (B), and scores of −0.36 to 0 represent severe disability (C). HUI attribute scores range from 0.0 (most disabled) to 1.0 (normal status). (D–F) GNDS sum score <10 represents mild disability (D), score = 10 to <30 represents intermediate disability (E), and score ≥ 30 represents severe disability (F). GNDS domain scores range from 0 (normal status) to 5 (total loss of function). HUI attributes and GNDS domains in which the scores of the early and late age at onset categories are significantly different are indicated by *p < 0.05, **p < 0.01, and ***p < 0.001. In the plots of GNDS scores, the order of domains was based on the order of the items in the questionnaires. The order of the HUI domains was adapted to create analogy with the GNDS spider plots for overlapping items. For the HUI, a higher score is associated with better function, whereas for the GNDS a higher score is associated with worse function.
Figure 6
Figure 6
Individuals' Health Utilities Index Mark 3 (HUI3) Emotion scores in relation to their formal HUI Health Index scores, which range from −0.36 (most disabled state) to 1 (no handicap). 1 = happy and interested in life; 2 = somewhat happy; 3 = somewhat unhappy; 4 = very unhappy; 5 = so unhappy that life is not worthwhile.

Similar articles

Cited by

References

    1. Schiffmann R, Moller JR, Trapp BD, et al. Childhood ataxia with diffuse central nervous system hypomyelination. Ann Neurol 1994;35:331–340. - PubMed
    1. van der Knaap MS, Barth PG, Gabreels FJ, et al. A new leukoencephalopathy with vanishing white matter. Neurology 1997;48:845–855. - PubMed
    1. van der Knaap MS, Kamphorst W, Barth PG, et al. Phenotypic variation in leukoencephalopathy with vanishing white matter. Neurology 1998;51:540–547. - PubMed
    1. Bonkowsky JL, Nelson C, Kingston JL, et al. The burden of inherited leukodystrophies in children. Neurology 2010;75:718–725. - PMC - PubMed
    1. Leegwater PA, Vermeulen G, Konst AA, et al. Subunits of the translation initiation factor eIF2B are mutant in leukoencephalopathy with vanishing white matter. Nat Genet 2001;29:383–388. - PubMed

Publication types