

Neurofilament light: A candidate biomarker of presymptomatic amyotrophic lateral sclerosis and phenoconversion
- PMID: 30014505
- PMCID: PMC11348288
- DOI: 10.1002/ana.25276
Neurofilament light: A candidate biomarker of presymptomatic amyotrophic lateral sclerosis and phenoconversion
Abstract
Objective: To evaluate neurofilament light (NfL) as a biomarker of the presymptomatic phase of amyotrophic lateral sclerosis (ALS).
Methods: The study population includes 84 individuals at risk for developing ALS, 34 controls, 17 ALS patients, and 10 phenoconverters (at-risk individuals observed both before and after the emergence of clinically manifest disease). At-risk individuals are enrolled through Pre-Symptomatic Familial ALS (Pre-fALS), a longitudinal natural history and biomarker study of individuals who are carriers of any ALS-associated gene mutation (in SOD1, C9orf72, TARDBP, FUS, VCP, etc), but who, at the time of enrollment, demonstrated no clinical symptoms or signs (including electromyographic evidence) of manifest disease. NfL in serum and cerebrospinal fluid (CSF) were quantified using an electrochemiluminescence immunoassay.
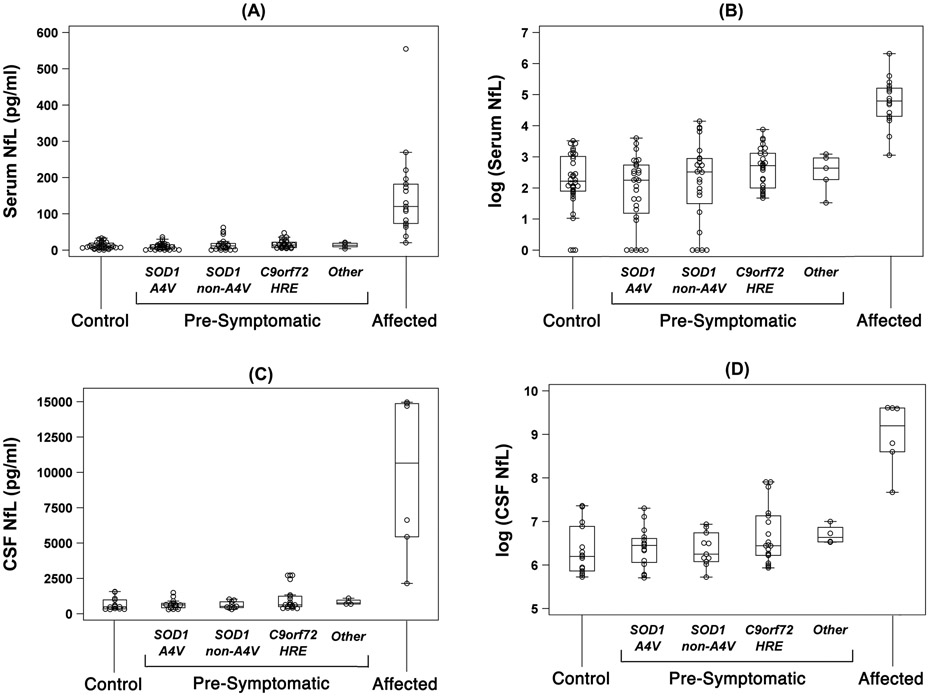
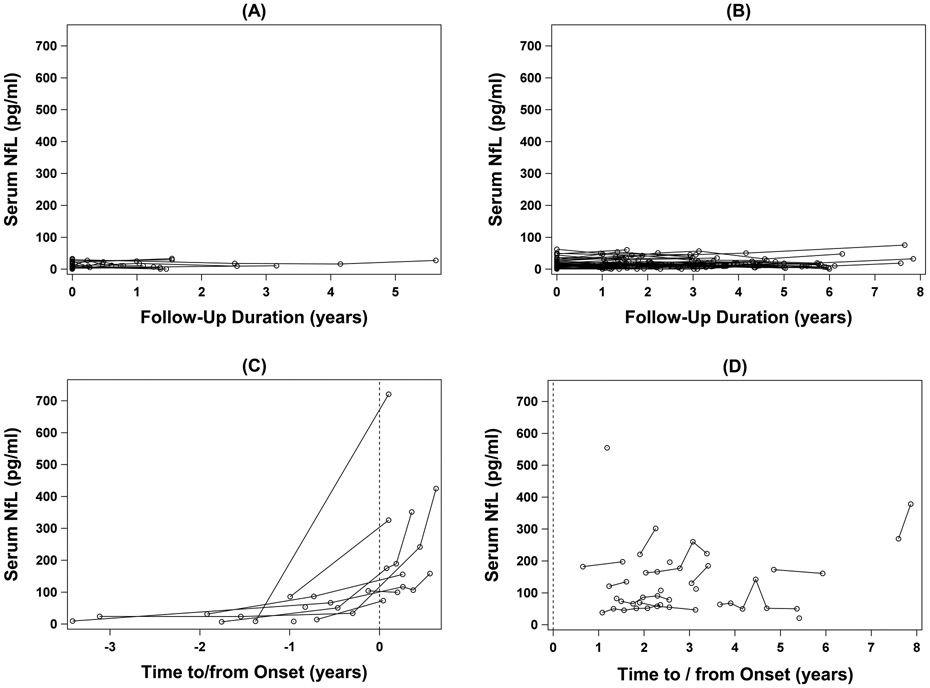
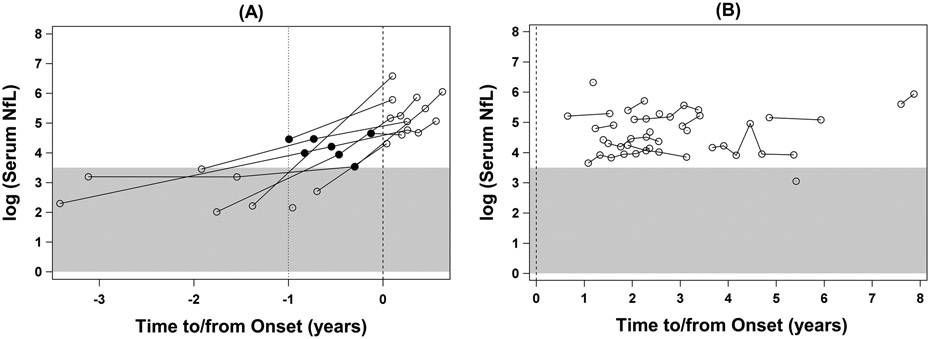
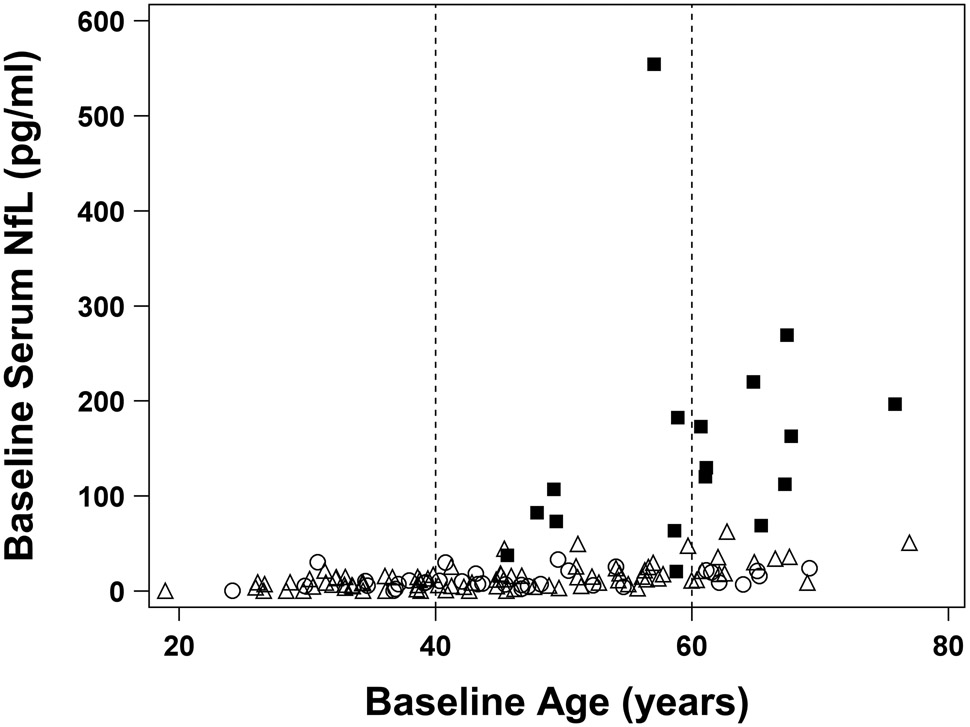
Results: Serum and CSF NfL are substantially higher in ALS patients compared to controls and at-risk individuals and remain relatively stable over time. Among phenoconverters, however, NfL levels were elevated (ie, above the range observed in controls) as far back as ∼12 months preceding the emergence of the earliest clinical symptoms or signs of disease.
Interpretation: Serum (and CSF) NfL are informative biomarkers of presymptomatic ALS, providing a new tool to quantify presymptomatic disease progression and to potentially predict the timing of clinical phenoconversion. As such, quantification of NfL may aid the design and implementation of early therapeutic intervention for affected individuals and/or disease prevention trials for individuals at short-term risk of developing ALS. Ann Neurol 2018 Ann Neurol 2018;83:130-139.
© 2018 American Neurological Association.
Conflict of interest statement
Potential Conflicts of Interest
Nothing to report.
Figures
References
-
- Benatar M. ALS therapy development: challenges and opportunities. J Neuromuscul Dis 2016;3:S10.
-
- Benatar M, Wuu J. The challenge of early therapeutic intervention in ALS. Amyotroph Lateral Scler Frontotemporal Degener 2014;15:5.
-
- Postuma RB, Gagnon JF, Montplaisir J. Clinical prediction of Parkinson’s disease: planning for the age of neuroprotection. J Neurol Neurosurg Psychiatry 2010;81:1008–1013. - PubMed
Publication types
MeSH terms
Substances
Grants and funding
LinkOut - more resources
Full Text Sources
Other Literature Sources
Medical
Research Materials
Miscellaneous
