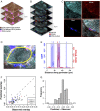
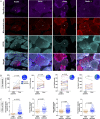
. 2018 Aug;84(2):289-301.
doi: 10.1002/ana.25288. Epub 2018 Aug 21.

Subcellular origin of mitochondrial DNA deletions in human skeletal muscle

Affiliations

Subcellular origin of mitochondrial DNA deletions in human skeletal muscle

Amy E Vincent et al. Ann Neurol. 2018 Aug.

Abstract

Objective: In patients with mitochondrial DNA (mtDNA) maintenance disorders and with aging, mtDNA deletions sporadically form and clonally expand within individual muscle fibers, causing respiratory chain deficiency. This study aimed to identify the sub-cellular origin and potential mechanisms underlying this process.

Methods: Serial skeletal muscle cryosections from patients with multiple mtDNA deletions were subjected to subcellular immunofluorescent, histochemical, and genetic analysis.

Results: We report respiratory chain-deficient perinuclear foci containing mtDNA deletions, which show local elevations of both mitochondrial mass and mtDNA copy number. These subcellular foci of respiratory chain deficiency are associated with a local increase in mitochondrial biogenesis and unfolded protein response signaling pathways. We also find that the commonly reported segmental pattern of mitochondrial deficiency is consistent with the three-dimensional organization of the human skeletal muscle mitochondrial network.

Interpretation: We propose that mtDNA deletions first exceed the biochemical threshold causing biochemical deficiency in focal regions adjacent to the myonuclei, and induce mitochondrial biogenesis before spreading across the muscle fiber. These subcellular resolution data provide new insights into the possible origin of mitochondrial respiratory chain deficiency in mitochondrial myopathy. Ann Neurol 2018;84:289-301.


Figures

Figure 1
Figure 1
Subcellular localization of respiratory chain dysfunction in human skeletal muscle. (A) Three skeletal muscle fibers in longitudinal orientation from a cryosection subjected to cytochrome c oxidase (COX, brown) and succinate dehydrogenase (SDH, blue) histochemistry to detect COX and SDH activity. The central fiber has segmental COX deficiency, indicative of segmental distribution of mtDNA defects. (B) Skeletal muscle fiber in cross‐sectional (ie, transverse) orientation that is fully deficient for COX activity and positive for SDH activity. (C) A focal region of COX deficiency in cross‐sectional orientation. (D) In longitudinal orientation, focal region of COX deficiency in a case of multiple mtDNA deletions. Note the restricted nature of COX deficiency consistent with a perinuclear region (dotted line) and the subsarcolemmal increase in SDH activity in an adjacent fully COX‐deficient fiber (arrowheads). (E) Summary of quantitative analysis of foci frequency in mtDNA maintenance disorders (n = 6). Count data for total, COX‐deficient SDH‐positive fibers (COX‐deficient fiber) and COX‐deficient foci are presented for each case followed by a percentage of fibers classified as COX‐deficient fiber, COX‐deficient foci, or other (COX‐positive or intermediate COX deficiency). Scale bars = 25 μm.
Figure 2
Figure 2
Foci distribution of cytochrome c oxidase (COX) deficiency and mitochondrial content by immunofluorescence in human muscle fibers. (A) Mitochondrial cytochrome c oxidase subunit I (MTCOI; green), succinate dehydrogenase (SDH) complex subunit A (SDHA) (red), and nuclei (blue) immunofluorescent labeling and quantification of a normal COX‐positive skeletal muscle fiber (Patient 7, POLG; left). Corresponding fluorescence intensity profile along the diameter denoted by the arrow (middle), and COX:SDH ratio (right). (B) Muscle fiber (Patient 7, POLG) with a niche of focal COX deficiency denoted by the red area denoted in the fluorescence intensity plots. (C) Muscle fiber (Patient 7, POLG) with segmental COX deficiency spread through approximately 70% of the cell's longest diameter. (D) Muscle fiber (Patient 7, POLG) with complete COX deficiency. All examples in A–D are from Patient 7 (POLG). (E) Quantification of mitochondrial content based on SDHA fluorescence intensity in COX‐deficient foci and in matched COX‐positive subsarcolemmal regions within individual muscle fibers. Data are combined from Patients 3 (RRM2B), 5 (POLG), and 7 (POLG). Data are plotted for each cell relative to COX‐positive areas (n = 74, 2‐tailed paired t test, p < 0.0001). (F) Correlation between SDHA and VDAC1 (porin) are plotted against each other for a sample of muscle fibers, the regression line has an r 2 = 0.644 and p < 0.0001. Scale bars = 25 µm.
Figure 3
Figure 3
Cytochrome c oxidase (COX)‐deficient foci contain high levels of mtDNA deletions and show compensatory increase in mtDNA copy number. Subcellular and single cell mtDNA analysis was performed on patients with mutations in POLG (n = 2), RRM2B (n = 2), and TWNK (n = 1; Patients 2–5 and 7). (A) Single muscle fiber before and after laser microdissection of 1 COX‐deficient and 2 COX‐positive (COX+) control subcellular regions. (B) ND4/ND1 ratio as an indicator of mtDNA deletion level in COX‐deficient foci with matched COX‐positive subcellular regions from single fibers (left) and mean deletion level ± standard error of the mean (SEM; right). (C) Total D‐Loop mtDNA copy number in COX‐deficient foci and matched COX‐positive subcellular regions from single fibers. mtDNA copy numbers are shown relative to COX‐positive regions of the same muscle fiber (left) and average copy number by group (right). Mean copy number ± SEM is shown (right). (D) The same as C but with ND1 as the copy number metric. (E) mtDNA ND4/ND1 ratio (left), total D‐Loop (center), and total ND1 (right) mtDNA copy number in COX‐deficient and COX‐positive whole fibers isolated by laser capture microdissection. A value of 0 indicates no ND4 deletion, whereas a value of 100 indicates all mtDNA molecules contain a ND4 deletion (left). Each datapoint corresponds to a single fiber. Bars indicate mean values. Matched subcellular regions in B–D are connected by a matched‐colored line. n = 27 fibers, 5 patients, 2‐tailed paired t tests.
Figure 4
Figure 4
Foci of cytochrome c oxidase (COX)‐deficient mitochondria are located in the subsarcolemmal region and colocalize with myonuclei. (A–C) Serial cryosections from Patient 7 with recessive POLG mutations (POLG), (A) reacted for sequential COX/succinate dehydrogenase (SDH) histochemistry and 4,6‐diamidino‐2‐phenylindole (DAPI) and (B) labeled by triple immunofluorescence for mitochondrial cytochrome c oxidase submit 1(MTCOI), SDH complex subunit A (SDHA), and DAPI. Note the focal area of COX deficiency in the outlined cell restricted to the middle section (red arrow), indicating that the focus is <8 µm in length. (C) Magnified area from B showing selective absence of MTCOI staining in the perinuclear niche area outlined. (D) An example muscle fiber from Patient 3 with recessive RRM2B mutations (RRM2B), analyzed using a perimeter line scan (yellow). Nuclei are indicated with numbers and the focal area of COX deficiency with a red arrow. The line scan goes from 0 to 160 µm. (E) Arbitrary fluorescence intensity for DAPI and SDHA minus MTCOI along the perimeter line scan from D. Shaded areas represent perinuclear areas (blue) and COX‐deficient focal area (red) used to compute the degree of overlap. Note that the COX‐deficient area overlaps with nucleus 3. The same analysis was applied to all foci. (F) Scatterplot comparing predicted and observed overlap of COX‐deficient areas and nuclei along the perimeters of muscle fibers with COX‐deficient foci. Data are from Patients 3 (RRM2B), 5 (POLG), and 7 (POLG), expressed as fractions of total muscle fiber perimeter length. Note the distribution of data toward the right of the dotted line, which represents chance level (observed = expected). (G) Frequency histogram of predicted − observed overlap fractions; n = 74, 1‐sample t test, p = 4.26e−15.
Figure 5
Figure 5
Activation of mitonuclear signaling pathways in response to subcellular cytochrome c oxidase (COX) deficiency. (A) Quadruple immunofluorescent imaging of mitonuclear signaling targets Hsp60 (Patient 7, POLG), GPS2 (Patient 5, POLG), transcription factor A, mitochondrial (TFAM; Patient 7, POLG), and Beclin1 (Patient 5, POLG) in combination with anti–mitochondrial cytochrome c oxidase subunit I (MTCOI), anti–succinate dehydrogenase complex subunit A (SDHA), or anti‐VDAC1 (for Hsp60) and 4,6‐diamidino‐2‐phenylindole. F indicates COX‐deficient foci, and dashed lines indicate the fiber boundaries. (B) Subcellular quantification of fluorescent intensity in COX‐deficient foci compared to COX‐positive areas of the same cell from Patient 3 (RRM2B), Patient 5 (POLG), and Patient 7 (POLG). Values from the same cell are connected by a line; n = 29 (Hsp60), n = 29 (GPS2), n = 30 (TFAM), and n = 16 (Beclin1); paired t test. Inset: Pie charts represent the percentage of foci that have an increase in signal relative to COX‐positive areas. ***p < 0.0001, Wilson/Brown binomial test comparing each percentage to the null hypothesis of 50:50. (C) Whole cell fluorescent intensity in full COX‐positive and COX‐deficient fibers from Patient 3 (RRM2B), Patient 5 (POLG), and Patient 7 (POLG). Each datapoint represents a muscle fiber; n = 175 (Hsp60), n = 101 (GPS2), n = 230 (TFAM), n = 112 (Beclin1); Mann–Whitney test. Data are from Patients 3 (RRM2B), 5 (POLG), and 7 (POLG).
Figure 6
Figure 6
Subcellular patterns of cytochrome c oxidase (COX) deficiency and preferential transverse mitochondrial network connectivity in human muscle. (A) Hypothetical models illustrating potential spread of COX‐deficient succinate dehydrogenase (SDH)‐positive foci. In the random spread model (top), biochemical deficiency covers an equal distance (x) in both transverse and longitudinal orientations. In the mitochondrial network model (bottom), COX negativity can cover the width of the muscle fiber, a distance (y) that is greater than the distance covered in the longitudinal axis of the fiber (z). Dotted green areas denote edges of biochemical deficiency. (B) Images of thin longitudinal regions of COX‐deficient segments in COX/SDH histochemistry, supporting the mitochondrial network model. (C) Schematic demonstrating differences in mitochondrial network connectivity when a muscle fiber is examined in transverse or longitudinal orientation. (D) Results from serial block face scanning electron microscopy showing that in the transverse orientation (green), mitochondria form an interconnected network. In the longitudinal orientation (blue), mitochondria appear round and isolated, with few connections across sarcomeres. Each continuous mitochondrion is pseudocolored and Z‐lines are marked by dotted lines. Scale bars for histochemistry (B) = 50 μm; scale bars for electron microscopy (D) = 1 μm.
Figure 7
Figure 7
Sub‐cellular foci identified in other neuromuscular diseases and aging from cytochrome c oxidase (COX)/succinate dehydrogenase (SDH) histochemistry. Focal COX‐deficient SDH‐positive region in cross‐section from cases of (A) single, large‐scale mtDNA deletion, (B) inclusion body myositis, (C) mechanically ventilated diaphragm, and (D) normal aging skeletal muscle. Scale bars = 25 μm.

References

    1. Gorman GS, Schaefer AM, Ng Y, et al. Prevalence of nuclear and mitochondrial DNA mutations related to adult mitochondrial disease. Ann Neurol 2015;77:753–759. - PMC - PubMed
    1. Viscomi C, Zeviani M. MtDNA‐maintenance defects: syndromes and genes. J Inherit Metab Dis 2017;40:587–599. - PMC - PubMed
    1. Campbell G, Krishnan KJ, Deschauer M, et al. Dissecting the mechanisms underlying the accumulation of mitochondrial DNA deletions in human skeletal muscle. Hum Mol Genet 2014;23:4612–4620. - PMC - PubMed
    1. de Grey AD. A proposed refinement of the mitochondrial free radical theory of aging. Bioessays 1997;19:161–166. - PubMed
    1. Elson JL, Samuels DC, Turnbull DM, Chinnery PF. Random intracellular drift explains the clonal expansion of mitochondrial DNA mutations with age. Am J Hum Genet 2001;68:802–806. - PMC - PubMed

Publication types

MeSH terms

Substances