. 2018 Sep:18:124-137.
doi: 10.1016/j.redox.2018.07.002. Epub 2018 Jul 5.

Polydatin prevents fructose-induced liver inflammation and lipid deposition through increasing miR-200a to regulate Keap1/Nrf2 pathway

Affiliations

Polydatin prevents fructose-induced liver inflammation and lipid deposition through increasing miR-200a to regulate Keap1/Nrf2 pathway

Xiao-Juan Zhao et al. Redox Biol. 2018 Sep.

Erratum in

Abstract

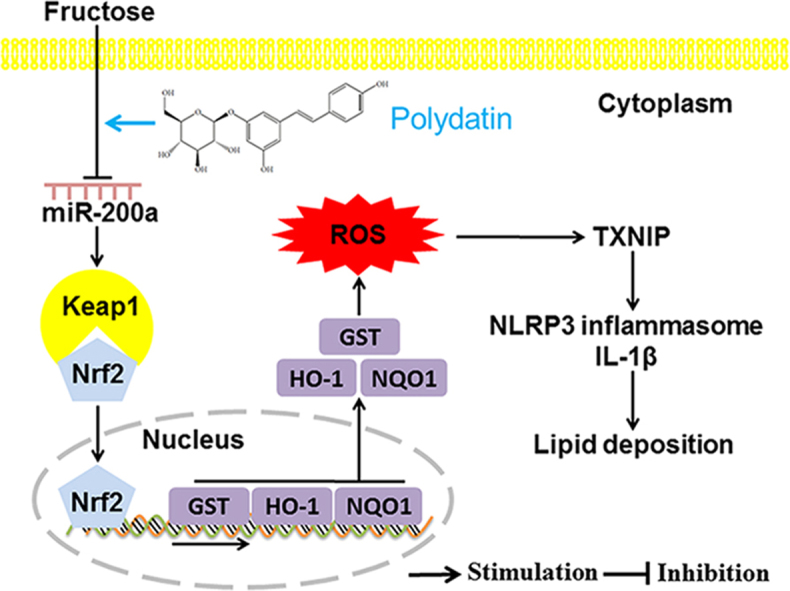
Oxidative stress is a critical factor in nonalcoholic fatty liver disease pathogenesis. MicroRNA-200a (miR-200a) is reported to target Kelch-like ECH-associated protein 1 (Keap1), which regulates nuclear factor erythroid 2-related factor 2 (Nrf2) anti-oxidant pathway. Polydatin (3,4',5-trihydroxy-stilbene-3-β-D-glucoside), a polyphenol found in the rhizome of Polygonum cuspidatum, have anti-oxidative, anti-inflammatory and anti-hyperlipidemic effects. However, whether miR-200a controls Keap1/Nrf2 pathway in fructose-induced liver inflammation and lipid deposition and the blockade of polydatin are still not clear. Here, we detected miR-200a down-regulation, Keap1 up-regulation, Nrf2 antioxidant pathway inactivation, ROS-driven thioredoxin-interacting protein (TXNIP) over-expression, NOD-like receptor (NLR) family, pyrin domain containing 3 (NLRP3) inflammasome activation and dysregulation of peroxisome proliferator activated receptor-α (PPAR-α), carnitine palmitoyl transferase-1 (CPT-1), sterol regulatory element binging protein 1 (SREBP-1) and stearoyl-CoA desaturase-1 (SCD-1) in rat livers, BRL-3A and HepG2 cells under high fructose induction. Furthermore, the data from the treatment or transfection of miR-200a minic, Keap1 and TXNIP siRNA, Nrf2 activator and ROS inhibitor demonstrated that fructose-induced miR-200a low-expression increased Keap1 to block Nrf2 antioxidant pathway, and then enhanced ROS-driven TXNIP to activate NLRP3 inflammasome and disturb lipid metabolism-related proteins, causing inflammation and lipid deposition in BRL-3A cells. We also found that polydatin up-regulated miR-200a to inhibit Keap1 and activate Nrf2 antioxidant pathway, resulting in attenuation of these disturbances in these animal and cell models. These findings provide a novel pathological mechanism of fructose-induced redox status imbalance and suggest that the enhancement of miR-200a to control Keap1/Nrf2 pathway by polydatin is a therapeutic strategy for fructose-associated liver inflammation and lipid deposition.

Keywords: Excess fructose intake; Keap1/Nrf2 pathway; Liver inflammation and lipid deposition; MiR-200a; Oxidative stress; Polydatin.


Figures

fx1
Graphical abstract
Fig. 1
Fig. 1
Polydatin alleviates liver inflammation and lipid deposition in fructose-fed rats. Rats were fed 10% fructose drinking water (wt/vl) for 13 weeks and treated with polydtain (7.5, 15, 30 mg/kg) and pioglitazone (4 mg/kg) during the last 7 weeks. (A) qRT-PCT analysis of TXNIP mRNA levels, and (B) Western blot analysis of TXNIP protein levels in rat livers (n = 4 at least). Relative mRNA levels of TXNIP were normalized to β-actin. Relative protein levels of TXNIP were normalized to GAPDH. (C) Representative microphotograph of H&E-stained and oil-red O-stained paraffin-embedded sections of liver tissues were shown (200 and 400× magnification; bars, 100 µm), respectively. (D) Western blot analysis of NLRP3, ASC, Caspase-1, IL-1β, PPAR-α, CPT-1, SREBP-1 and SCD-1 protein levels in rat livers (n = 4 at least). Relative protein levels of Caspase-1 were normalized to pro-Caspase-1, of IL-1β were normalized to pro-IL-1β, of TXNIP, NLRP3, ASC, PPAR-α, CPT-1, SREBP-1 and SCD-1 were normalized to GAPDH or β-actin, respectively. All data are expressed as mean ± S.E.M.. P value was calculated by one-way ANOVA and further post hoc Dannelt testing. #P < 0.05, ##P < 0.01, ###P < 0.001 compared with control-vehicle; *P < 0.05, **P < 0.01, ***P < 0.001 compared with fructose-vehicle. TXNIP, thioredoxin-interacting protein; NLRP3, The NOD-like receptor (NLR) family, pyrin domain containing 3; ASC, apoptosis-associated speck-like protein; IL-1β, interleukin-1β; PPAR-α, peroxisome proliferator activated receptor-α; CPT-1, carnitine palmitoyl transferase-1; SREBP-1, sterol regulatory element binging protein 1; SCD-1, stearoyl-CoA desaturase-1.
Fig. 2
Fig. 2
Polydatin reduces fructose-induced oxidative stress, inflammation and lipid accumulation in BRL-3A and HepG2 cells. BRL-3A and HepG2 cells were cultured with or without 5 mM fructose in the presence or absence of polydatin (10, 20 and 40 μM) or pioglitazone (10 μM), respectively. (A) ROS levels were analyzed by labeling fluorogenic probe DCFH2-DA (n = 8). (B, C) qRT-PCT analysis of TXNIP mRNA levels and Western blot analysis of TXNIP protein levels in BRL-3A and HepG2 cells (48 h) (n = 4 at least). Relative mRNA levels of TXNIP were normalized to β-actin. Relative protein levels of TXNIP were normalized to GAPDH. (D, E) Western blot analysis of NLRP3, ASC, Caspase-1, IL-1β, PPAR-α, CPT-1, SREBP-1 and SCD-1 protein levels in BRL-3A and HepG2 cells (48 h) (n = 4 at least). Relative protein levels of Caspase-1 were normalized to pro-Caspase-1, of IL-1β were normalized to pro-IL-1β, of TXNIP, NLRP3, ASC, PPAR-α, CPT-1, SREBP-1 and SCD-1 were normalized to GAPDH or β-actin, respectively. (F) IL-1β levels were detected by ELISA in the supernatant of BRL-3A and HepG2 cells (24 h) (n = 4 at least). (G) TG and TC levels were measured with standard diagnostic kits in BRL-3A and HepG2 cells (48 h) (n = 4 at least). All data are expressed as mean ± S.E.M.. P value was calculated by one-way ANOVA and further post hoc Dannelt testing. #P < 0.05, ##P < 0.01, ###P < 0.001 compared with control-vehicle; *P < 0.05, **P < 0.01, ***P < 0.001 compared with fructose-vehicle. ROS, reactive oxygen species.
Fig. 3
Fig. 3
Polydatin inhibits ROS/TXNIP to reduce inflammation and lipid deposition in fructose-exposed BRL-3A cells. (A) Western blot analysis of TXNIP protein levels in 5 mM NAC treated BRL-3A cells incubated with 5 mM fructose in the presence or absence of 40 μM polydatin or 10 μM pioglitazone (48 h) (n = 4 at least). Relative protein levels of TXNIP were normalized to GAPDH. (B) Assay of ROS levels (24 h, n = 7 at least), (C) Western blot analysis of NLRP3, ASC, Caspase-1, IL-1β, PPAR-α, CPT-1, SREBP-1 and SCD-1 protein levels (48 h) (n = 4 at least), and detection of TG (D) and TC (E) levels (48 h) (n = 4 at least) in TXNIP siRNA-transfected BRL-3A cells incubated with 5 mM fructose in the presence or absence of 40 μM polydatin or 10 μM pioglitazone. Relative protein levels of Caspase-1 were normalized to pro-Caspase-1, of IL-1β were normalized to pro-IL-1β, of TXNIP, NLRP3, ASC, PPAR-α, CPT-1, SREBP-1 and SCD-1 were normalized to GAPDH or β-actin, respectively. All data are expressed as mean ± S.E.M.. P value was calculated by one-way ANOVA and further post hoc Dannelt testing. #P < 0.05, ##P < 0.01, ###P < 0.001 compared with control-vehicle; *P < 0.05, **P < 0.01, ***P < 0.001 compared with fructose-vehicle. NAC, N-acetyl-L-cysteine.
Fig. 4
Fig. 4
Polydatin activates Nrf2 antioxidant pathway to inhibit oxidative stress in fructose-exposed BRL-3A and HepG2 cells. (A, B) Western blot analysis of total and nuclear Nrf2 protein levels in BRL-3A and HepG2 cells (24 h) (n = 4 at least). (C, D) Western blot analysis of GST, HO-1 and NQO1 protein levels in BRL-3A and HepG2 cells (24 h) (n = 4 at least). (E) Western blot analysis of nuclear Nrf2, GST, HO-1 and NQO1 protein levels (24 h) (n = 4 at least), (F) assay of ROS levels (24 h) (n = 5 at laest), (G) Western blot analysis of TXNIP protein levels (48 h) (n = 4 at least) in 10 μM tBHQ pretreated-BRL-3A cells for 8 h incubated with 5 mM fructose in the presence or absence of 40 μM polydatin or 10 μM pioglitazone, respectively. (H) Western blot analysis of nuclear Nrf2 protein levels in TXNIP siRNA-transfected BRL-3A cells incubated with 5 mM fructose in the presence or absence of 40 μM polydatin or 10 μM pioglitazone (24 h) (n = 4 at least). Relative protein levels of nuclear Nrf2 were normalized to LaminA, of total Nrf2, GST, HO-1 and NQO1 were normalized to GAPDH or β-actin, respectively. All data are expressed as mean ± S.E.M.. P value was calculated by one-way ANOVA and further post hoc Dannelt testing. #P < 0.05, ##P < 0.01, ###P < 0.001 compared with control-vehicle; *P < 0.05, **P < 0.01, ***P < 0.001 compared with fructose-vehicle. Nrf2, nuclear factor erythroid 2-related factor 2; GST, glutathione S-transferase; HO-1, hemeoxygenase-1; NQO1, NAD(P)H: quinone oxidoreductase 1.
Fig. 5
Fig. 5
Polydatin inhibits Keap1 to activate Nrf2 antioxidant pathway and inhibit oxidative stress in fructose-exposed BRL-3A and HepG2 cells. (A, B) qRT-PCT analysis of Keap1 mRNA levels and Western blot analysis of Keap1 protein levels in BRL-3A and HepG2 cells (24 h) (n = 4 at least). Relative mRNA levels of Keap1 were normalized to β-actin. (C) Western blot analysis of Keap1 protein levels (24 h) (n = 4 at least) in 10 μM tBHQ pretreated-BRL-3A cells for 8 h incubated with 5 mM fructose in the presence or absence of 40 μM polydatin or 10 μM pioglitazone. (D) Western blot analysis of nuclear Nrf2, GST, HO-1 and NQO1 protein levels (24 h) (n = 4 at least), (E) assay of ROS levels (24 h) (n = 6 at least) in 50 nM Keap1 siRNA transfected-BRL-3A cells incubated with 5 mM fructose in the presence or absence of 40 μM polydatin or 10 μM pioglitazone, respectively. Relative protein levels of nuclear Nrf2 were normalized to LaminA, of Keap1, total Nrf2, GST, HO-1 and NQO1 were normalized to GAPDH or β-actin, respectively. All data are expressed as mean ± S.E.M.. P value was calculated by one-way ANOVA and further post hoc Dannelt testing. #P < 0.05, ##P < 0.01, ###P < 0.001 compared with control-vehicle; *P < 0.05, **P < 0.01, ***P < 0.001 compared with fructose-vehicle. Keap1, Kelch-like ECH-associated protein 1.
Fig. 6
Fig. 6
Polydatin enhances miR-200a expression targeting Keap1 to activate Nrf2 antioxidant pathway in suppression of oxidative stress in fructose-exposed BRL-3A and HepG2 cells. (A) qRT-PCR analysis of miR-200a expression levels in BRL-3A (4 h) and HepG2 cells (12 h) (n = 4 at least). (B) Diagrams showed the miR-200a putative binding sites and corresponding mutant sites of Keap1. Dual-luciferase reporter assay of miR-200a with 3′UTR vectors (wild type or mutant) of rat keap1 in BRL-3A and HepG2 cells (n = 4 at least). (C) qRT-PCR analysis of miR-200a expression in 50 nM Keap1 siRNA transfected-BRL-3A cells incubated with 5 mM fructose in the presence or absence of 40 μM polydatin or 10 μM pioglitazone (4 h) (n = 4 at least). (D) Western blot analysis of Keap1, nuclear Nrf2, GST, HO-1 and NQO1 protein levels (24 h) (n = 4 at least), (E) assay of ROS levels (24 h) (n = 8) in 50 nM miR-200a mimic transfected-BRL-3A cells incubated with 5 mM fructose in the presence or absence of 40 μM polydatin or 10 μM pioglitazone, respectively. Relative miR-200a levels were normalized to U6. Relative protein levels of nuclear Nrf2 were normalized to LaminA, of Keap1, total Nrf2, GST, HO-1 and NQO1 were normalized to GAPDH or β-actin, respectively. All data are expressed as mean ± S.E.M.. P value was calculated by one-way ANOVA and further post hoc Dannelt testing. #P < 0.05, ##P < 0.01, ###P < 0.001 compared with control-vehicle; *P < 0.05, **P < 0.01, ***P < 0.001 compared with fructose-vehicle; &P < 0.05 compared with fructose-Keap1 siRNA. UTR, untranslated region.
Fig. 7
Fig. 7
Polydatin attenuates fructose feeding-induced miR-200a low-expression, Keap1 up-regulation and Nrf2 antioxidant pathway inactivation in rats with liver oxidative stress. (A) qRT-PCR analysis of miR-200a expression levels in rat livers. Relative miR-200a levels were normalized to U6. (B) qRT-PCT analysis of Keap1 mRNA levels and Western blot analysis of Keap1 protein levels in rat livers. Relative mRNA levels of Keap1 were normalized to β-actin. Western blot analysis of total Nrf2 and nuclear Nrf2 (C), GST, HO-1 and NQO1 protein levels (D) in rat livers. Relative protein levels of nuclear Nrf2 were normalized to LaminA, of Keap1, total Nrf2, GST, HO-1 and NQO1 were normalized to GAPDH or β-actin, respectively. All data are expressed as mean ± S.E.M. (n = 4 at least). P value was calculated by one-way ANOVA and further post hoc Dannelt testing. #P < 0.05, ##P < 0.01, ###P < 0.001 compared with control-vehicle; *P < 0.05, **P < 0.01, ***P < 0.001 compared with fructose-vehicle.
Fig. 8
Fig. 8
The hypothetical mechanisms by which polydatin prevents fructose-induced in liver inflammation and lipid deposition through increasing miR-200a to regulate Keap1/Nrf2 pathway. Fructose-induced miR-200a low-expression increased Keap1 to inhibit Nrf2 antioxidant pathway, and then caused ROS-driven TXNIP to promote NLRP3 inflammasome activation and lipid metabolism-related protein dysregulation, resulting in liver inflammation and lipid deposition. Polydatin protected fructose-induced liver inflammation and lipid deposition by which increased miR-200a expression to decrease Keap1 and activate Nrf2 antioxidant pathway, and then blocked ROS-driven TXNIP to suppress NLRP3 inflammasome activation and regulated lipid metabolism-related proteins.

References

    1. Vos M.B., Lavine J.E. Dietary fructose in nonalcoholic fatty liver disease. Hepatology. 2013;57:2525–2531. - PubMed
    1. Zhang X., Zhang J.H., Chen X.Y., Hu Q.H., Wang M.X., Jin R., Zhang Q.Y., Wang W., Wang R., Kang L.L., Li J.S., Li M., Pan Y., Huang J.J., Kong L.D. Reactive oxygen species-induced TXNIP drives fructose-mediated hepatic inflammation and lipid accumulation through NLRP3 inflammasome activation. Antioxid. Redox Signal. 2015;22:848–870. - PMC - PubMed
    1. Spahis S., Delvin E., Borys J.M., Levy E. Oxidative stress as a critical factor in nonalcoholic fatty liver disease pathogenesis. Antioxid. Redox Signal. 2017;26:519–541. - PubMed
    1. Sabouny R., Fraunberger E., Geoffrion M., Ng A.C., Baird S.D., Screaton R.A., Milne R., McBride H.M., Shutt T.E. The Keap1-Nrf2 stress response pathway promotes mitochondrial hyperfusion through degradation of the mitochondrial fission protein Drp1. Antioxid. Redox Signal. 2017;27:1447–1459. - PubMed
    1. Zhao Y., Song W., Wang Z., Wang Z., Jin X., Xu J., Bai L., Li Y., Cui J., Cai L. Resveratrol attenuates testicular apoptosis in type 1 diabetic mice: role of Akt-mediated Nrf2 activation and p62-dependent Keap1 degradation. Redox Biol. 2018;14:609–617. - PMC - PubMed

Publication types

MeSH terms