. 2018 Oct 1;128(10):4260-4279.
doi: 10.1172/JCI97117. Epub 2018 Jul 17.

Leukemogenic nucleophosmin mutation disrupts the transcription factor hub that regulates granulomonocytic fates

Affiliations

Leukemogenic nucleophosmin mutation disrupts the transcription factor hub that regulates granulomonocytic fates

Xiaorong Gu et al. J Clin Invest. .

Abstract

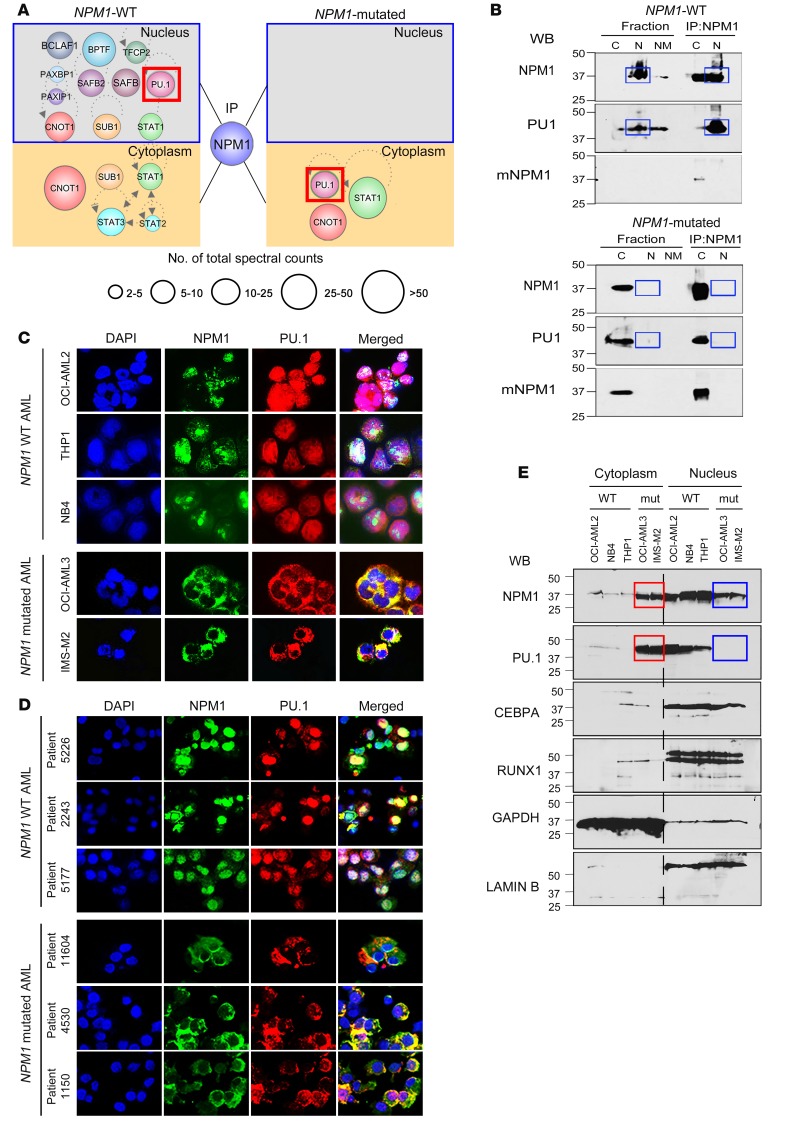
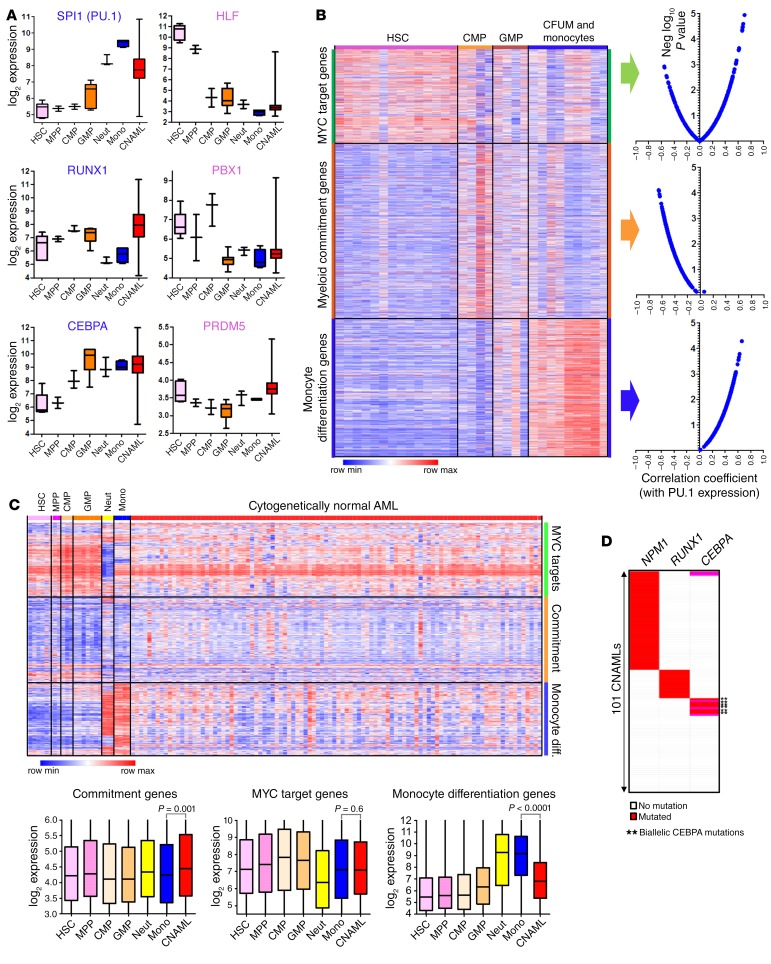
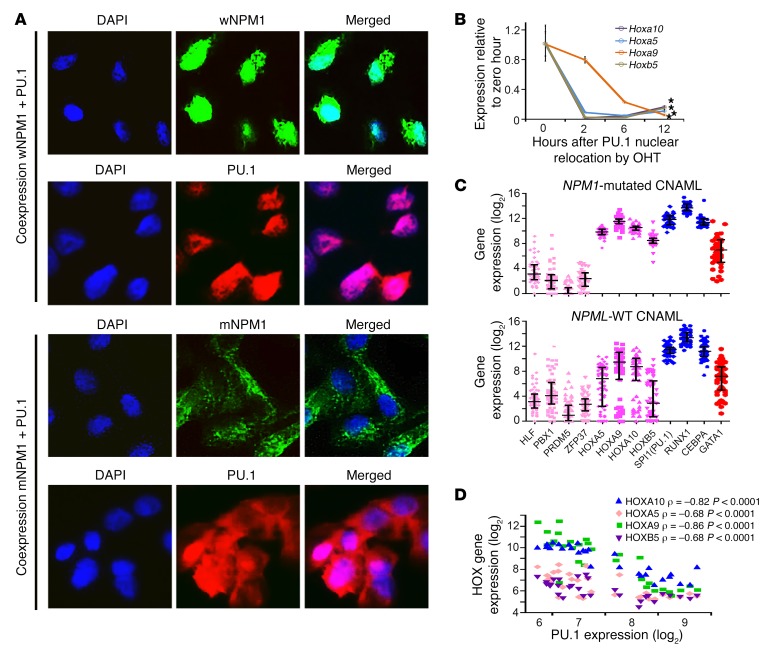
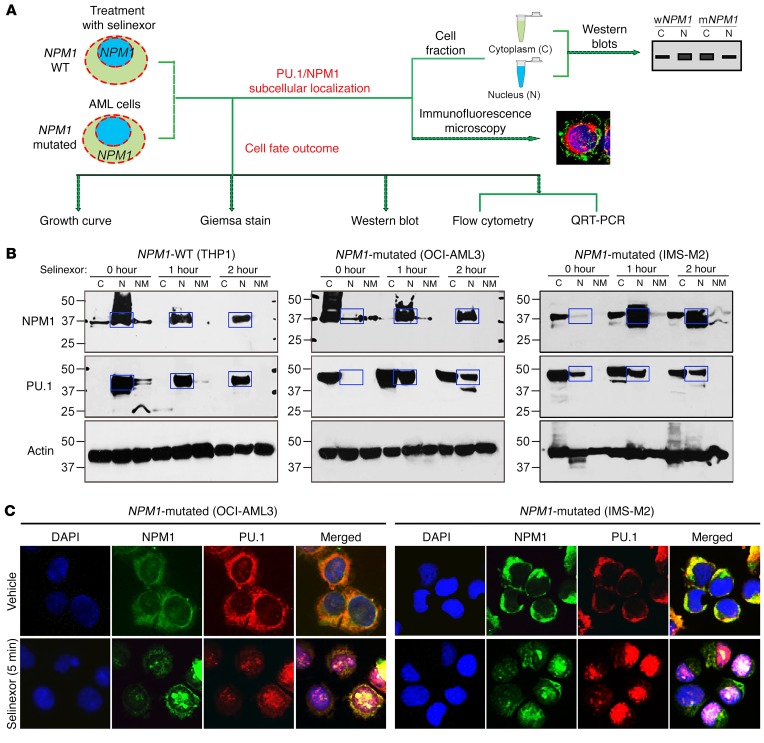
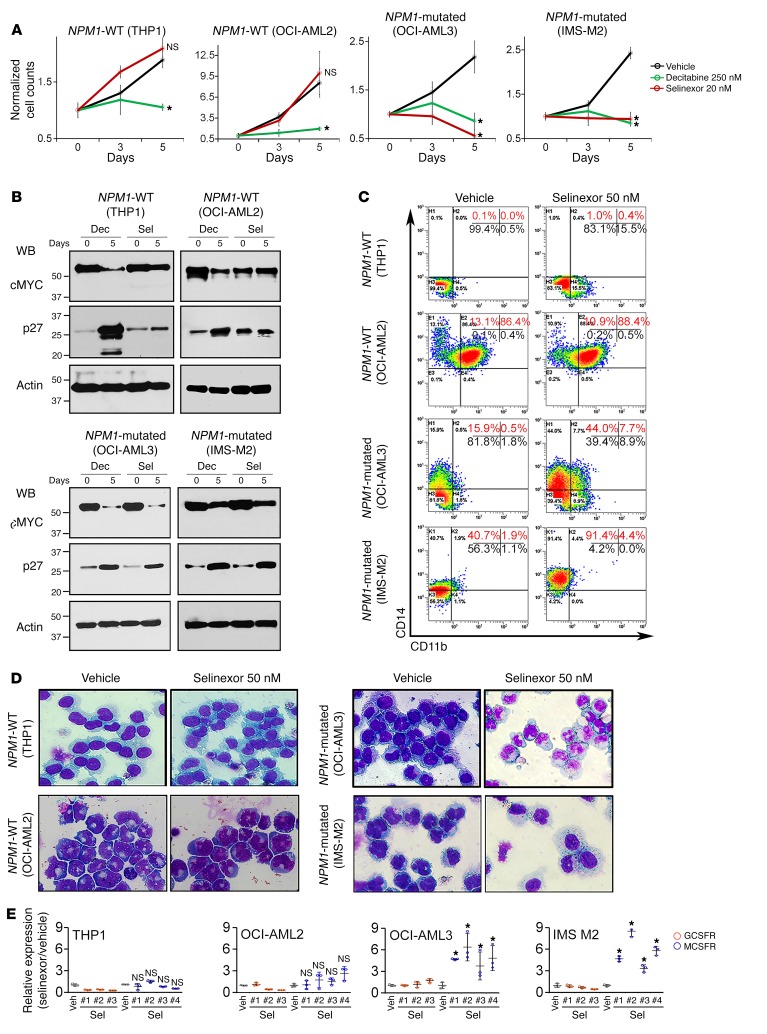
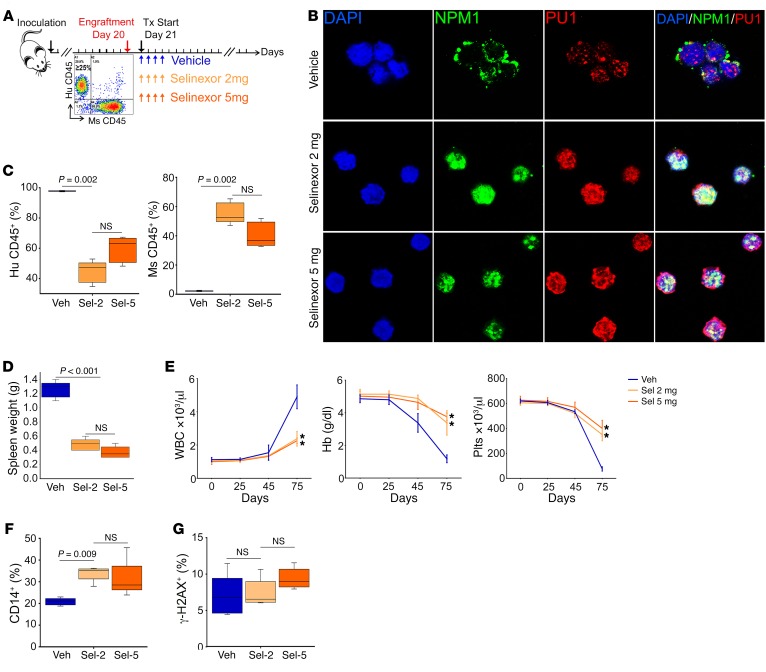
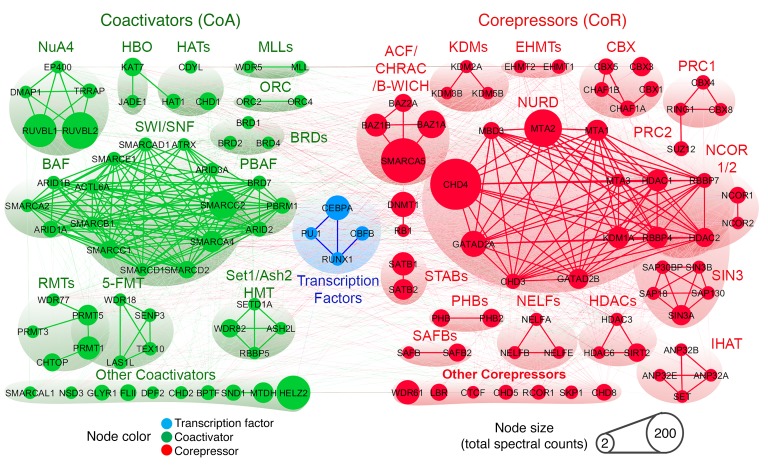
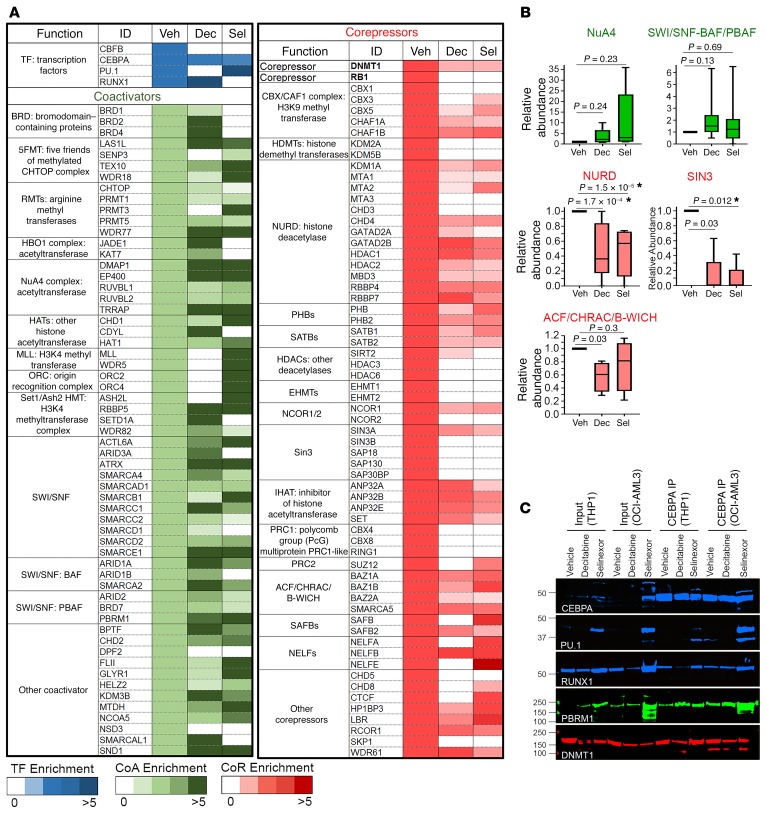
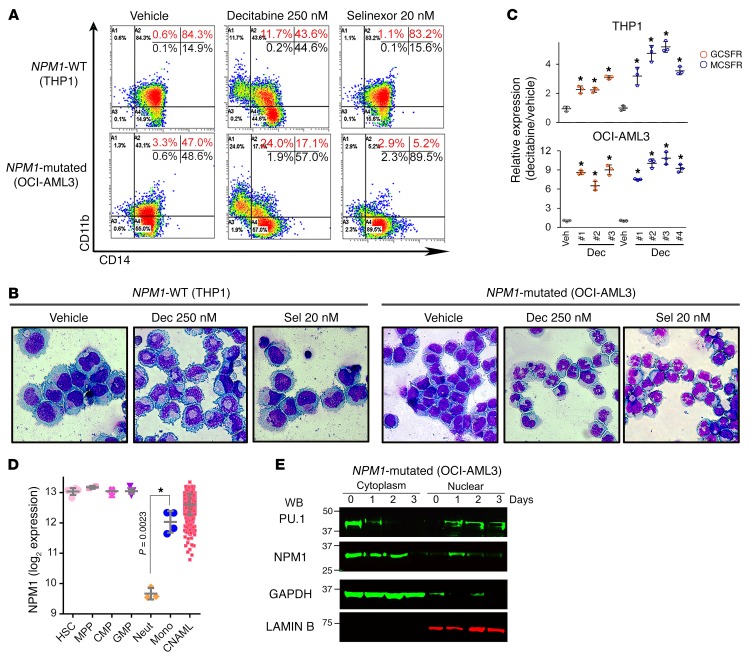
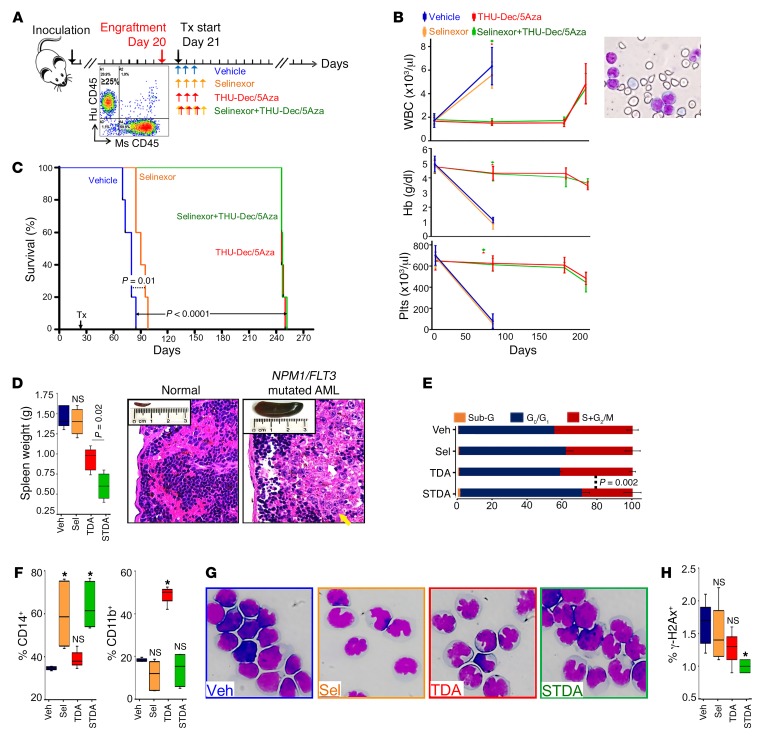
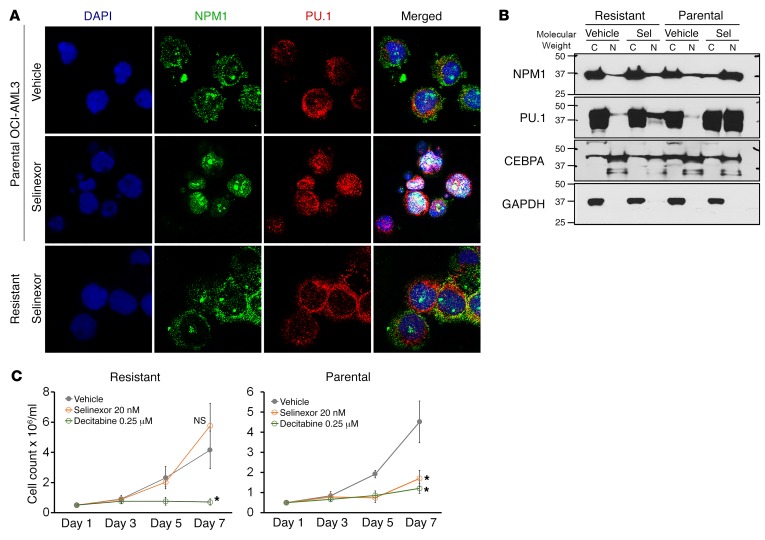
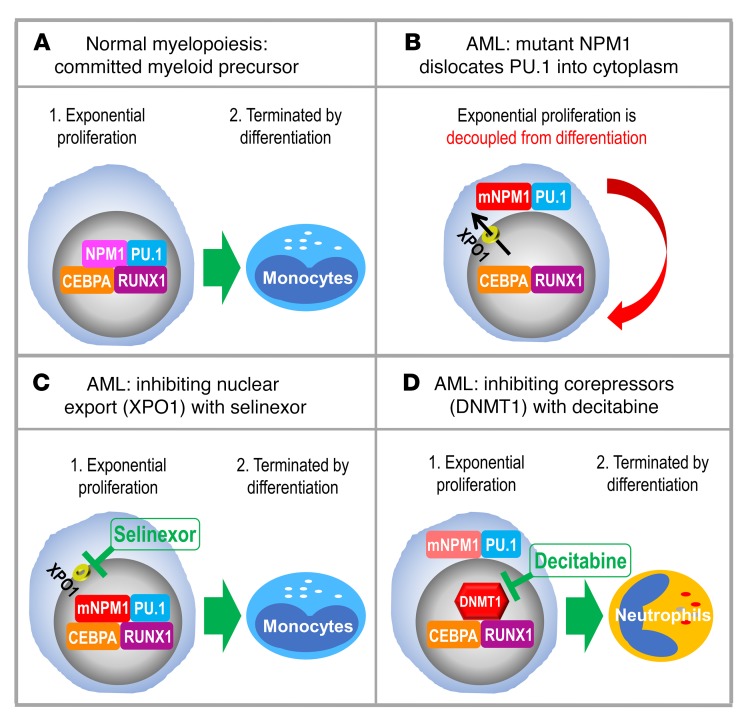
Nucleophosmin (NPM1) is among the most frequently mutated genes in acute myeloid leukemia (AML). It is not known, however, how the resulting oncoprotein mutant NPM1 is leukemogenic. To reveal the cellular machinery in which NPM1 participates in myeloid cells, we analyzed the endogenous NPM1 protein interactome by mass spectrometry and discovered abundant amounts of the master transcription factor driver of monocyte lineage differentiation PU.1 (also known as SPI1). Mutant NPM1, which aberrantly accumulates in cytoplasm, dislocated PU.1 into cytoplasm with it. CEBPA and RUNX1, the master transcription factors that collaborate with PU.1 to activate granulomonocytic lineage fates, remained nuclear; but without PU.1, their coregulator interactions were toggled from coactivators to corepressors, repressing instead of activating more than 500 granulocyte and monocyte terminal differentiation genes. An inhibitor of nuclear export, selinexor, by locking mutant NPM1/PU.1 in the nucleus, activated terminal monocytic fates. Direct depletion of the corepressor DNA methyltransferase 1 (DNMT1) from the CEBPA/RUNX1 protein interactome using the clinical drug decitabine activated terminal granulocytic fates. Together, these noncytotoxic treatments extended survival by more than 160 days versus vehicle in a patient-derived xenotransplant model of NPM1/FLT3-mutated AML. In sum, mutant NPM1 represses monocyte and granulocyte terminal differentiation by disrupting PU.1/CEBPA/RUNX1 collaboration, a transforming action that can be reversed by pharmacodynamically directed dosing of clinical small molecules.

Keywords: Epigenetics; Hematology; Leukemias; Oncology; Transport.


Conflict of interest statement

Conflict of interest: CA and YL have ownership in KaryoPharm and YS has ownership in EpiDestiny. CA and YL receive income from KaryoPharm. YS hold patents involving tetrahydrouridine, decitabine, and 5-azacytidine (US patents 9,259,469 B2; 9,265,785 B2; 9,895,391 B2).

Figures

Figure 1
Figure 1. The NPM1 interactome includes the master transcription factor PU.1, which is cytoplasmically dislocated along with mutant NPM1 in NPM1-mutated AML cells.
(A) Transcription factors pulled down with NPM1 and mutant NPM1 (mNMP1) from nuclear (N) and cytoplasmic (C) fractions of WT and NPM1-mutated (mut) AML cells. Endogenous NPM1 and mutant NPM1 were immunoprecipitated from nuclear and cytoplasmic fractions of WT (THP1) and NPM1-mutated AML cells (OCI-AML3), and protein interactions were analyzed by LC-MS/MS. Only interactome transcription factors are shown (additional data in Supplemental Table 1). Individual protein enrichment is presented as total spectral counts, a semiquantitative method for estimating the abundance of a specific protein in the coimmunoprecipitate; larger circle size indicates higher number of total spectral counts for the protein. (B) NPM1 and PU.1 interaction in nuclei of WT AML cells, and in cytoplasm of NPM1-mutated AML cells, was also evident by IP-WB. Blue boxes indicate expected locations of NPM1 and PU.1 if in nuclear fractions of NPM1-mutated AML cells. WB with mutant NPM1-specific antibody also shown. (C) IF for NPM1 and PU.1 in WT (OCI-AML2, THP1, NB4) and NPM1-mutated (OCI-AML3, IMS-M2) AML cell lines. Nuclei were stained with DAPI. Images by Nikon Eclipse 400 microscope; original magnification, ×630. Secondary antibody–alone controls are shown in Supplemental Figure 2. (D) IF for NPM1 and PU.1 in WT and NPM1-mutated AML primary cells from patients’ bone marrow. Images by Nikon Eclipse 400 microscope; original magnification, ×630. Secondary antibody–alone controls are shown in Supplemental Figure 2. (E) WB for PU.1, RUNX1, CEBPA, and NPM1 in nuclear and cytoplasmic fractions of WT and NPM1-mutated AML cell lines. Blue boxes indicate expected locations of NPM1 and PU.1 in nuclear fractions of NPM1-mutated AML cells; red boxes highlight location in cytoplasm of these cells instead.
Figure 2
Figure 2. AML cells highly express the PU.1/RUNX1/CEBPA master transcription factor circuit that drives cells to terminal granulomonocytic fates, but the monocyte differentiation program is suppressed.
(A) Expression of granulomonocytic (CEBPA, RUNX1, CEBPA) and HSC (HLF, PBX1, PRDM5) master transcription factors during normal myelopoiesis and in cytogenetically normal AML (CNAML). Gene expression data were integrated and normalized as previously described (48, 49). Boxes indicate median ± IQR, whiskers indicate range. HSCs, n = 6; multipotent progenitors (MPP), n = 2; CMPs, n = 3; GMPs, n = 7; neutrophils (Neut), n = 3; monocytes (Mono), n = 4; CNAML cells, n = 989. (B) Negative (Neg) correlation between myeloid commitment and PU.1 gene expression, but positive correlation between monocyte differentiation and PU.1 gene expression (Pearson’s correlation coefficients). Comparative Marker Selection (Morpheus) analysis of gene expression in HSCs, CMPs, GMPs, CFU monocytes (CFUM), and monocytes from GSE24759 (51) identified ~200 myeloid commitment and ~300 terminal monocytic differentiation genes. MYC target genes identified by others using ChIP-Seq (98), validated by separate analyses (Supplemental Figure 4). Also, Pu.1 localized at monocyte differentiation but not commitment genes by ChIP-Seq (Supplemental Figure 4). Gene sets were also validated in our separate gene expression database of normal hematopoiesis (Supplemental Figure 5). Gene lists are in Supplemental Tables 2–4. (C) CNAML expresses monocyte differentiation genes at levels higher than in normal HSCs, CMPs, or GMPs, but ~4-fold lower than seen in normal monocytes. 100 CNAML shown (truncated from 989 analyzed) (49). P values, 2-sided Mann-Whitney U test. (D) NPM1, RUNX1, and biallelic CEBPA mutations in CNAML cells are highly recurrent but mutually exclusive. n = 101 (analysis of data from The Cancer Genome Atlas [TCGA]).
Figure 3
Figure 3. Two models were used to show that mutant NPM1 dislocates PU.1 into cytoplasm, and that Pu.1 nuclear relocation in Pu.1-null myeloid precursors represses key precursor genes (e.g., Hoxa9) and activates terminal monocytic fates.
(A) Mutant NPM1, but not WT NPM1 (wNPM1), translocates PU.1 into cytoplasm. HEK293 cells were cotransfected with expression vectors for NPM1 and PU.1 or mutated NPM1 (exon 12 TCTG insertion) and PU.1. After staining with anti-NPM1 and anti-PU1 antibodies, IF was used to evaluate cellular location of NPM1 and PU.1. Images by Nikon Eclipse 400 microscope; original magnification, ×630. (B) Addition of estrogen (OHT) translocates Pu.1 into the nucleus in Pu.1–/– myeloid precursors retrovirally transduced to express Pu.1-ER (53), activating terminal monocytic fates (Supplemental Figure 7) and suppressing Hox gene expression. Hox gene expression measured by quantitative real-time PCR (QRT-PCR); mean ± SD, 3 independent experiments. *P < 0.01 (significant after Bonferroni’s correction), 2-sided t test, 12 hours versus 0 hours. (C) Master transcription factor and HOX gene expression in NPM1-mutated and WT AML cells. Gene expression by RNA-Seq, primary AML bone marrow cells (The Cancer Genome Atlas). (D) Negative correlation between HOX and PU.1 gene expression in normal myelopoiesis. Gene expression in normal hematopoietic hierarchy from GSE24759 (HSCs, n = 14; CMPs, n = 4; GMPs, n = 4; CFUM, n = 4; monocytes, n = 5) (51). Pearson’s correlation coefficients.
Figure 4
Figure 4. The nuclear export inhibitor selinexor sequestered both mutant NPM1 and PU.1 in nuclei of NPM1-mutated AML cells.
(A) Experiment schema. Cell fate outcomes are shown in Figure 5. (B) Selinexor rapidly relocalized mutant NPM1 and much of PU.1 into nuclei of NPM1-mutated AML cells. WT (THP1) and NPM1-mutated AML cells (OCI-AML3, IMS-M2) were treated with 20 nM selinexor and cell fractions (C, cytoplasm; N, nucleus; NM, nuclear matrix ) were evaluated by WB. Blue boxes show expected location of NPM1 and PU.1 in nuclear fractions. (C) IF for NPM1 and PU.1 in vehicle- versus selinexor-treated NPM1-mutated AML cells. DAPI was used to stain for nuclei. Images by Nikon Eclipse 400 microscope; original magnification, ×630.
Figure 5
Figure 5. Nuclear retention of mutant NPM1 and PU.1 by selinexor triggered terminal monocytic differentiation of NPM1-mutated, but not WT, AML cells.
(A) Cell counts of NPM1-mutated (OCI-AML3, IMS-M2) and NPM1-WT (OCI-AML2, THP1) AML cells. Decitabine was used to deplete DNMT1. Cell counts by automated counter. Mean ± SD of 3 independent experiments. *P < 0.01 (significant after Bonferroni’s correction), t test, 2-sided, selinexor or decitabine versus vehicle on day 5; NS, P > 0.025. (B) Protein levels of MYC (master transcription factor driver of proliferation) and p27/CDKN1B (cyclin-dependent kinase inhibitor mediating cell cycle exits by differentiation). WB. Dec, decitabine; Sel, selinexor. (C) Monocyte lineage marker CD14 and granulocyte lineage marker CD11b expression. Flow cytometry. (D) Cell morphology, day 5. Giemsa stain. Leica DMR microscope; original magnification, ×630. Quantified in Supplemental Figure 8. (E) MCSFR/CSF1R or GCSFR/CSF3R expression. QRT-PCR, multiple primer sets were used for each gene (#1–3/4). Mean ± SD 3 independent experiments. *P < 0.01 (significant after Bonferroni’s correction), 2-sided t test, selinexor versus vehicle (Veh); NS, P > 0.0125.
Figure 6
Figure 6. The differentiation-restoring effect of selinexor in vivo was saturated at a dose of 2 mg/kg.
2 mg/kg selinexor (Sel-2) was compared with 5 mg/kg (Sel-5) in a patient-derived xenotransplant model of dual NPM1/FLT3-mutated AML. (A) Experiment schema. After confirmation of bone marrow AML engraftment to ≥20% in 3 randomly selected mice, remaining mice were randomized to vehicle, 2 mg/kg selinexor, or 5 mg/kg selinexor, by oral gavage 4 times per week starting on day 21 (n = 5/group). Treatment (Tx) continued until appearance of signs of distress in vehicle-treated mice (day 75), when the experiment was terminated for analyses. *P < 0.01. (B) IF for PU.1 and NPM1 location in bone marrow AML cells. DAPI was used to stain for nuclei. Images by Leica SP8 inverted confocal microscope; original magnification, ×630. (C) Bone marrow AML burden. Flow cytometry for human (Hu) CD45+ (AML) and murine (Ms) CD45+ (normal) cells. Median ± IQR. P values, Mann-Whitney U test, 2-sided. Significance after Bonferroni’s correction was P < 0.025. (D) Spleen AML burden. Median ± IQR. P values, 2-sided Mann-Whitney U test. Normal NSG spleen weight is ~0.018 g. (E) Serial blood counts. Increasing WBC were circulating myeloblasts. Tail vein phlebotomy, blood counts by HemaVet. Mean ± SD. *P < 0.01 (significant after Bonferroni’s correction), Sel-2 or Sel-5 versus vehicle on day 75, 2-sided t test. (F) CD14 monocyte-lineage differentiation marker expression on bone marrow AML cells. Flow cytometry. Median ± IQR. P values, Mann-Whitney U test, 2-sided. Significance after Bonferroni’s correction was P < 0.025. (G) γ-H2AX apoptosis/DNA damage marker expression on bone marrow AML cells. Flow cytometry. Median ± IQR; P values, 2-sided Mann-Whitney U test (NS, P > 0.025). Hb, hemoglobin; Plts, platelets.
Figure 7
Figure 7. Coregulator interactions of nuclear CEBPA in NPM1-mutated AML cells.
Endogenous CEBPA was affinity purified from nuclear fractions of OCI-AML3 cells; coregulator (coactivator and corepressor) interactions were analyzed by LC-MS/MS and WB; and suggested CEBPA interactions in this context were biased toward corepressors. Quantification in Supplemental Table 6.
Figure 8
Figure 8. Impact of PU.1 nuclear retention by selinexor, or DNMT1 depletion by decitabine, on coregulator interactions of nuclear CEBPA in NPM1-mutated AML cells.
20 nM selinexor or 0.25 μM decitabine was added to OCI-AML3 cells at 0 and 24 hours, and cells were harvested at 48 hours. Endogenous CEBPA was affinity purified from nuclear fractions, and coregulator interactions were analyzed by LC-MS/MS and WB. Quantification in Supplemental Table 6. (A) Depletion of the corepressor DNMT1 by decitabine, or nuclear retention of PU.1 by selinexor, rebalanced toward coactivators. (B) Relative abundances of coregulator complexes with vehicle versus treatments. The individual proteins constituting the complexes are listed in A. Median ± IQR. *P < 0.0125 (significant after Bonferroni’s correction), Mann-Whitney U test, 2-sided. (C) CEBPA IP-WB to show coimmunoprecipitating master transcription factors (PU.1, RUNX1), a coactivator (PBRM1), and a corepressor (DNMT1). NPM1-mutated (OCI-AML3) and WT (THP1) AML cells.
Figure 9
Figure 9. Depletion of DNMT1 from the CEBPA/RUNX1 interactome by decitabine (0.25 μM/day, twice) induced granulocyte/monocyte differentiation, while PU.1 nuclear retention by selinexor (20 nM/day, 5 times) induced monocytic differentiation of NPM1-mutated AML cells (OCI-AML3).
THP1 cells are NPM1-WT AML cells with high nuclear content of both PU.1 and CEBPA. (A) Expression of the granulocyte lineage marker CD11b and the monocyte lineage marker CD14 in NPM1-mutated or WT AML cells treated with decitabine or selinexor. Flow cytometry on day 5. (B) Cell morphology, day 5. Giemsa stain. Leica DMR microscope; original magnification, ×630. Wider-field version shown in Supplemental Figure 8. (C) Expression of the GCSFR (CSF3R) and MCSFR. QRT-PCR, day 5. Mean ± SD; 3 independent experiments. Results with selinexor are shown in Figure 5. *P < 0.01 (significant after Bonferroni’s correction), Decitabine versus vehicle, 2-sided t test. (D) NPM1 mRNA expression during normal myelopoiesis. Gene expression data were integrated and normalized as previously described (48, 49). Mean ± SD; P value, 2-sided t test. (E) NPM1 decreased, and nuclear PU.1 increased, after decitabine treatment. Serial WBs of nuclear and cytoplasmic fractions of NPM1-mutated AML cells (OCI-AML3) after treatment with 250 nM decitabine on days 0 and 1 (additional data in Supplemental Figure 13).
Figure 10
Figure 10. Combination differentiation-restoring treatment in vivo.
(A) Experiment schema. Immunodeficient mice were xenotransplanted with NPM1/FLT3-mutated primary AML cells (55). After bone marrow engraftment to ≥20% AML was confirmed in 3 randomly selected mice, mice were randomly assigned to treatment with (i) vehicle; (ii) nuclear export inhibition — 2 mg/kg selinexor 4 times per week by oral gavage; (iii) DNMT1 depletion — 0.1 mg/kg decitabine, 3 times per week alternating with 1 mg/kg 5-azacytidine 3 times per week subcutaneously, combined with THU 10 mg/kg intraperitoneally (to inhibit in vivo degradation of decitabine/5-azacytidine (Dec/5Aza) by cytidine deaminase); or (iv) combination nuclear export inhibition/DNMT1 depletion. Mice were euthanized after appearance of signs of distress. (B) Serial blood counts. The increase in WBC was due to myeloblasts (right). Tail vein phlebotomy; blood counts by HemaVet. Mean ± SD. (C) Survival (time to distress). P values, log-rank test. (D) Spleen AML burden at euthanasia. Median ± IQR. NS, P > 0.01, 2-sided Mann-Whitney U test. Photos show a spleen from a normal NSG mouse versus a vehicle-treated mouse, with H&E-stained spleen sections showing AML infiltration (yellow arrow) and necrosis (white arrow) (original magnification, ×400). Normal NSG spleen weight is ~0.018 g. (E) Cell cycle distribution of marrow AML cells at euthanasia. Mean ± SD for percentage of cells in each cell cycle phase. P value, unpaired t test 2-sided. Raw data are shown in Supplemental Figure 14. (F) Monocyte (CD14) and granulocyte (CD11b) lineage differentiation marker expression in marrow AML cells at euthanasia. Flow cytometry. Median ± IQR. *P < 0.01 (significant after Bonferroni’s correction), NS, P > 0.01, Mann-Whitney U test, 2-sided. Raw data are shown in Supplemental Figures 15 and 16. (G) Morphology of marrow AML cells at euthanasia. Giemsa stain. Leica DMR microscope; original magnification, ×630. (H) Apoptosis/DNA damage marker γ-H2AX expression in marrow AML cells at euthanasia. Flow cytometry. Median ± IQR. *P < 0.01 (significant after Bonferroni’s correction), NS, P > 0.01, Mann-Whitney U test, 2-sided. Raw data including positive control are shown in Supplemental Figure 17. Veh, vehicle; Sel, selinexor; TDA, THU-Dec/5Aza; STDA, selinexor + THU-Dec/Aza.
Figure 11
Figure 11. Resistance is by avoidance of selinexor-induced nuclear relocation of mutant NPM1/PU.1. OCI-AML3 NPM1-mutated cells were selected for resistance to selinexor by culture in selinexor, with up to 50 nM added every 3 days.
(A) NPM1 and PU.1 localization in the resistant cells by IF. DAPI was used to stain for nuclei. Images by Leica SP8 inverted confocal microscope; magnification, ×630. (B) NPM1 and PU.1 cytoplasmic versus nuclear localization in the resistant cells. WB of nuclear and cytoplasmic fractions. (C) Parental and selinexor-resistant OCI-AML3 cells were sensitive to noncytotoxic concentrations of decitabine. Cell counts by automated counter. Mean ± SD for 3 independent experiments. *P < 0.01 (significant after Bonferroni’s correction), selinexor or decitabine versus vehicle on day 7, 2-sided t tests.
Figure 12
Figure 12. Summary.
(A) Master transcription factors PU.1/CEBPA/RUNX1 collaborate to recruit coactivators and activate granulomonocytic differentiation genes. (B) Cytoplasmic dislocation of PU.1 by mutant NPM1 disrupts the collaboration, causing corepressor recruitment to nuclear CEBPA/RUNX1 and repression instead of activation of differentiation genes. (C) Inhibiting nuclear export with selinexor retains mutant NPM1/PU.1 in nuclei and activates monocyte differentiation genes, as expected with a high nuclear PU.1/CEBPA ratio. (D) Inhibiting corepressors (e.g., DNMT1) recruited to nuclear CEBPA/RUNX1 activates granulocyte differentiation genes, as expected with a low nuclear PU.1/CEBPA ratio. The granulocytic direction of differentiation moreover naturally downregulates mutant NPM1 to promote eventual PU.1 nuclear retention.

References

    1. Falini B, et al. Cytoplasmic nucleophosmin in acute myelogenous leukemia with a normal karyotype. N Engl J Med. 2005;352(3):254–266. doi: 10.1056/NEJMoa041974. - DOI - PubMed
    1. Smith ML, Hills RK, Grimwade D. Independent prognostic variables in acute myeloid leukaemia. Blood Rev. 2011;25(1):39–51. doi: 10.1016/j.blre.2010.10.002. - DOI - PubMed
    1. How J, et al. The prognostic impact of FLT3-ITD and NPM1 mutations in patients with relapsed acute myeloid leukemia and intermediate-risk cytogenetics. Blood Cancer J. 2013;3:e116. - PMC - PubMed
    1. Grisendi S, et al. Role of nucleophosmin in embryonic development and tumorigenesis. Nature. 2005;437(7055):147–153. doi: 10.1038/nature03915. - DOI - PubMed
    1. Falini B, et al. Both carboxy-terminus NES motif and mutated tryptophan(s) are crucial for aberrant nuclear export of nucleophosmin leukemic mutants in NPMc+ AML. Blood. 2006;107(11):4514–4523. doi: 10.1182/blood-2005-11-4745. - DOI - PubMed

Publication types

MeSH terms