. 2018 Oct;42(4):2053-2061.
doi: 10.3892/ijmm.2018.3775. Epub 2018 Jul 12.

Effect of celastrol on toll‑like receptor 4‑mediated inflammatory response in free fatty acid‑induced HepG2 cells

Affiliations

Effect of celastrol on toll‑like receptor 4‑mediated inflammatory response in free fatty acid‑induced HepG2 cells

Li-Ping Han et al. Int J Mol Med. 2018 Oct.

Abstract

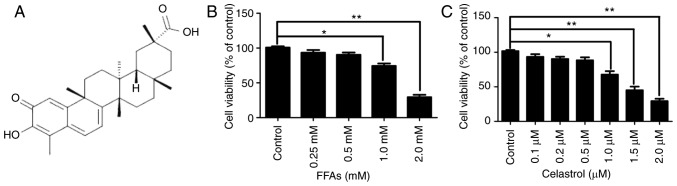
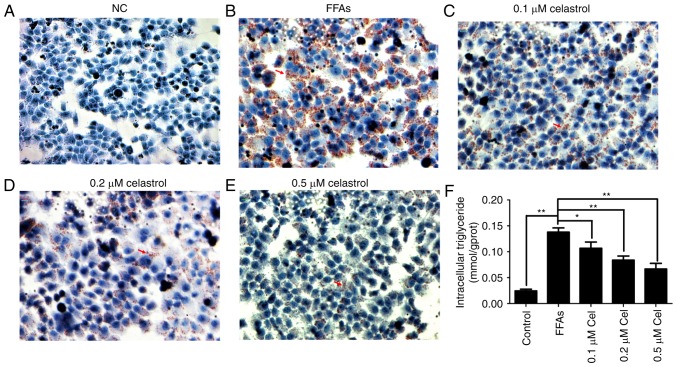
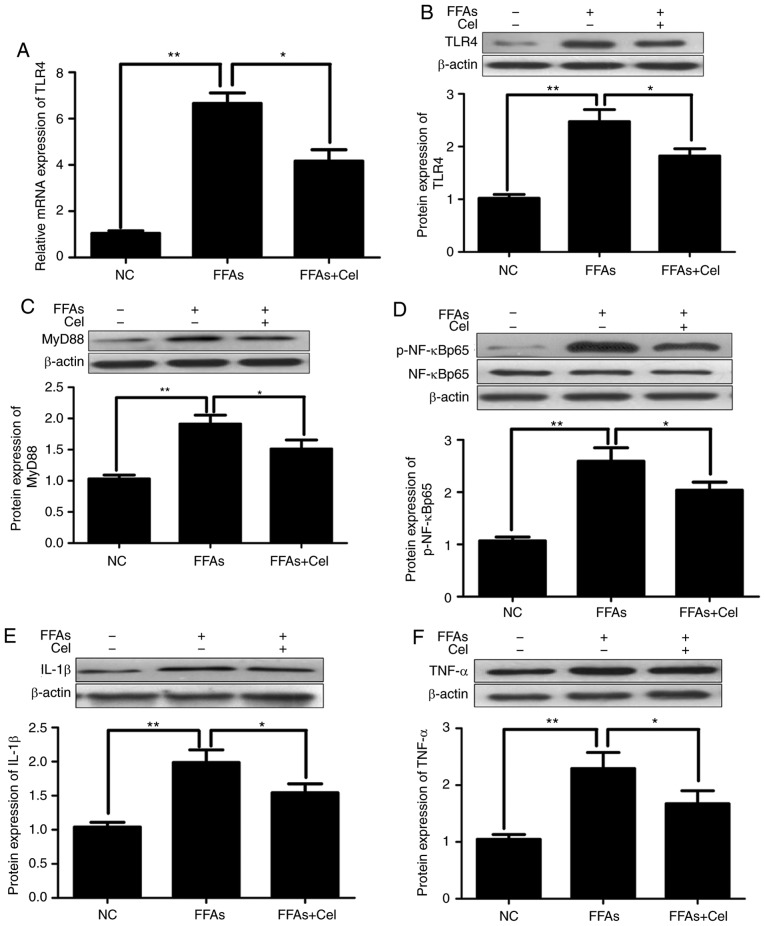
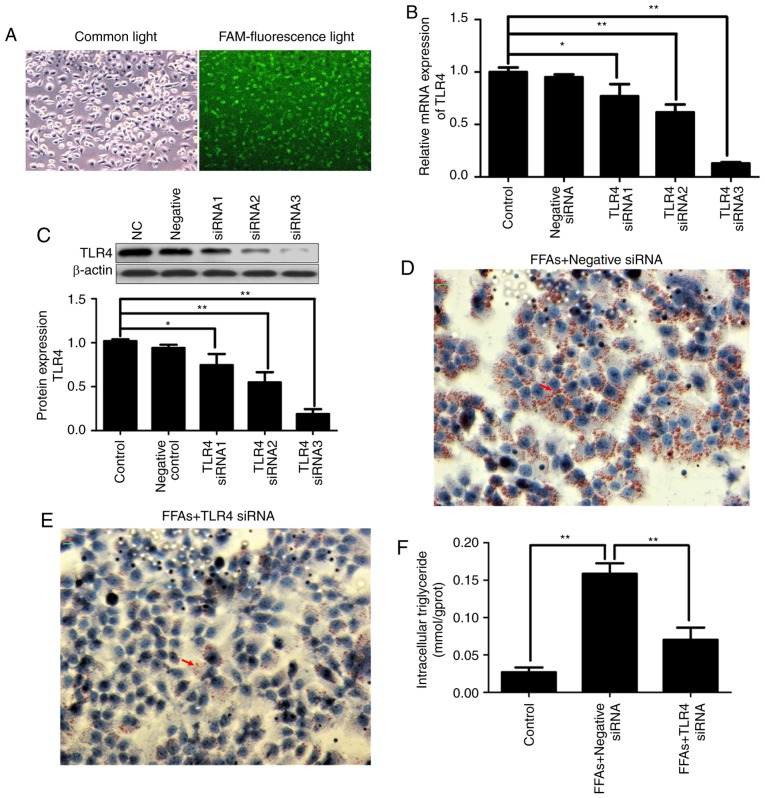
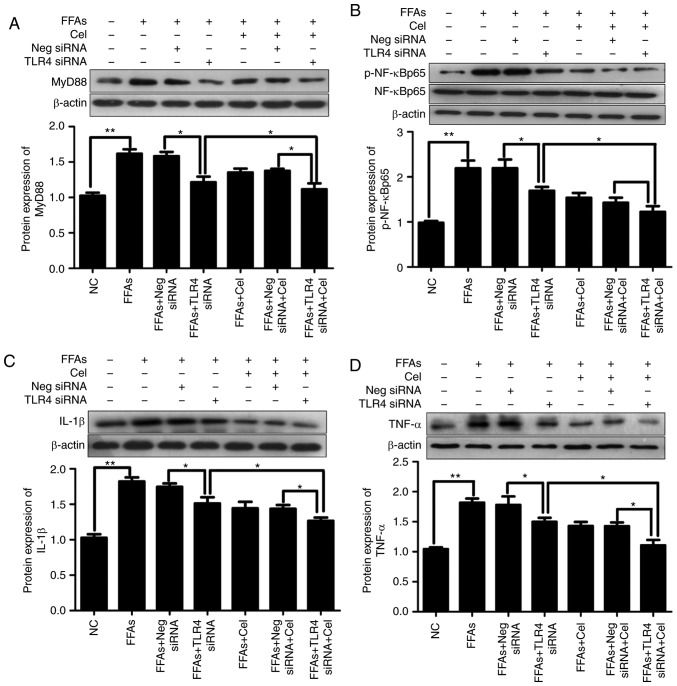
Toll‑like receptor 4 (TLR4)‑mediated immune and inflammatory signaling serves a pivotal role in the pathogenesis of nonalcoholic fatty liver disease (NAFLD). Our previous study demonstrated that celastrol treatment was able to improve hepatic steatosis and inhibit the TLR4 signaling cascade pathway in type 2 diabetic rats. The present study aimed to investigate the effects of celastrol on triglyceride accumulation and inflammation in steatotic HepG2 cells, and the possible mechanisms responsible for the regulation of cellular responses following TLR4 gene knockdown by small interfering RNA (siRNA) in vitro. A cell model of hepatic steatosis was prepared by exposing the HepG2 cells to free fatty acid (FFA) in the absence or presence of celastrol. Intracellular triglycerides were visualized by Oil red O staining, and the TLR4/myeloid differentiation primary response 88 (MyD88)/nuclear factor‑κB (NF‑κB) signaling cascade pathway were investigated. To directly elucidate whether TLR4 was the blocking target of celastrol upon FFA exposure, the cellular response to inflammation was determined upon transfection with TLR4 siRNA. The results revealed that celastrol significantly reduced triglyceride accumulation in the steatotic HepG2 cells, and downregulated the expression levels of TLR4, MyD88 and phospho‑NF‑κBp65, as well as of the downstream inflammatory cytokines interleukin‑1β and tumor necrosis factor α. Knockdown of TLR4 also alleviated FFA‑induced inflammatory response. In addition, co‑treatment with TLR4 siRNA and celastrol further attenuated the expression of inflammatory mediators. These results suggest that celastrol exerts its protective effect partly via inhibiting the TLR4‑mediated immune and inflammatory response in steatotic HepG2 cells.


Figures

Figure 1
Figure 1
Cytotoxic effects of FFA and celastrol in HepG2 cells. (A) Chemical structure of celastrol. In order to determine the optimal concentration for subsequent experiments, the cytotoxic effects of FFA (0.25, 0.5, 1.0 and 2.0 mM) and celastrol (0.1, 0.2, 0.5, 1.0, 1.5 and 2.0 μM) in HepG2 cells were investigated. HepG2 cells were incubated with the indicated concentrations of (B) FFA and (C) celastrol for 24 h, and cell viability was measured by the Cell Counting Kit-8 assay. Data are expressed as the mean ± standard error of the mean (n=6). *P<0.05 and **P<0.01. FFA, free fatty acid.
Figure 2
Figure 2
Effects of celastrol on triglyceride accumulation in the FFA-induced HepG2 cells. A cell model of hepatic steatosis was prepared by exposing HepG2 cells to 0.5 mM FFA and then incubating with 0.1, 0.2 and 0.5 μM celastrol for 24 h. Oil red O staining is shown in the (A) normal control, (B) 0.5 mM FFA, (C) 0.5 mM FFA + 0.1 μM celastrol, (D) 0.5 mM FFA + 0.2 μM celastrol and (E) 0.5 mM FFA + 0.5 μM celastrol groups (magnification, x400). Red arrows indicate lipid droplets. (F) Levels of intracellular triglycerides were analyzed by an enzymatic assay. Data are shown as the mean ± standard error of the mean (n=6). *P<0.05 and **P<0.01. FFA, free fatty acid.
Figure 3
Figure 3
Celastrol administration downregulated TLR4 and downstream signaling factors in the FFA-induced HepG2 cells. HepG2 cells were cultured with 0.5 μM celastrol and 0.5 mM FFA for 24 h, and the transcripts and protein expression levels of inflammatory mediators were analyzed by reverse transcription-quantitative polymerase chain reaction and western blotting. (A) Relative mRNA and (B) protein expression levels of TLR4. Relative protein expression levels of (C) MyD88, (D) phospho-NF-κBp65 and total NF-κBp65 (p-NF-κBp65 levels were normalized to total NF-κBp65 levels), (E) IL-1β, and (F) TNFα were assayed by western blotting. Data are expressed as the mean ± standard error of the mean (n=6). *P<0.05 and **P<0.01. FFA, free fatty acid; TLR4, toll-like receptor 4; MyD88, myeloid differentiation primary response 88; NF-κB, nuclear factor-κB; IL-1β, interleukin 1β; TNFα, tumor necrosis factor α.
Figure 4
Figure 4
Effects of transfection with TLR4 siRNA in the HepG2 cells. In order to select the most effective TLR4 siRNA sequences, three FAM-labeled TLR4 siRNA constructs were transiently transfected into HepG2 cells using Lipofectamine® 2000. After 24 h of transfection, the transfection efficiency was tested by a FAM-siRNA under a fluorescence microscope (magnification, x200). (A) Visualization of the cells under common light and FAM-fluorescence light. The fluorescent particles within the cells indicated that siRNA was transfected successfully into the HepG2 cells. (B) Relative mRNA and (C) relative protein expression levels of TLR4 were analyzed by reverse transcription-quantitative polymerase chain and western blotting, respectively. (D) FFA + negative control siRNA and (E) TLR4 siRNA-treated HepG2 cells stained by Oil red O (magnification, x400). Red arrows indicate lipid droplets. (F) Levels of intracellular triglycerides were analyzed by an enzymatic assay. Data are expressed as the mean ± standard error of the mean (n=6). *P<0.05 and **P<0.01. FFA, free fatty acid; TLR4, toll-like receptor 4; siRNA, small interfering RNA; FAM, fluorescein amidite.
Figure 5
Figure 5
Effects of celastrol and TLR4 siRNA on the TLR4 signaling cascade pathway in the FFA-induced HepG2 cells. In order to understand the relative mechanisms of celastrol on ameliorating inflammatory response in the steatotic HepG2 cells, the expression levels of downstream inflammatory mediators following exposure to BSA, 0.5 mM FFA, or a mixture of FFA and 0.5 μM celastrol for 24 h in HepG2 cells transfected with negative control siRNA or TLR4 siRNA were investigated. Relative protein expression levels of (A) MyD88, (B) phospho-NF-κBp65 and total NF-κBp65 (p-NF-κBp65 was normalized to total NF-κBp65 level), (C) IL-1β and (D) TNFα were analyzed by western blotting. Data are expressed as the mean ± standard error of the mean (n=6). *P<0.05 and **P<0.01. FFA, free fatty acid; TLR4, toll-like receptor 4; siRNA, small interfering RNA; MyD88, myeloid differentiation primary response 88; NF-κB, nuclear factor-κB; IL-1β, interleukin 1β; TNFα, tumor necrosis factor α.

References

    1. Arrese M, Cabrera D, Kalergis AM, Feldstein AE. Innate immunity and inflammation in NAFLD/NASH. Dig Dis Sci. 2016;61:1294–1303. doi: 10.1007/s10620-016-4049-x. - DOI - PMC - PubMed
    1. Tiniakos DG, Vos MB, Brunt EM. Nonalcoholic fatty liver disease: Pathology and pathogenesis. Annu Rev Pathol. 2010;5:145–171. doi: 10.1146/annurev-pathol-121808-102132. - DOI - PubMed
    1. Huang S, Rutkowsky JM, Snodgrass RG, Ono-Moore KD, Schneider DA, Newman JW, Adams SH, Hwang DH. Saturated fatty acids activate TLR-mediated proinflmmatory signaling pathways. J Lipid Res. 2012;53:2002–2013. doi: 10.1194/jlr.D029546. - DOI - PMC - PubMed
    1. Ganz M, Szabo G. Immune and inflammatory pathways in NASH. Hepatol Int. 2013;7(Suppl 2):S771–S781. doi: 10.1007/s12072-013-9468-6. - DOI - PMC - PubMed
    1. Petrasek J, Csak T, Szabo G. Toll-like receptors in liver disease. Adv Clin Chem. 2013;59:155–201. doi: 10.1016/B978-0-12-405211-6.00006-1. - DOI - PubMed

MeSH terms