. 2018 Aug 21;46(14):7221-7235.
doi: 10.1093/nar/gky388.

Cis-regulatory determinants of MyoD function

Affiliations

Cis-regulatory determinants of MyoD function

Vahab D Soleimani et al. Nucleic Acids Res. .

Abstract

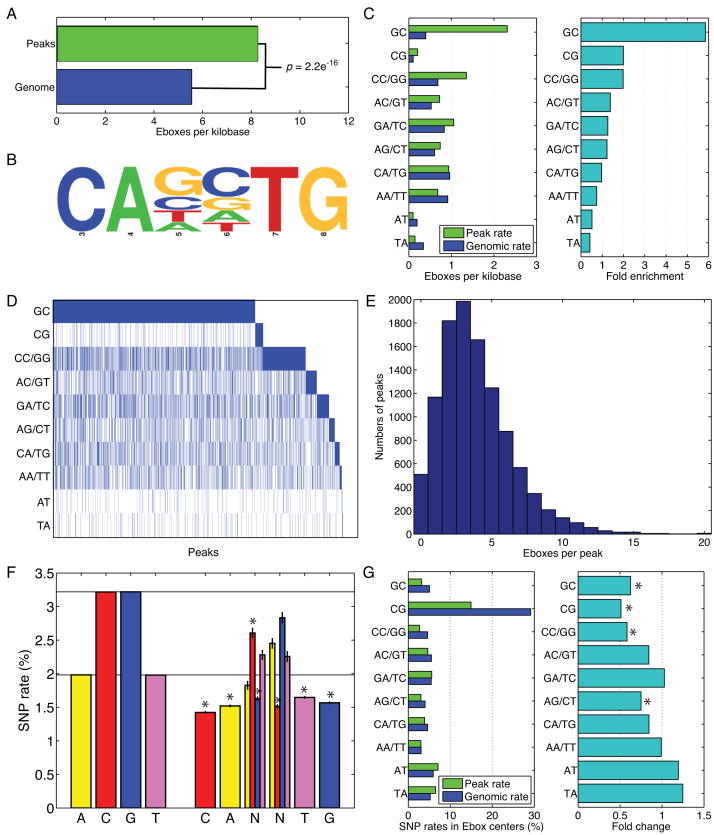
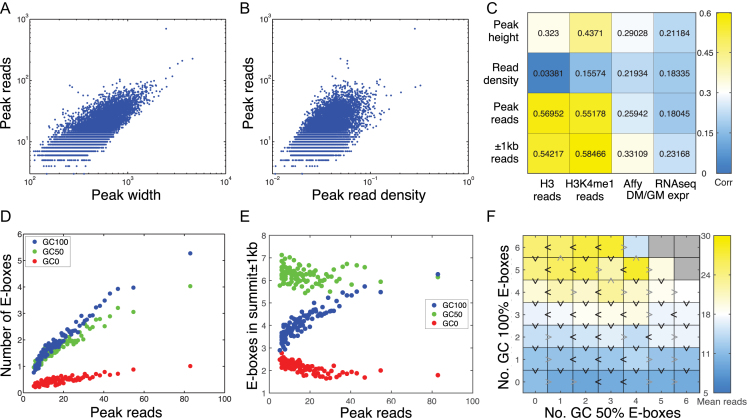
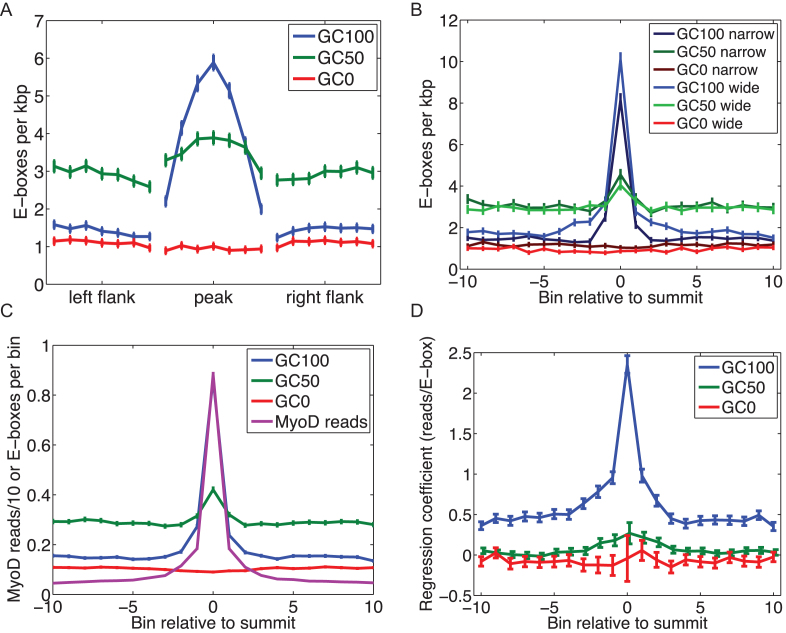
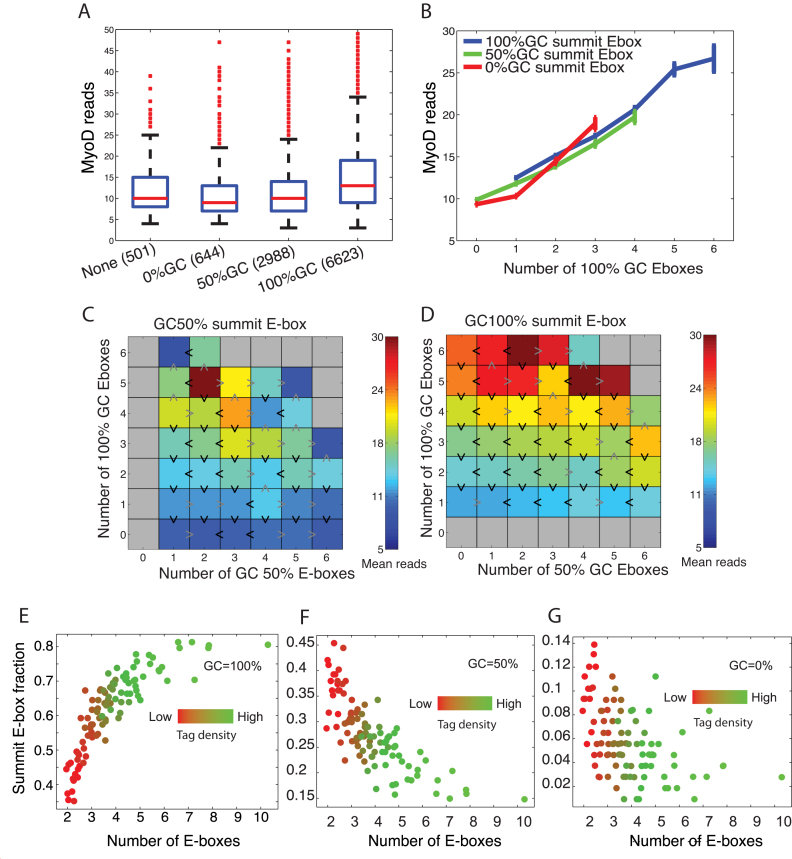
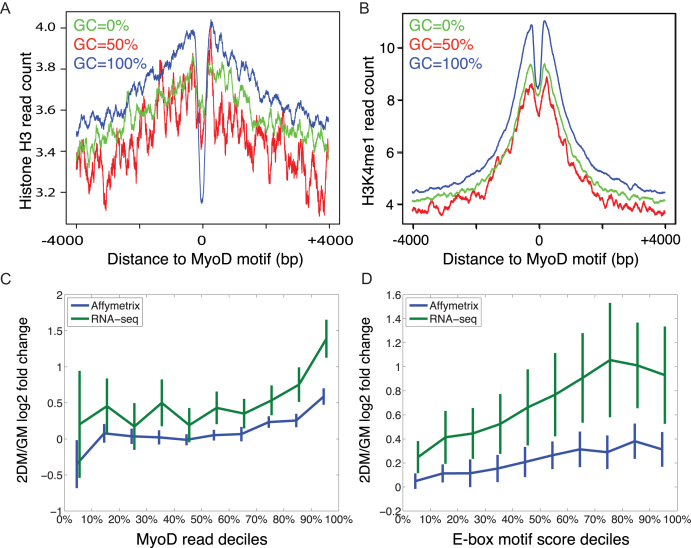
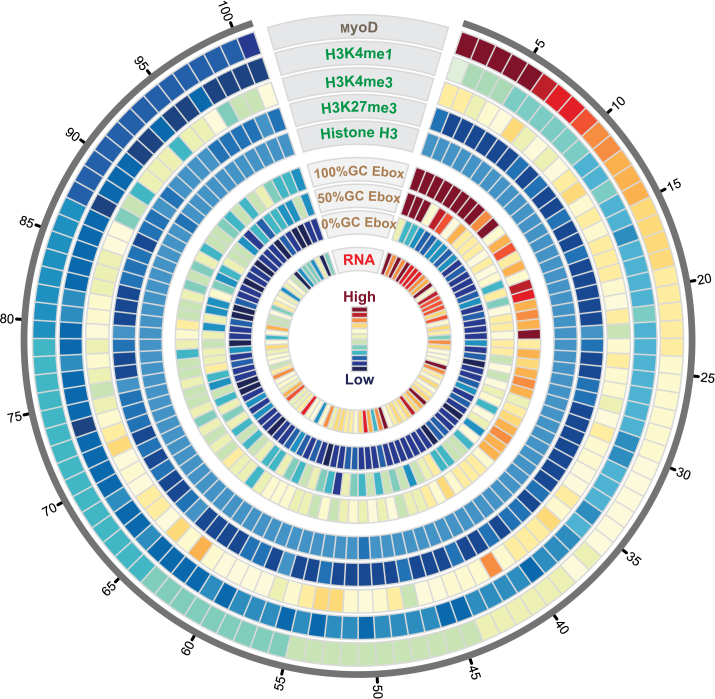
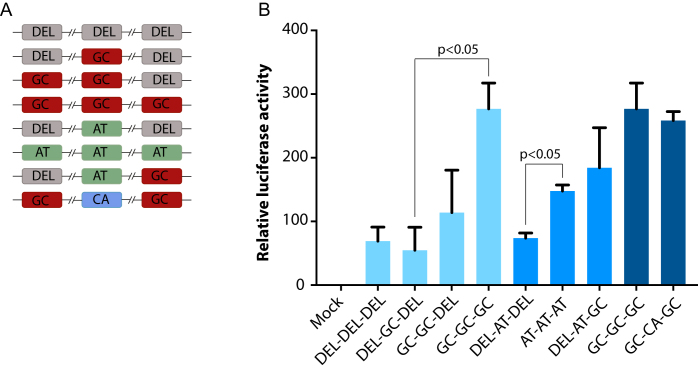
Muscle-specific transcription factor MyoD orchestrates the myogenic gene expression program by binding to short DNA motifs called E-boxes within myogenic cis-regulatory elements (CREs). Genome-wide analyses of MyoD cistrome by chromatin immnunoprecipitation sequencing shows that MyoD-bound CREs contain multiple E-boxes of various sequences. However, how E-box numbers, sequences and their spatial arrangement within CREs collectively regulate the binding affinity and transcriptional activity of MyoD remain largely unknown. Here, by an integrative analysis of MyoD cistrome combined with genome-wide analysis of key regulatory histones and gene expression data we show that the affinity landscape of MyoD is driven by multiple E-boxes, and that the overall binding affinity-and associated nucleosome positioning and epigenetic features of the CREs-crucially depend on the variant sequences and positioning of the E-boxes within the CREs. By comparative genomic analysis of single nucleotide polymorphism (SNPs) across publicly available data from 17 strains of laboratory mice, we show that variant sequences within the MyoD-bound motifs, but not their genome-wide counterparts, are under selection. At last, we show that the quantitative regulatory effect of MyoD binding on the nearby genes can, in part, be predicted by the motif composition of the CREs to which it binds. Taken together, our data suggest that motif numbers, sequences and their spatial arrangement within the myogenic CREs are important determinants of the cis-regulatory code of myogenic CREs.


Figures

Figure 1.
Figure 1.
E-box preferences of MyoD peaks (A) E-boxes are significantly enriched in MyoD peaks at ∼1.5-fold over genomic levels. (B) Consensus logo of all E-boxes in MyoD peaks shows the hexa-nucleotide sequence with a variable dinucleotide and two flanking invariable dinucleotide. (C) Frequencies of E-boxes with different center dinucleotide in MyoD peaks versus the genome as a whole show very strong enrichment for the GC dinucleotide, moderate enrichment for the other 100% GC dinucleotide and depletion of 0% GC dinucleotide. (D) A heat map showing the presence of at least one E-box (blue) of each type in peaks reveals that the majority of peaks contain at least one GC-rich E-box, but a substantial minority rely on non-GC-rich E-boxes (or have no E-box at all). (E) Overall E-box numbers also vary widely across peaks, raising the question of how E-box types and numbers are jointly utilized to regulate binding affinity. (F) In an analysis of 17 laboratory mouse genomes, the overall rate of SNPs to A, C, G and T nucleotides, and the observed rates of SNPs to E-boxes in MyoD peaks. (G) Rates of SNPs to the center dinucleotide of E-boxes in MyoD peaks or genome wide show preservation of GC-rich E-boxes but not AT-rich E-boxes.
Figure 2.
Figure 2.
Relationship between motif sequence and enrichment of MyoD on target sites. (A) The numbers of MyoD reads in peaks, a proxy for total binding affinity to a region, are strongly correlated to the widths of peaks. (B) MyoD reads are also correlated to read density. (C) Peak reads, height and read density, as well as total reads in a 1 kb-radius window around the peak summit, correlate moderately to nearby gene expression change. The reads also correlate strongly to the epigenetic status of the peak. (D) Peaks with greater numbers of reads include, on average, greater numbers of E-boxes of all kinds, with the increase strongest for E-boxes with GC-rich center dinucleotide. (E) However, when we look at fixed-width regions centered on peak summits, only GC-rich E-boxes show an increasing trend and GC-poor E-boxes decline with increasing total read count. (F) Analysis of GC 100% and GC50% E-boxes in a 200-bp window around the summit again shows the dominant effect of 100% GC E-boxes, but provides some evidence for increased binding resulting from GC50% E-boxes as well.
Figure 3.
Figure 3.
Spatial distribution of E-boxes in the vicinities of peaks, and their contribution to total peak reads. (A) The relative frequency of E-boxes (divided into three groups based on the GC content of their center dinucleotide) in peaks and flanking regions, each of which is divided into seven equal-sized bins for MyoD ChIP-seq replicates. (B) E-box frequencies in 21 equal-sized bins spanning 2 kb centered on the peak summits, for the 10% narrowest peaks and 10% widest peaks. (C) E-box frequencies per bin, in the same 21 bins across all peaks, along with average MyoD reads divided by 10 (so that scale is comparable). (D) For each of the three E-box categories, the maximum likelihood regression coefficients and 95% confidence intervals for a linear model predicting MyoD reads in each of the 21 bins as a function of the E-box counts in the same bins.
Figure 4.
Figure 4.
The role of the summit E-box in binding affinity. (A) MyoD reads per peak grouped depending on the GC-content of the E-box nearest the peak summit. (B) Mean MyoD reads within peaks as a function of number of E-boxes, separating by the type of the summit E-box. (C and D) Heatmaps showing MyoD reads as a function of numbers of 100% GC and 50% GC E-boxes within 200 bp of the peak summit, and separating by the type of the summit E-box. (EG) The relationship between tag density (mean sequenced reads) and single summit E-box motif and enrichment of MyoD reads. Peak summit was determined by MACS and summit E-box is the closest motif to the summit.
Figure 5.
Figure 5.
Dynamic interplay between MyoD and nucleosomes regulates MyoD binding and differential gene expression output. (A) Pileup analysis of the distribution of total Histone H3 (pan histone H3 ChIP-seq reads) centered on motifs with 0, 50 and 100% GC content center dinucleotide. (B) A similar pileup analysis of H3K4me1 reads. (C) Average differential gene expression for MyoD target genes associated with peaks depending on the total MyoD reads in the peaks, grouped by deciles. (D) Similar differential expression, but where peaks are ranked by the E-box motif score, which combines E-box types, numbers and positions into an overall weighted prediction of MyoD affinity.
Figure 6.
Figure 6.
Genome-wide relationship between MyoD binding affinity, nucleosome occupancy and gene expression. Circos plot showing the relationship between sequence variation in MyoD binding motif and the affinity landscape of MyoD binding to DNA and differential expression of target genes. Each track on the concentric circles represents one dataset. The MyoD track (outermost circle) shows ranked peak tag density (PTD) (number of sequenced reads within peak divided by the peak length) for genome-wide MyoD binding sites. The H3K4me1 track shows PTD of histone H3 mono methyl lysine 4 that overlap with MyoD peaks in myotubes. H3K4me3 track shows PTD of histone H3 tri-methyl lysine 4 on the TSS of genes that are associated with MyoD peaks (Supplementary Data). H3K27me3 track shows tag density of histone H3 tri-methyl lysine 27 on the TSS of genes associated with MyoD peaks. H3 track shows PTD of total histone H3 overlapping with MyoD peaks. The three motif tracks show average number of E-box motifs divided into three categories of 0, 50 and 100% GC content of their center dinucleotide. The RNA track (RNA-seq) shows differential expression of MyoD target genes (Supplementary Data). Data is binned into 100 bins and average value within each bin is plotted.
Figure 7.
Figure 7.
The effect of motif numbers and sequences on gene expression output. Synthetic CREs were generated and sub cloned into pGL4.23 luciferase construct. (A) Schematic showing the numbers and sequences of E-boxes within CREs. DEL represents location of deleted E-box; GC represents CAGCTG; AT represents CAATTG, CA represents CACATG. (B) Relative luciferase activity after normalization to renilla. Dual luciferase assay was performed in Cos7 cells by co transfecting mouse MyoD and E47 expression vectors.

References

    1. Davis R.L., Weintraub H., Lassar A.B.. Expression of a single transfected cDNA converts fibroblasts to myoblasts. Cell. 1987; 51:987–1000. - PubMed
    1. Weintraub H., Genetta T., Kadesch T.. Tissue-specific gene activation by MyoD: determination of specificity by cis-acting repression elements. Genes Dev. 1994; 8:2203–2211. - PubMed
    1. Ma P.C., Rould M.A., Weintraub H., Pabo C.O.. Crystal structure of MyoD bHLH domain-DNA complex: perspectives on DNA recognition and implications for transcriptional activation. Cell. 1994; 77:451–459. - PubMed
    1. Fong A.P., Yao Z., Zhong J.W., Cao Y., Ruzzo W.L., Gentleman R.C., Tapscott S.J.. Genetic and epigenetic determinants of neurogenesis and myogenesis. Dev. Cell. 2012; 22:721–735. - PMC - PubMed
    1. Mousavi K., Zare H., Dell’Orso S., Grontved L., Gutierrez-Cruz G., Derfoul A., Hager G.L., Sartorelli V.. eRNAs promote transcription by establishing chromatin accessibility at defined genomic loci. Mol. Cell. 2013; 51:606–617. - PMC - PubMed

Publication types

MeSH terms

Substances