. 2018 Jul 17;12(1):77.
doi: 10.1186/s12918-018-0603-9.

A quantitative systems pharmacology (QSP) model for Pneumocystis treatment in mice

Affiliations

A quantitative systems pharmacology (QSP) model for Pneumocystis treatment in mice

Guan-Sheng Liu et al. BMC Syst Biol. .

Erratum in

Abstract

Background: The yeast-like fungi Pneumocystis, resides in lung alveoli and can cause a lethal infection known as Pneumocystis pneumonia (PCP) in hosts with impaired immune systems. Current therapies for PCP, such as trimethoprim-sulfamethoxazole (TMP-SMX), suffer from significant treatment failures and a multitude of serious side effects. Novel therapeutic approaches (i.e. newly developed drugs or novel combinations of available drugs) are needed to treat this potentially lethal opportunistic infection. Quantitative Systems Pharmacological (QSP) models promise to aid in the development of novel therapies by integrating available pharmacokinetic (PK) and pharmacodynamic (PD) knowledge to predict the effects of new treatment regimens.

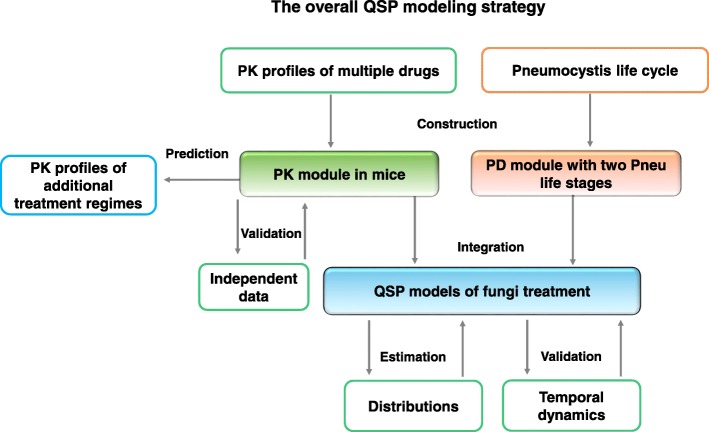
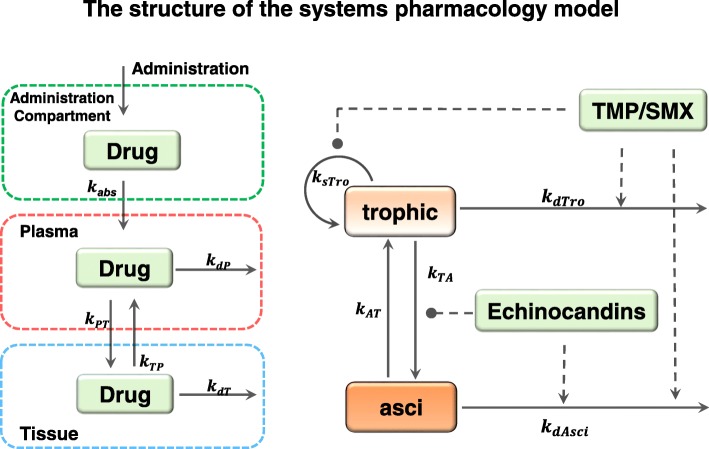
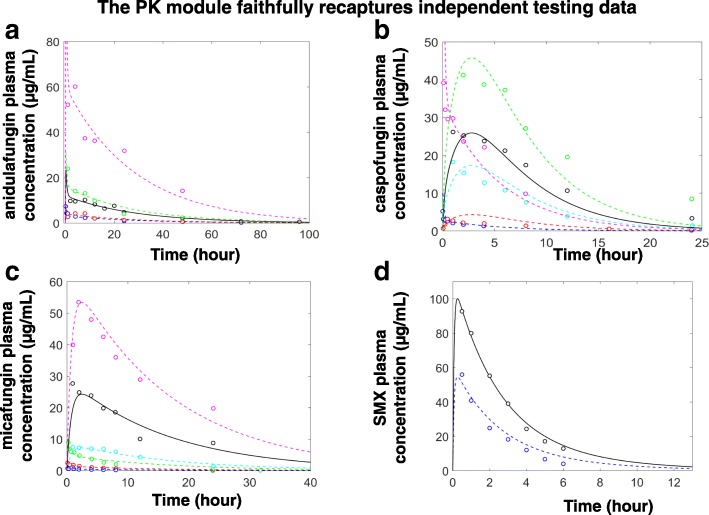
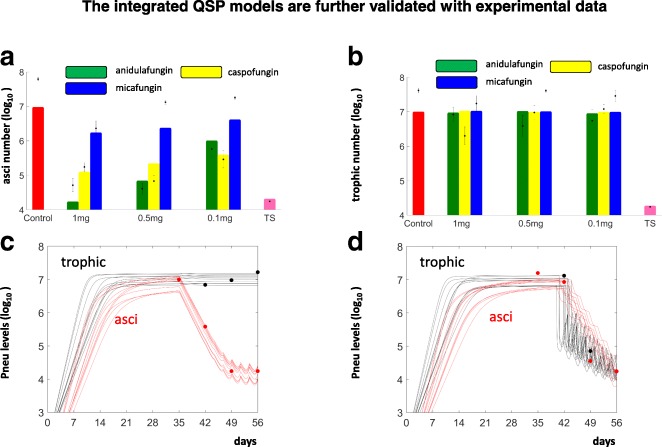
Results: In this work, we constructed and independently validated PK modules of a number of drugs with available pharmacokinetic data. Characterized by simple structures and well constrained parameters, these PK modules could serve as a convenient tool to summarize and predict pharmacokinetic profiles. With the currently accepted hypotheses on the life stages of Pneumocystis, we also constructed a PD module to describe the proliferation, transformation, and death of Pneumocystis. By integrating the PK module and the PD module, the QSP model was constrained with observed levels of asci and trophic forms following treatments with multiple drugs. Furthermore, the temporal dynamics of the QSP model were validated with corresponding data.

Conclusions: We developed and validated a QSP model that integrates available data and promises to facilitate the design of future therapies against PCP.

Keywords: Infectious disease; Pneumocystis - systems biology - quantitative systems pharmacology.


Conflict of interest statement

Ethics approval and consent to participate

The animal protocols used for this study were reviewed and approved by the University of Cincinnati’s IACUC committee and the Cincinnati Veterans Affairs Medical Center IACUC; protocols UC 12–05–03-01 and ACORP#15–02–25-01, respectively. Both committees adhere to the 8th edition of the “Guide for the Care and Use of Laboratory Animals” and both are AAALAC accredited.

Consent for publication

Not applicable.

Competing interests

The authors declare that they have no competing interests.

Publisher’s Note

Springer Nature remains neutral with regard to jurisdictional claims in published maps and institutional affiliations.

Figures

Fig. 1
Fig. 1
The overall QSP modeling strategy. The constructed QSP model includes both a PK module and a PD module. The PK module describes the distribution and decay of different drugs. The PD module specifies the proliferation, transformation, and death of the trophic forms and asci of Pneumocystis fungi. After construction of the PK module, this module was validated with independent data that were not used for its construction. For the PD module, all available data were used for its construction. The integrated QSP model, which includes both the PK module and the PD module, was constructed with the distribution of asci and trophic forms following treatment and then validated with their temporal dynamics
Fig. 2
Fig. 2
The structure of the QSP model. Left panel: A three-compartment PK module was used to describe the reported pharmacokinetic data. The first compartment was the AC, the second compartment was plasma, and the third was ‘peripheral tissue’. Drug decay was assumed to occur in plasma and ‘peripheral tissue’ compartments. The rates of drug distribution and decay were described by the corresponding parameters. Right panel: The dynamics of Pneumocystis were described by a two-stage model which involves both trophic forms and asci. The temporal changes of trophic forms and asci were also controlled by the indicated parameters. The drug effects were indicated by arrows (promoting) and lines with solid circle heads (inhibiting)
Fig. 3
Fig. 3
The PD modules were consistent with experimental data from diverse sources. a. Temporal simulations for the dynamic changes of trophic form (black curves) and asci (red curves) starting from an initial state with a high level of trophic forms and a low level of asci. b. Temporal simulations (black curves) of the normalized total number of Pneumocystis were compared to the normalized nuclei count from Pneumocystis infected mice (red dots, error bars represent SEM, n = 2 or 3 for each time point). c and d. Histograms showing the distributions of the numbers of the trophic form and asci simulated by the PD module
Fig. 4
Fig. 4
The simulations of the QSP models were consistent to relevant data. a and b. Bar plots of average simulated log10 levels: of asci (a) and trophic forms (b) at day 56 post-treatment of Pneumocystis from: untreated mice (Control), mice treated with varying doses of anidulafungin, caspofungin and micafungin; as well as mice treated with TMP-SMX. Corresponding experimental data are represented as dot plots with standard error. c. The simulated dynamic changes of the trophic forms (black curves) and asci (red curves), on a log10 scale were consistent to the corresponding experimental data (black and red dots) following anidulafungin treatment. d. The simulated dynamic changes of trophic forms (black curves) and asci (red curves) were consistent to the corresponding data (black dots and red dots) following TMP-SMX treatment
Fig. 5
Fig. 5
The temporal simulations of the PK modules were consistent with diverse experimental data. The temporal simulations of the plasma concentrations of anidulafungin (a), caspofungin (b), micafungin (c) and smx (d) were compared to relevant experimental data. The black dots and black solid curves represent the construction data and corresponding model simulations; the colored dots and colored dashed curves represent the validation data and corresponding simulations. The data sources were elaborated in Table 2. The colors in each panel were used to indicate different administration methods and dosages. In a, blue, i.v. of 1 mg/kg; magenta, green and red, i.p. of 80 mg/kg, 20 mg/kg and 5 mg/kg respectively. In b, blue and magenta, i.v. of 0.5 mg/kg and 5 mg; red, cyan and green, i.p. of 1 mg/kg, 5 mg/kg and 80 mg/kg; In c, blue, red and green, i.v. of 0.32 mg/kg, 1 mg/kg and 3.2 mg/kg; cyan and magenta, i.p. of 5 mg/kg and 80 mg/kg; In d, blue, oral of 50 mg/kg
Fig. 6
Fig. 6
The temporal drug profiles predicted by the PK modules. a, b, c and d show the predicted plasma levels of anidulafungin, caspofungin, micafungin and SMX when administrated 3 times/week. The different dosages of anidulafungin, caspofungin, micafungin (in mg/kg) are labelled in each panel, the SMX dosage is 200 mg/kg

References

    1. Huang YS, Yang JJ, Lee NY, Chen GJ, Ko WC, Sun HY, Hung CC. Treatment of pneumocystis jirovecii pneumonia in HIV-infected patients: a review. Expert Rev Anti-Infect Ther. 2017;15(9):873–892. doi: 10.1080/14787210.2017.1364991. - DOI - PubMed
    1. Liu Y, Su L, Jiang SJ, Qu H. Risk factors for mortality from pneumocystis carinii pneumonia (PCP) in non-HIV patients: a meta-analysis. Oncotarget. 2017;8(35):59729–59739. - PMC - PubMed
    1. Luraschi A, Cisse OH, Pagni M, Hauser PM. Identification and functional ascertainment of the pneumocystis jirovecii potential drug targets Gsc1 and Kre6 involved in glucan synthesis. J Eukaryot Microbiol. 2017;64(4):481–490. doi: 10.1111/jeu.12385. - DOI - PubMed
    1. Walzer PD, Evans HE, Copas AJ, Edwards SG, Grant AD, Miller RF. Early predictors of mortality from pneumocystis jirovecii pneumonia in HIV-infected patients: 1985-2006. Clin Infect Dis. 2008;46(4):625–633. doi: 10.1086/526778. - DOI - PMC - PubMed
    1. Huang L, Cattamanchi A, Davis JL, den Boon S, Kovacs J, Meshnick S, Miller RF, Walzer PD, Worodria W, Masur H, et al. HIV-associated pneumocystis pneumonia. Proc Am Thorac Soc. 2011;8(3):294–300. doi: 10.1513/pats.201009-062WR. - DOI - PMC - PubMed

Publication types

Substances

LinkOut - more resources