. 2018 Oct 2;28(4):656-666.e1.
doi: 10.1016/j.cmet.2018.06.019. Epub 2018 Jul 12.

CalR: A Web-Based Analysis Tool for Indirect Calorimetry Experiments

Affiliations

CalR: A Web-Based Analysis Tool for Indirect Calorimetry Experiments

Amir I Mina et al. Cell Metab. .

Abstract

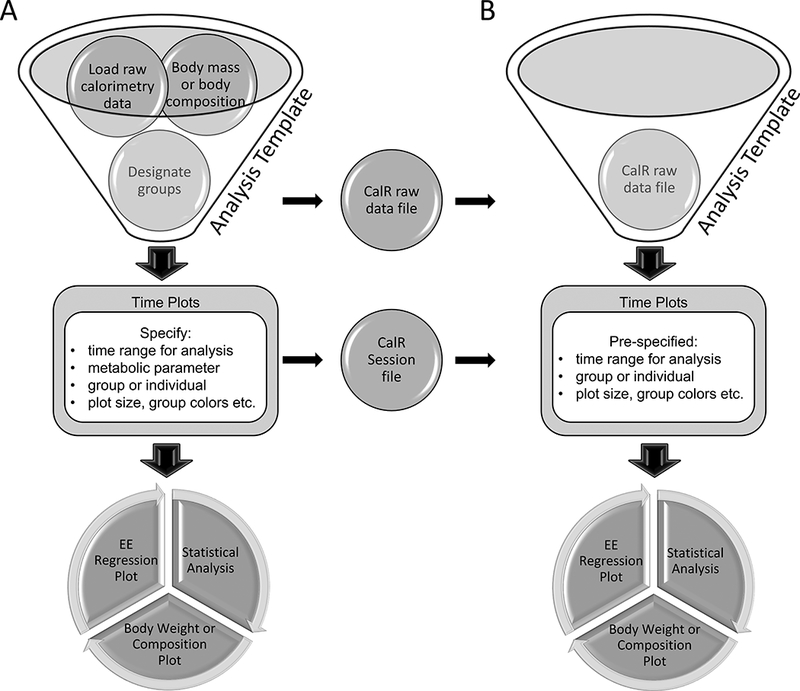
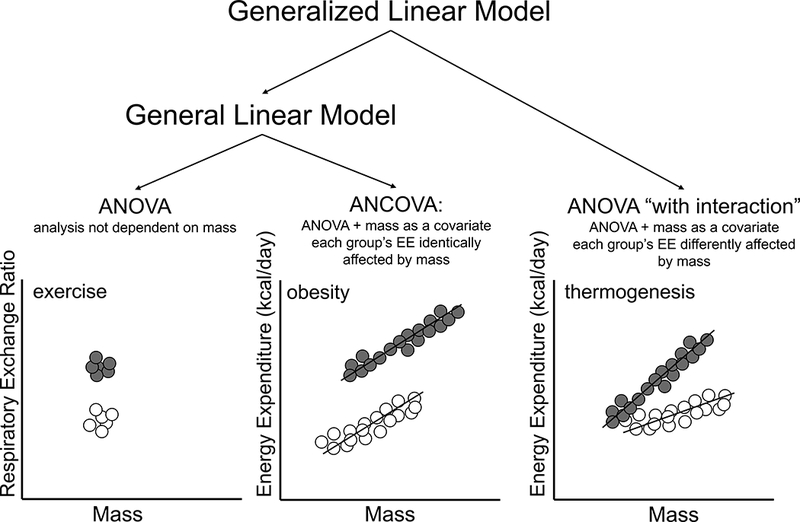
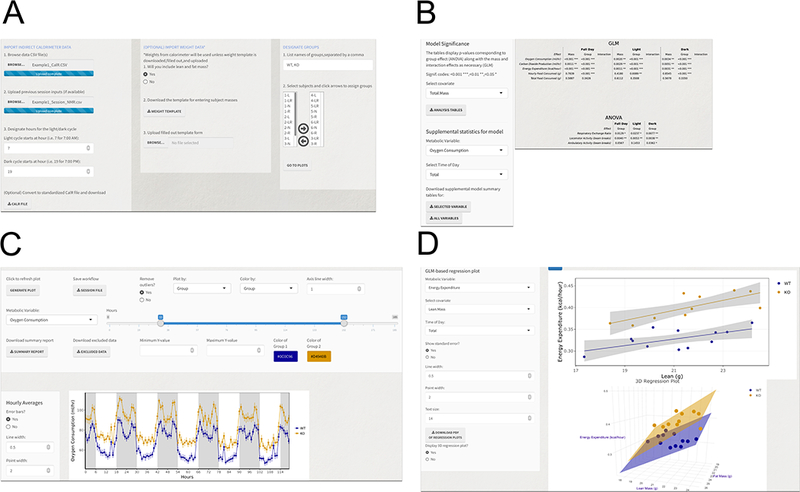
We report a web-based tool for analysis of experiments using indirect calorimetry to measure physiological energy balance. CalR simplifies the process to import raw data files, generate plots, and determine the most appropriate statistical tests for interpretation. Analysis using the generalized linear model (which includes ANOVA and ANCOVA) allows for flexibility in interpreting diverse experimental designs, including those of obesity and thermogenesis. Users also may produce standardized output files for an experiment that can be shared and subsequently re-evaluated using CalR. This framework will provide the transparency necessary to enhance consistency, rigor, and reproducibility. The CalR analysis software will greatly increase the speed and efficiency with which metabolic experiments can be organized, analyzed per accepted norms, and reproduced and will likely become a standard tool for the field. CalR is accessible at https://CalRapp.org/.

Keywords: ANCOVA; CLAMS; biostatistics; energy balance; energy expenditure; food intake; indirect calorimetry; metabolic phenotyping; metabolism; reproducibility.


Conflict of interest statement

Declaration of Interests:

The authors declare no competing interests.

Figures

Figure 1.
Figure 1.. CalR data analysis workflow.
Users will select an analysis template that best matches their experimental design. A) First-time analysis of an experiment includes loading raw indirect calorimetry data, optionally loading body composition data, and assigning animals into groups. This raw data can be exported into a standardized CalR data file for fast loading in subsequent sessions. Plotting parameters including the time range for analysis and other aesthetic preferences are set and visualized. These settings are saved as a CalR Session file. Once parameters are defined, statistical analysis and additional plotting results are available. B) Exported CalR raw data files and CalR Session files allow fast, transparent analysis and a record for reproducible research. Simply stated, the CalR data file is an unaltered experimental record. The CalR session file contains what was done to produce the analysis.
Figure 2.
Figure 2.. Defining an experiment.
This one calorimetry run included two experiments in which two groups of mice were maintained at thermoneutrality (30°C) (Experiment 1) followed by a transition to a cold challenge and maintenance at 4°C (Experiment 2). Users of CalR would sequentially analyze these two experiments by selecting the corresponding time regions.
Figure 3.
Figure 3.. Example data from five analysis templates.
Left column, Time Plot; Right column, Overall Experiment Summary. A) Two-group template. VO2 for two groups of mice monitored for four days at room temperature. B) Two-group acute response template. Food intake for two groups over ten hours following treatment. C) Three-group template: ordered. Body temperature in wildtype, heterozygote, and knockout animals maintained at 4°C. D) Three group template: non-ordered. Energy expenditure of wildtype and two independent knockout strains. E) Four-group template. Energy expenditure analysis of two genotypes of mice on two different diets. Not shown: Crossover template or run combination tool. Note: CalR plots are not normalized or adjusted to body weight, lean mass, or another allometric scaling.
Figure 4.
Figure 4.
Analysis models of energy expenditure based on the general linear model. CalR determines the appropriate statistical model from the experimental data. A) ANOVA is applied where mass or body composition is not expected to affect the metabolic parameter. A sedentary group (grey) compared to an exercised group (white) with similar mass would use the ANOVA to examine group differences in respiratory exchange ratio (RER). B) The ANCOVA (ANOVA with the addition of a covariate) when mass is significantly different, but slopes are parallel. This model could interpret an obese group of mice (gray) compared with lean controls (white) where greater mass and EE are observed. C) The GLM can interpret the different effect of mass on EE between groups by including an interaction effect. Mice with greater BAT mass (gray) with a more pronounced thermogenic response could be interpreted by this model.
Figure 5.
Figure 5.
Example of the CalR graphical user interface for the two-group analysis. A) Input tab for data upload and group assignments. B) Time Plots tab for data visualization of individual metabolic parameters for the selected period. Selected plots for oxygen consumption vs time. Shading denotes dark and light photoperiod. C) Results of statistical tests are shown in the “Analysis tab”. D) Regression Plots tab allows for analysis of metabolic data vs. mass in two or three dimensions EE vs LBM and/or FM.

References

    1. Allison D, Paultre F, Goran M, Poehlman E, and Heymsfield S (1995). Statistical considerations regarding the use of ratios to adjust data. International journal of obesity and related metabolic disorders: journal of the International Association for the Study of Obesity 19, 644–652. - PubMed
    1. Arch J, Hislop D, Wang S, and Speakman J (2006). Some mathematical and technical issues in the measurement and interpretation of open-circuit indirect calorimetry in small animals. International journal of obesity 30, 1322–1331. - PubMed
    1. Betz MJ, and Enerback S (2017). Targeting thermogenesis in brown fat and muscle to treat obesity and metabolic disease. Nat Rev Endocrinol advance online publication. - PubMed
    1. Butler AA, and Kozak LP (2010). A Recurring Problem With the Analysis of Energy Expenditure in Genetic Models Expressing Lean and Obese Phenotypes. Diabetes 59, 323–329. - PMC - PubMed
    1. Calle EE, Rodriguez C, Walker-Thurmond K, and Thun MJ (2003). Overweight, obesity, and mortality from cancer in a prospectively studied cohort of U.S. adults. N Engl J Med 348, 1625–1638. - PubMed

Publication types