. 2018 Aug 13;34(2):197-210.e5.
doi: 10.1016/j.ccell.2018.06.008. Epub 2018 Jul 12.

The Tandem Duplicator Phenotype Is a Prevalent Genome-Wide Cancer Configuration Driven by Distinct Gene Mutations

Affiliations

The Tandem Duplicator Phenotype Is a Prevalent Genome-Wide Cancer Configuration Driven by Distinct Gene Mutations

Francesca Menghi et al. Cancer Cell. .

Abstract

The tandem duplicator phenotype (TDP) is a genome-wide instability configuration primarily observed in breast, ovarian, and endometrial carcinomas. Here, we stratify TDP tumors by classifying their tandem duplications (TDs) into three span intervals, with modal values of 11 kb, 231 kb, and 1.7 Mb, respectively. TDPs with ∼11 kb TDs feature loss of TP53 and BRCA1. TDPs with ∼231 kb and ∼1.7 Mb TDs associate with CCNE1 pathway activation and CDK12 disruptions, respectively. We demonstrate that p53 and BRCA1 conjoint abrogation drives TDP induction by generating short-span TDP mammary tumors in genetically modified mice lacking them. Lastly, we show how TDs in TDP tumors disrupt heterogeneous combinations of tumor suppressors and chromatin topologically associating domains while duplicating oncogenes and super-enhancers.

Keywords: BRCA1; CCNE1; CDK12; TP53; genome instability; ovarian carcinoma; tandem duplication; triple-negative breast cancer.


Conflict of interest statement

DECLARATION OF INTERESTS

The authors declare no competing interests.

Figures
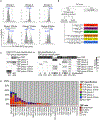
Figure 1.
Figure 1.. Classification of TDP Genomes into Six Distinct Subgroups
(A) Representative TD span size distribution profiles for the six identified TDP subgroups. Individual distribution peaks are highlighted in blue. Vertical lines indicate the three modal span sizes at 11 kb, 231 kb, and 1.7 Mb. (B) Schematic overview of the TDP group classification approach. (C) Left: convergence between the TDP group 2/3mix profile and tumors classified as CDK12 TD-plus by Popova et al. (2016). Right: overlap between the TDP classification and RS3- and RS1-positive tumors as defined by Nik-Zainal et al. (2012). Numbers in parenthesis indicate the sample size for each tumor subclass. (D) Bar chart of the relative proportion of each TDP group across the 31 tumor types examined. *Binomial test statistics was applied to identify tumor types that are overall enriched or depleted for the TDP. See also Figure S1, and Tables S1, S2, and S3.
Figure 2.
Figure 2.. Conjoint Abrogation of BRCA1 and TP53 Results in TDP with Class 1 TDs
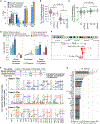
(A) Percentage of tumor samples with abrogation of the BRCA1 gene. Only tumor type/TDP group combinations comprising at least eight samples were analyzed. NA, data not available; non, non-TDP; g1, g1/2mix, g1/3mix, g2, g3, g2/3mix: TDP groups 1, 1/2mix, 1/3mix, 2, 3, and 2/3mix; OTHER: all tumor types except TNBC, OV, and UCEC. (B) Percentage of tumor samples with TP53 somatic mutations. Annotations as in (A). Number of samples for each tumor type/TDP group combination do not necessarily match those reported in (A) because of missing values. (C) TDP classification for mouse breast cancers with somatic loss of Trp53 and/or Brca1/2. T, Trp53; B1, Brca1; B2, Brca2. (D) Span sizes of TDs found in Trp53/Brca1 null tumors (left) and in Brca1-proficient tumors (right). ***p < 0.001, **p < 0.01, *p < 0.05, by (1) generalized linear mixed model with tumor type as the random effect or (2) Fisher’s exact test. See also Figure S2 and Tables S4 and S5.
Figure 3.
Figure 3.. Genetic Perturbations Associated with BRCA1-Proficient TDP Groups
(A) Percentage of tumor samples with damaging mutations affecting CDK12. (B) Percentage of tumor samples showing CCNE1 pathway activation (FBXW7 somatic mutation or CCNE1 amplification). Annotations as in Figure 2A. ***p < 0.001, *p < 0.05, by (1) generalized linear mixed model with tumor type as the random effect or (2) Fisher’s exact test. See also Tables S4 and S6, and Figure S3.
Figure 4.
Figure 4.. Genomic Hotspots of TD Breakpoints
(A) Genomic distribution of hotspots for TD breakpoints found in non-TDP tumors. (B) Genomic distribution of hotspots for TD breakpoints found in TDP tumors. Top three panels: genomic hotspots for class 1, class 2, and class 3 TDs. Lower panel: recurrent genomic hotspots across different TD classes. Known oncogenes and TSGs are flagged in red and blue, respectively. See also Table S7 and Figure S4.
Figure 5.
Figure 5.. TD-Mediated Effects on Gene Bodies
(A) Number of gene double and single transections and gene duplications caused by TDs of different span sizes. (B) Number of TD-mediated gene double transections in TDP tumors with class 1 TDs (TDP groups 1, 1/2mix, and 1/3mix) compared with the other TDP tumors. Boxes span the interquartile range, with the median values marked by a horizontal line inside the box. Whiskers extend to 1.5 times the interquartile range from each box. p values by Mann-Whitney U test. (C) Number of TD-mediated gene duplications in TDP tumors with a prevalence of class 2 and class 3 TDs (TDP groups 2, 3, and 2/3mix) compared with the other TDP tumors. Boxes span the interquartile range, with the median values marked by a horizontal line inside the box. Whiskers extend to 1.5 times the interquartile range from each box. p values by Mann-Whitney U test. (D) TSG and oncogene enrichment across sets of genes recurrently impacted by TDs via single or double transection or duplication. ***p < 0.001, **p < 0.01, *p < 0.05, by Fisher’s exact test. (E) Recurrently TD-impacted genes by TD class and type of TD-mediated effect. Top: number of genes recurrently impacted by TDs in TDP tumors. Bottom: prevalence of TD-mediated gene disruptions: x_axis, genomic location; y_axis, cumulative fraction of affected TDP tumors across the different tumor types examined. Selected genes are flagged for easy of reference. (F) High density of class 1 TDs at the PTEN locus in both the TNBC and OV datasets. (G) Percentage of TDP tumors affected by significantly recurrent class 1 TD-mediated double transection events across the TNBC and OV datasets. See also Table S8 and Figure S5.
Figure 6.
Figure 6.. TD-Mediated Duplication of Tissue-Specific Regulatory Elements and TAD Boundaries in TDP Tumors
(A) Percentage of class 1, 2, and 3 TDs involved in the duplication of disease-associated SNPs and tissue-specific super-enhancers (observed versus expected) in the TNBC and OV datasets. (B) Percentage of class 1, 2, and 3 TDs participating in TAD boundary duplication (observed versus expected) in the TNBC and OV datasets. p values by chi-square test. See also Table S6.
Figure 7.
Figure 7.. Number of TD-Mediated TSG Disruptions and Oncogene Duplications across Different TDP Groups
(A) Number of known cancer genes per genome that are duplicated or disrupted as a result of specific TDP configurations. (B) Boxplot summary of the data presented in (A). Boxes span the interquartile range, with the median values marked by a horizontal line inside the box. Whiskers extend to 1.5 times the interquartile range from each box, and outliers are drawn as individual points extending past the whiskers.

Comment in

References

    1. Aladjem MI, Spike BT, Rodewald LW, Hope TJ, Klemm M, Jaenisch R, and Wahl GM (1998). ES cells do not activate p53-dependent stress responses and undergo p53-independent apoptosis in response to DNA damage. Curr. Biol 8, 145–155. - PubMed
    1. Baca SC, Prandi D, Lawrence MS, Mosquera JM, Romanel A, Drier Y, Park K, Kitabayashi N, MacDonald TY, Ghandi M, et al. (2013). Punctuated evolution of prostate cancer genomes. Cell 153, 666–677. - PMC - PubMed
    1. Bailey P, Chang DK, Nones K, Johns AL, Patch AM, Gingras MC, Miller DK, Christ AN, Bruxner TJ, Quinn MC, et al. (2016). Genomic analyses identify molecular subtypes of pancreatic cancer. Nature 531, 47–52. - PubMed
    1. Barthel FP, Wei W, Tang M, Martinez-Ledesma E, Hu X, Amin SB, Akdemir KC, Seth S, Song X, Wang Q, et al. (2017). Systematic analysis of telomere length and somatic alterations in 31 cancer types. Nat. Genet 49, 349–357. - PMC - PubMed
    1. Bass AJ, Lawrence MS, Brace LE, Ramos AH, Drier Y, Cibulskis K, Sougnez C, Voet D, Saksena G, Sivachenko A, et al. (2011). Genomic sequencing of colorectal adenocarcinomas identifies a recurrent VTI1ATCF7L2 fusion. Nat. Genet 43, 964–968. - PMC - PubMed

Publication types