. 2018 Sep 3;150(9):1299-1316.
doi: 10.1085/jgp.201711924. Epub 2018 Jul 17.

Propofol inhibits prokaryotic voltage-gated Na+ channels by promoting activation-coupled inactivation

Affiliations

Propofol inhibits prokaryotic voltage-gated Na+ channels by promoting activation-coupled inactivation

Elaine Yang et al. J Gen Physiol. .

Abstract

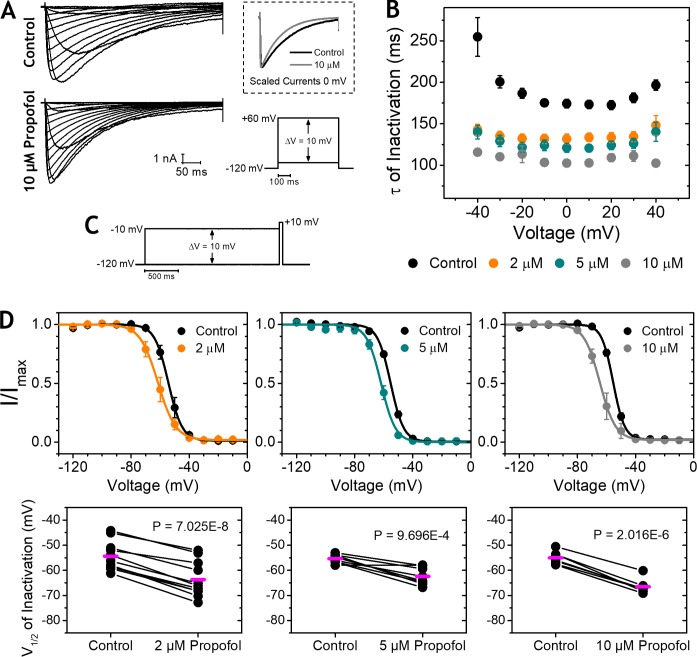
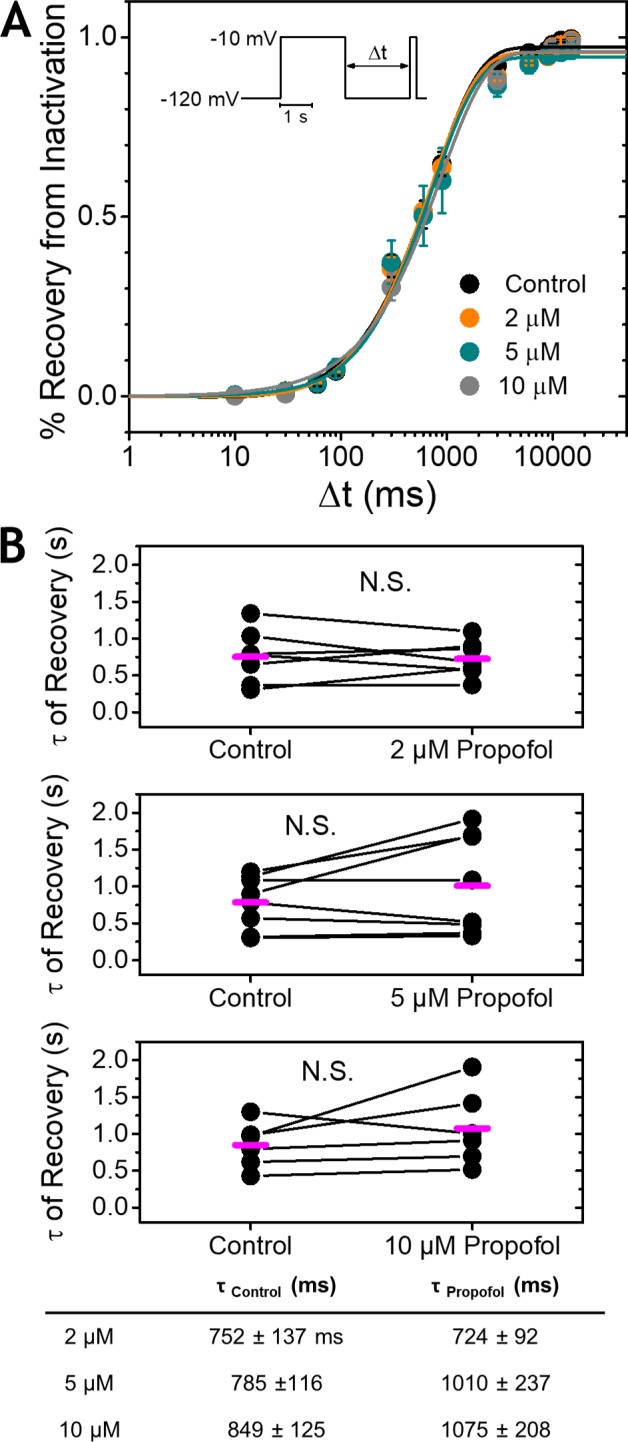
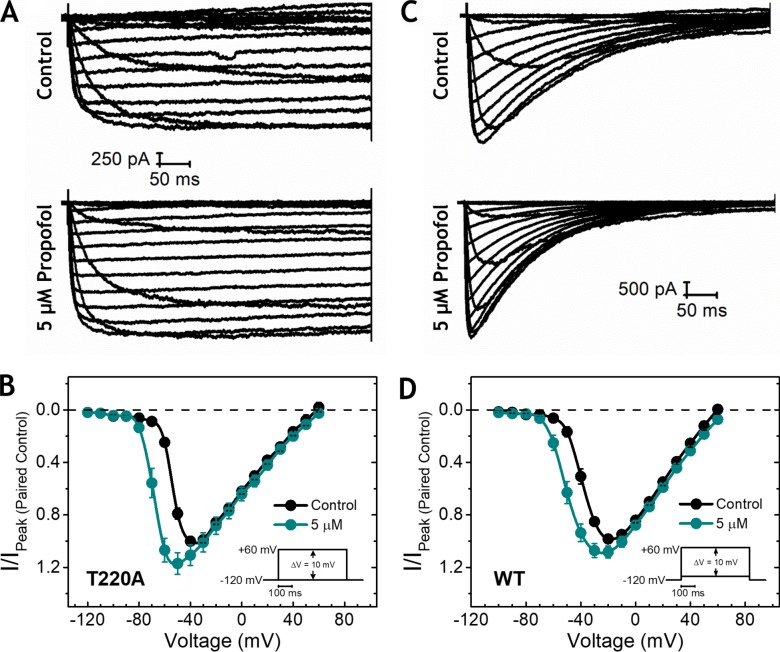
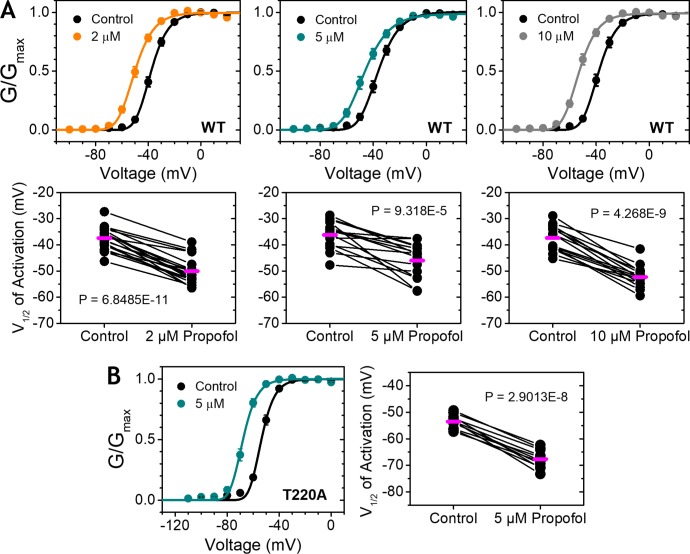
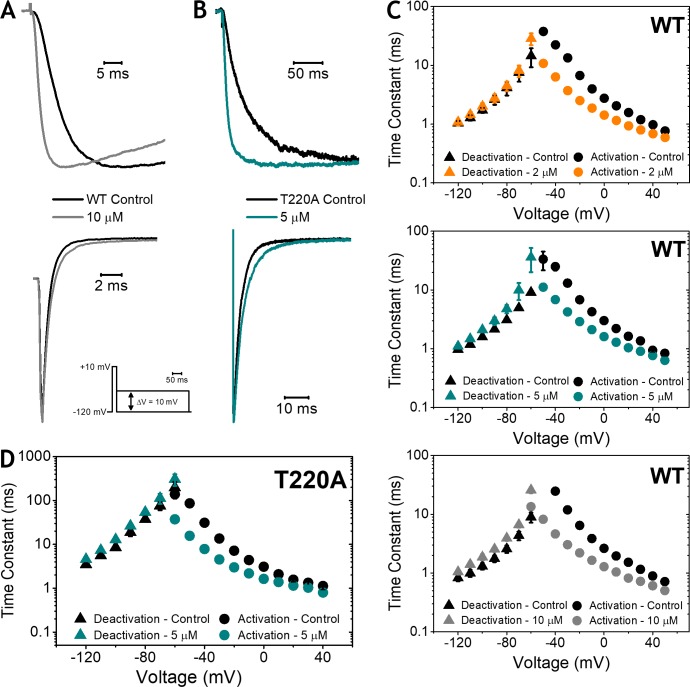
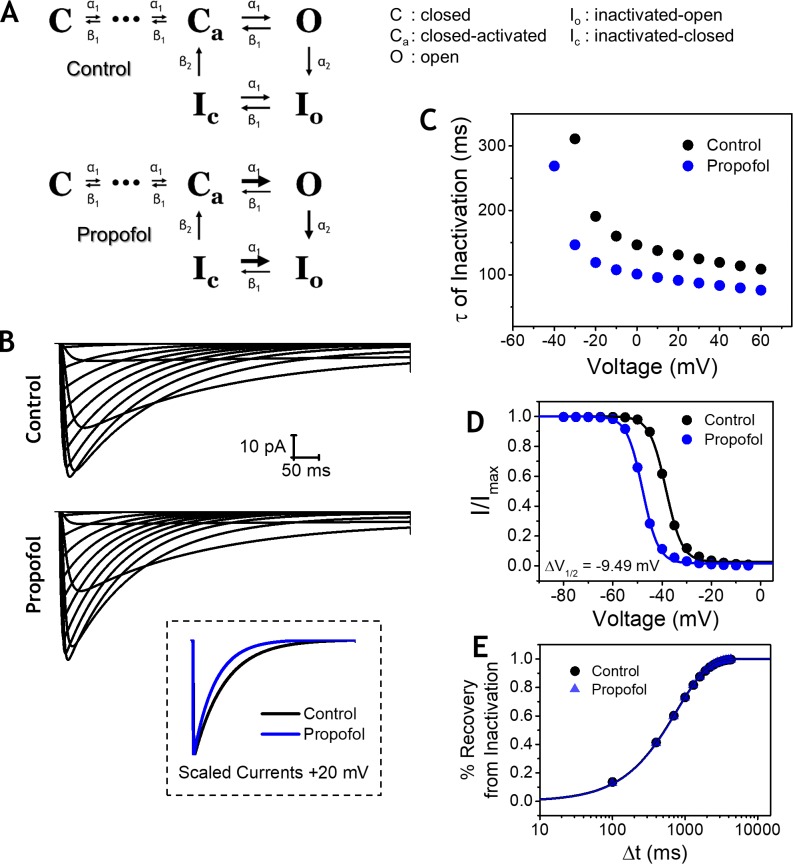
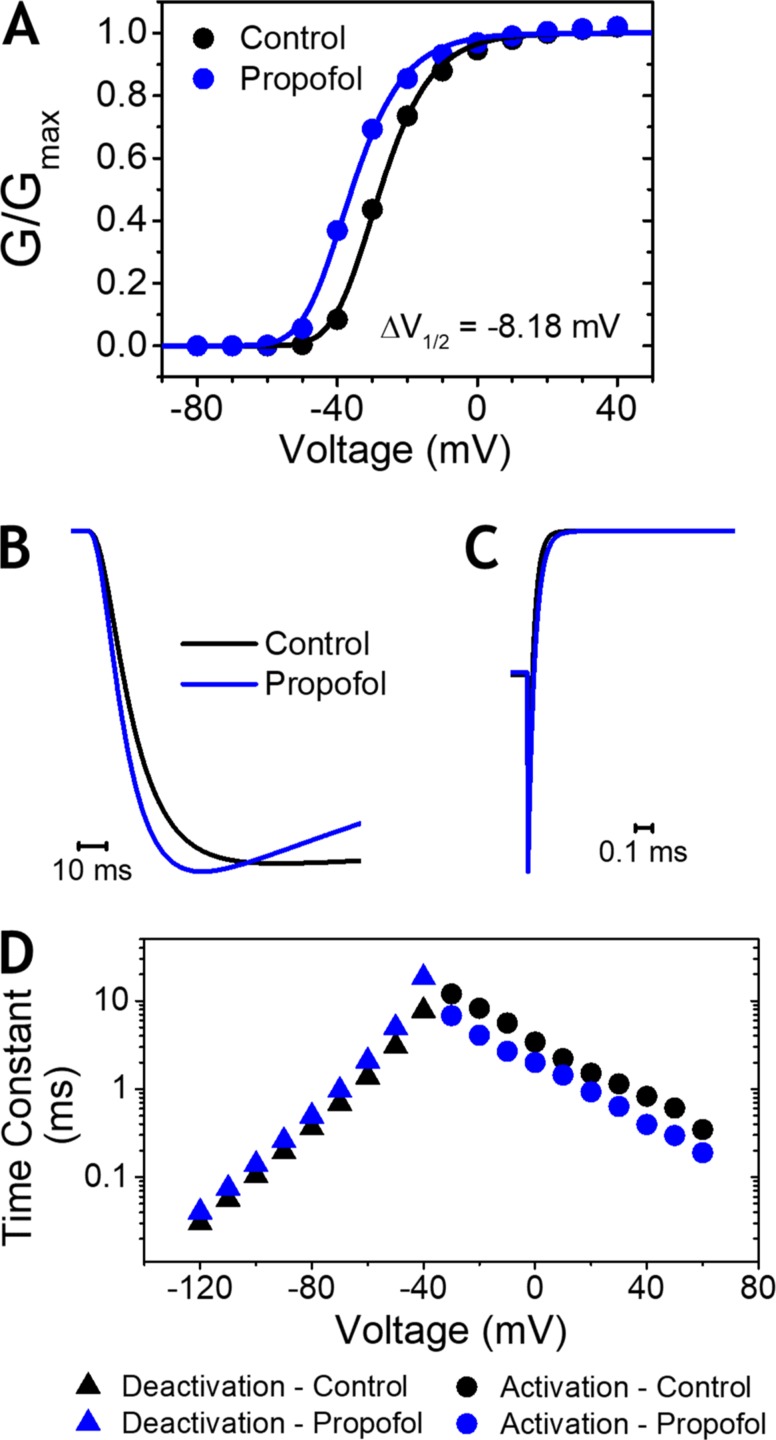
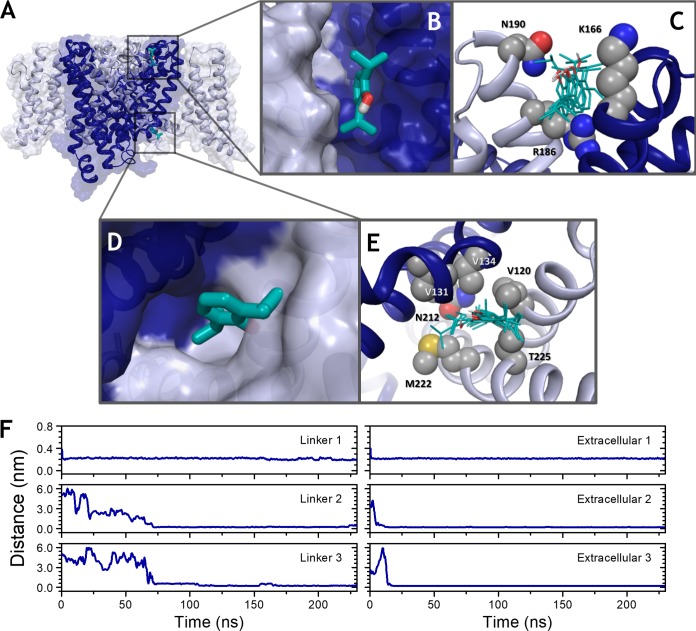
Propofol is widely used in the clinic for the induction and maintenance of general anesthesia. As with most general anesthetics, however, our understanding of its mechanism of action remains incomplete. Local and general anesthetics largely inhibit voltage-gated Na+ channels (Navs) by inducing an apparent stabilization of the inactivated state, associated in some instances with pore block. To determine the biophysical and molecular basis of propofol action in Navs, we investigated NaChBac and NavMs, two prokaryotic Navs with distinct voltage dependencies and gating kinetics, by whole-cell patch clamp electrophysiology in the absence and presence of propofol at clinically relevant concentrations (2-10 µM). In both Navs, propofol induced a hyperpolarizing shift of the pre-pulse inactivation curve without any significant effects on recovery from inactivation at strongly hyperpolarized voltages, demonstrating that propofol does not stabilize the inactivated state. Moreover, there was no evidence of fast or slow pore block by propofol in a non-inactivating NaChBac mutant (T220A). Propofol also induced hyperpolarizing shifts of the conductance-voltage relationships with negligible effects on the time constants of deactivation at hyperpolarized voltages, indicating that propofol does not stabilize the open state. Instead, propofol decreases the time constants of macroscopic activation and inactivation. Adopting a kinetic scheme of Nav gating that assumes preferential closed-state recovery from inactivation, a 1.7-fold acceleration of the rate constant of activation and a 1.4-fold acceleration of the rate constant of inactivation were sufficient to reproduce experimental observations with computer simulations. In addition, molecular dynamics simulations and molecular docking suggest that propofol binding involves interactions with gating machinery in the S4-S5 linker and external pore regions. Our findings show that propofol is primarily a positive gating modulator of prokaryotic Navs, which ultimately inhibits the channels by promoting activation-coupled inactivation.


Figures

Figure 1.
Figure 1.
Modulation of NaChBac inactivation gating by propofol. (A) Representative paired current families in the absence (control) and presence of 10 µM propofol. Paired scaled INa currents at 0 mV (top) and the voltage protocol (bottom) are shown to the right. (B) Time constants (τ) of inactivation versus voltage. Propofol reduced τInactivation at 2, 5, and 10 µM (n = 15–19) at all voltages (9.78E-10 < P < 0.015), with the exception of the 10 µM data point at −40 mV (P = 0.059). (C) Pre-pulse inactivation voltage protocol. (D) Pre-pulse inactivation curves of control and with propofol at 2, 5, and 10 µM (n = 7–11). Corresponding paired midpoint voltages (V1/2) of inactivation are shown below. Means are indicated in magenta. Error bars indicate ±SEM.
Figure 2.
Figure 2.
Propofol does not affect recovery from inactivation in NaChBac. (A) Time courses of recovery from inactivation. (B) Paired time constants (τ) of recovery in the absence (control) and presence of 2, 5, and 10 µM propofol (n = 6–8). Inset shows the voltage protocol. Means are indicated in magenta. Error bars indicate ±SEM.
Figure 3.
Figure 3.
Propofol does not act as a pore blocker in a non-inactivating NaChBac mutant. (A) Representative paired current families evoked from NaChBac T220A in the absence (control) and presence of 5 µM propofol. (B) Normalized current-voltage (I-V) relationships of control and 5 µM propofol from NaChBac T220A. Currents were normalized to the maximum peak current of the paired control for each cell (n = 11). Inset shows the voltage protocol. (C and D) Representative paired current families (C) and normalized I-V relationships from NaChBac WT (D; n = 15) are shown to provide a side-by-side comparison. Error bars indicate ±SEM.
Figure 4.
Figure 4.
Propofol induces a relative stabilization of the open state in both WT and non-inactivating NaChBac. (A) WT (n = 15–19): Normalized peak G-V relationships in the absence (control) and presence of 2, 5, and 10 µM propofol, with corresponding paired V1/2s of activation shown below. (B) T220A (n = 11): Normalized G-V relationships of control and with 5 µM propofol (left) and corresponding paired V1/2s of activation (right). Means are indicated in magenta. Voltage protocols are the same as those in Fig. 3. Error bars indicate ±SEM.
Figure 5.
Figure 5.
Propofol preferentially accelerates macroscopic activation in both WT and non-inactivating NaChBac. (A and B) Representative scaled INa currents at −40 mV (top) and deactivation currents at −120 mV (bottom) evoked from WT (A) and T220A (B), in the absence and presence of 10 or 5 µM propofol, respectively. Inset shows the deactivation voltage protocol used for both WT and T220A. INa currents were evoked using the voltage protocols shown in Fig. 3 B. (C and D) Time constants (τ) of activation (circles, right side) and deactivation (triangles, left side) versus voltage. Propofol reduced τActivation in WT (n = 15–19) and T220A (n = 10) at all concentrations and voltages shown compared with control (2.74E-8 < P < 0.035), with the exception of T220A at +40 mV (P = 0.10). In WT (n = 5–6), 2 and 5 µM propofol did not increase τDeactivation, except for 2 µM at −60 mV (P = 3.40E-4); 10 µM increased τDeactivation at all voltages shown (5.47E-4 < P < 0.015). In T220A (n = 6), 5 µM propofol increased τDeactivation (4.30E-4 < P < 0.035), with the exception of −110 and −70 mV (P = 0.10 and 0.093, respectively). Error bars indicate ±SEM. In most cases, error bars are smaller than symbols.
Figure 6.
Figure 6.
Modulation of gating by propofol is conserved in NavMs. (A) Representative paired current families evoked from NavMs in the absence (control) and presence of 5 µM propofol. Inset shows representative paired scaled INa currents at 0 mV. (B) Voltage protocols for voltage-dependent activation (top) and pre-pulse inactivation (bottom). (C) Time constants (τ) of inactivation versus voltage (n = 20). 5 µM propofol reduced τInactivation at all voltages shown (3.66E-9 < P < 0.002). (D and E) Normalized peak G-V relationships (D; n = 20) and normalized pre-pulse inactivation curves (E; n = 12) of control and with 5 µM propofol. Corresponding paired V1/2s of activation and inactivation are shown below. Means are indicated in magenta. (F) Time course of recovery from inactivation in the absence and presence of 5 µM propofol (left). Corresponding paired time constants (τ) of recovery from inactivation (top), τControl = 1170 ± 109 ms, τ5 µM = 1436 ± 136 ms (n = 8), and the voltage protocol (bottom) are shown to the right. Error bars indicate ±SEM.
Figure 7.
Figure 7.
Kinetic modeling of NaChBac inactivation properties. (A) Proposed kinetic scheme in the absence (control) and presence of propofol. Model parameters are given in Table S1. (B–E) IonChannelLab simulation results of the proposed kinetic schemes. Simulated current families in the absence and presence of propofol (B). Inset shows scaled currents at +20 mV. Time constants (τ) of inactivation versus voltage of control and with propofol (C). Pre-pulse inactivation curves (D) and recovery from inactivation time courses (E) in the absence and presence of propofol.
Figure 8.
Figure 8.
Kinetic modeling of NaChBac activation properties. Model parameters are the same as in Fig. 7 and are given in Table S1. (A) Peak G-V relationships in the absence (control) and presence of propofol. (B and C) Simulated, scaled activation currents at −40 mV (B) and deactivation tail currents at −120 mV (C) of control and with propofol. (D) Time constants of activation (circles, right side) and deactivation (triangles, left side) versus voltage, in the absence and presence of propofol.
Figure 9.
Figure 9.
MD simulations and molecular docking in NavMs. (A) Side view of potential propofol binding sites in NavMs identified by MD simulations. Alternating subunits are shown in dark/light blue. (B and D) Zoomed-in surface views of the extracellular (B) and S4–S5 linker binding sites (D). (C and E) The top six propofol binding poses at the extracellular binding site (C) and top 10 propofol binding poses at the S4–S5 linker binding site (E), from molecular docking simulations. (F) Time courses of the minimum distance between the bound propofol molecule and the residues lining the two binding sites, from MD simulations. For both sites, propofol binding occurred in three of the four subunits, denoted as Linker 1–3 and Extracellular 1–3; distances are not reported for the unoccupied subunit. Residues lining the S4–S5 linker site (left) consisted of V134, N212, and A221, and those lining the extracellular site (right) consisted of R186, M189, and K166.

Comment in

  • Propofol's paradox, explained.
    Sedwick C. Sedwick C. J Gen Physiol. 2018 Sep 3;150(9):1231-1232. doi: 10.1085/jgp.201812197. Epub 2018 Aug 16. J Gen Physiol. 2018. PMID: 30115662 Free PMC article.

References

    1. Ahern C.A., Payandeh J., Bosmans F., and Chanda B.. 2016. The hitchhiker’s guide to the voltage-gated sodium channel galaxy. J. Gen. Physiol. 147:1–24. 10.1085/jgp.201511492 - DOI - PMC - PubMed
    1. Aldrich R.W., and Stevens C.F.. 1987. Voltage-dependent gating of single sodium channels from mammalian neuroblastoma cells. J. Neurosci. 7:418–431. 10.1523/JNEUROSCI.07-02-00418.1987 - DOI - PMC - PubMed
    1. Arcisio-Miranda M., Muroi Y., Chowdhury S., and Chanda B.. 2010. Molecular mechanism of allosteric modification of voltage-dependent sodium channels by local anesthetics. J. Gen. Physiol. 136:541–554. 10.1085/jgp.201010438 - DOI - PMC - PubMed
    1. Armstrong C.M. 1966. Time course of TEA(+)-induced anomalous rectification in squid giant axons. J. Gen. Physiol. 50:491–503. 10.1085/jgp.50.2.491 - DOI - PMC - PubMed
    1. Armstrong C.M. 1971. Interaction of tetraethylammonium ion derivatives with the potassium channels of giant axons. J. Gen. Physiol. 58:413–437. 10.1085/jgp.58.4.413 - DOI - PMC - PubMed

Publication types

Associated data