. 2018 Aug 7;115(32):E7486-E7494.
doi: 10.1073/pnas.1720342115. Epub 2018 Jul 17.

Mavacamten stabilizes an autoinhibited state of two-headed cardiac myosin

Affiliations

Mavacamten stabilizes an autoinhibited state of two-headed cardiac myosin

John A Rohde et al. Proc Natl Acad Sci U S A. .

Abstract

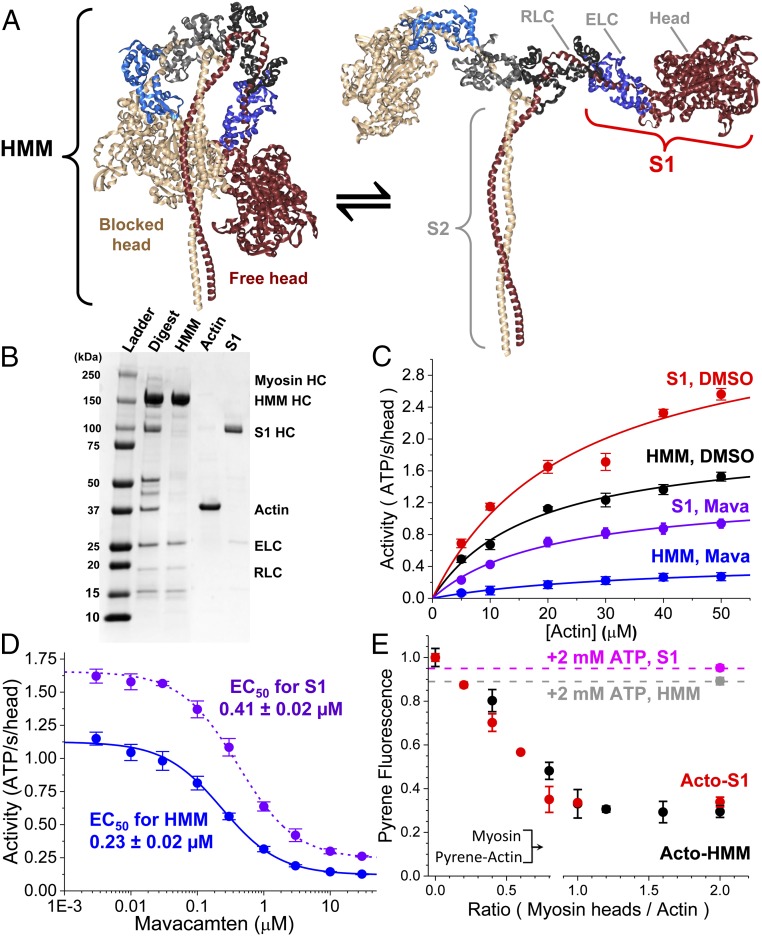
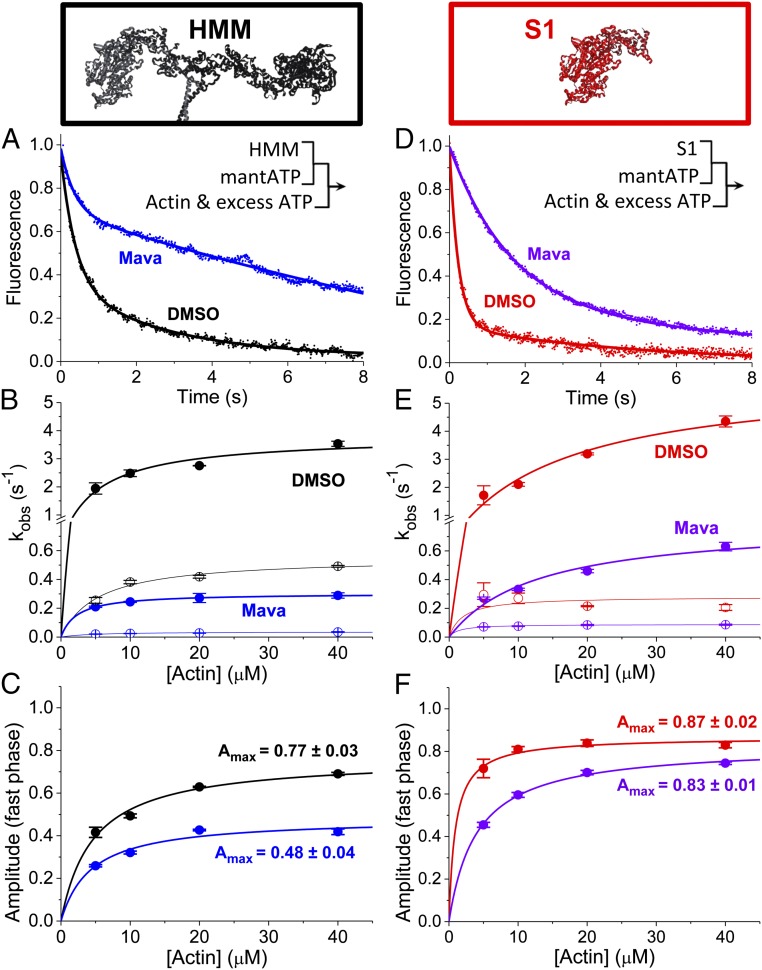
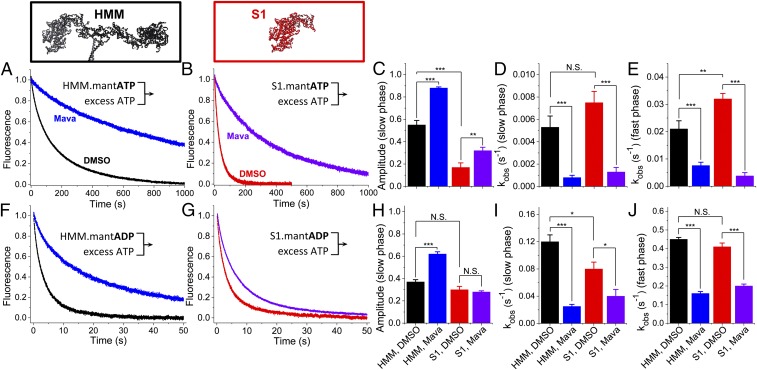
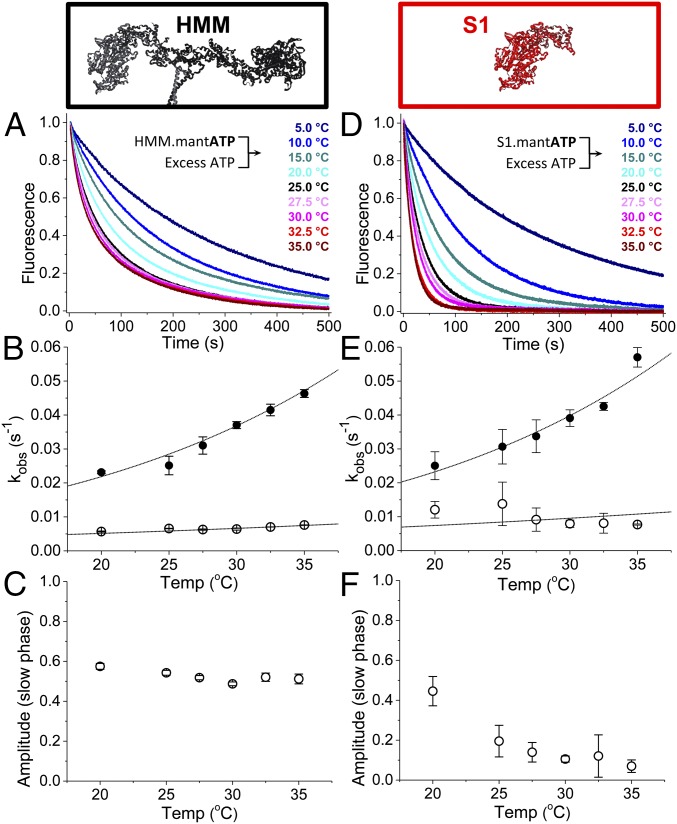
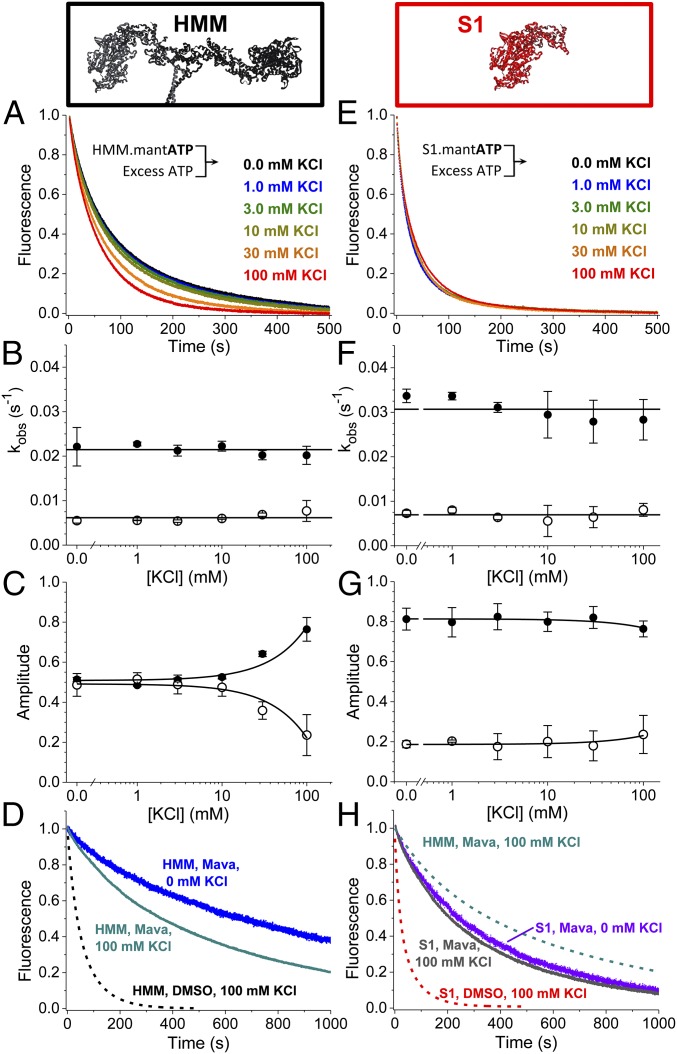
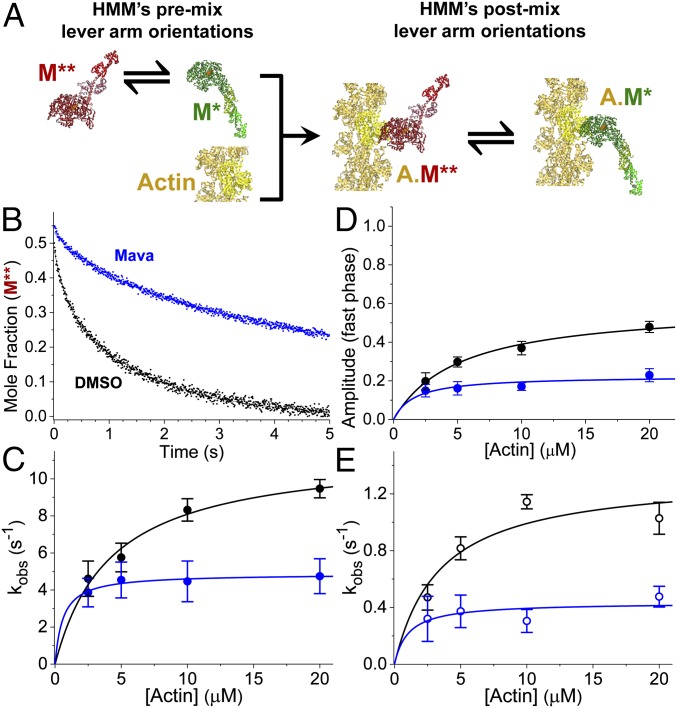
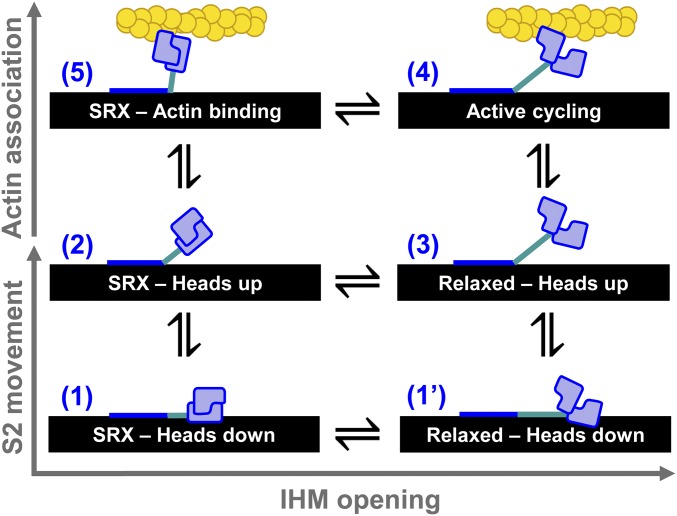
We used transient biochemical and structural kinetics to elucidate the molecular mechanism of mavacamten, an allosteric cardiac myosin inhibitor and a prospective treatment for hypertrophic cardiomyopathy. We find that mavacamten stabilizes an autoinhibited state of two-headed cardiac myosin not found in the single-headed S1 myosin motor fragment. We determined this by measuring cardiac myosin actin-activated and actin-independent ATPase and single-ATP turnover kinetics. A two-headed myosin fragment exhibits distinct autoinhibited ATP turnover kinetics compared with a single-headed fragment. Mavacamten enhanced this autoinhibition. It also enhanced autoinhibition of ADP release. Furthermore, actin changes the structure of the autoinhibited state by forcing myosin lever-arm rotation. Mavacamten slows this rotation in two-headed myosin but does not prevent it. We conclude that cardiac myosin is regulated in solution by an interaction between its two heads and propose that mavacamten stabilizes this state.

Keywords: allosteric inhibitor; cardiac myosin; hypertrophic cardiomyopathy; mavacamten; superrelaxed state.


Conflict of interest statement

The authors declare no conflict of interest.

Figures

Fig. 1.
Fig. 1.
Steady-state ATPase activity of purified cardiac myosin fragments HMM and S1. (A) Proposed structural isomerization of HMM between a sequestered IHM [Protein Data Bank (PDB) ID code 5TBY] (Left) and splayed heads (Right). (B) SDS/PAGE gel stained with Coomassie blue demonstrating the purification of α-chymotryptic–digested HMM and S1 myosin fragments, removing contaminating actin. HC, heavy chain of myosin. (C) Steady-state, actin-activated ATPase activity of 0.2 µM S1 with DMSO (red) or 10 μM mava (purple) and of 0.2 μM HMM with DMSO (black) or 10 µM mava (blue). ActivityS1,DMSO = (3.6 ± 0.4⋅s−1) × [Actin]/(24.4 ± 7.4 µM + [Actin]). ActivityHMM,DMSO = (2.02 ± 0.12⋅s−1) × [Actin]/(17.6 ± 2.8 µM + [Actin]). ActivityS1,Mava = (1.35 ± 0.08⋅s−1) × [Actin]/(20.6 ± 3.1 µM + [Actin]). ActivityHMM,Mava = (0.48 ± 0.04⋅s−1) × [Actin]/(35.3 ± 6.3 µM + [Actin]). n = 6 replicates for each actin concentration. (D) Mava is a potent inhibitor of 0.2 µM HMM and S1 during actin-activated, steady-state ATPase cycling; [Actin] = 20 µM. n = 4 replicates. (E) [S1] varied from 0 to 2.0 μM, and [HMM] varied from 0 to 1.0 µM (0- to 2.0-μM heads) mixed with 1.0 µM pyrene-labeled actin. Final concentrations are listed. The HMM and S1 used in this study release from pyrene-labeled actin with the addition of 2.0 mM ATP; FS1 = 0.95 ± 0.1 (magenta) and FHMM = 0.89 ± 0.02 (gray). n = 4 replicates. All experiments were performed in 10 mM Tris (pH 7.5) at 25 °C, 2 mM MgCl2, and 1.0 mM DTT, unless otherwise noted. Error bars indicate SEM.
Fig. 2.
Fig. 2.
HMM data are shown in AC; S1 data are shown in DF. (A) Actin-activated single-ATP turnover by 0.1 µM HMM (DMSO control in black, 30 µM mava in blue), mixed with 2.0 μM mant-ATP and 10 μM actin and 2.0 mM MgATP by sequential stopped flow. Premix concentrations are listed. (Inset) Sequential stopped-flow mix schematic. (B and C) Two-exponential fits showing rates (B) and amplitudes (C) with varied [actin]. (D) S1 (0.2 µM) (DMSO in red, 30 µM mava in violet), mixed with 2.0 μM mant-ATP and 10 μM actin and 2.0 mM MgATP by sequential stopped flow. (E and F) Two exponential fits showing rates (E) and amplitudes (F), with varied [actin]. n = 6 replicates, SI Appendix, Table S1. Error bars indicate SEM.
Fig. 3.
Fig. 3.
Basal nucleotide exchange in the absence of actin. (A and B) Basal single-ATP turnover by stopped-flow mix of 0.2 µM HMM (A) or 0.4 µM S1 (B), mixed with 4.0 μM mant-ATP and then chased with 2.0 mM MgATP. Blue and violet traces indicate 30 µM mava. (CE) Amplitudes (C) and rates (D and E) of the two-exponential fits of A and B. (F and G) Basal single ADP dissociation from HMM (F) or S1 (G), mixed with 4.0 μM mant-ADP and then chased with 2.0 mM MgATP. (HJ) Amplitudes (H) and rates (I and J) of the two-exponential fits of F and G. n = 9 replicates. Two-exponential fits are reported in SI Appendix, Table S1. Error bars indicate SEM. **P ≤ 0.01, ***P ≤ 0.001; N.S. (not significant), P > 0.05.
Fig. 4.
Fig. 4.
Temperature dependence of basal single-ATP turnover. (A and D) 0.4 µM HMM (A) or 0.8 µM S1 (D) mixed with 8.0 µM mant-ATP and then mixed with 2.0 mM MgATP. These data were fit to a two-exponential function. (B) The rates for HMM were fit to the Erying equation: kfast = temperature in Kelvin (T) × exp(−[35.3 kJ/mol]/RT + 5.3)⋅s−1⋅K−1; kslow = T × exp(−[15.9 kJ/mol]/RT − 4.3)⋅s−1⋅K−1. Closed circles indicate the fast phase; open circles indicate the closed phase. (C) The amplitudes of the slow phases depicted in A. (E) The rates from the two-exponential fit for S1 were also fit to the Erying equation: kfast = T × exp(−[30.9 kJ/mol]/RT + 3.6)⋅s−1⋅K−1; kslow = T × exp(−[15.1 kJ/mol]/RT − 3.9)⋅s−1⋅K−1. (F) The amplitudes of the slow phases depicted in D. n = 4 replicates for each temperature. Error bars indicate SEM.
Fig. 5.
Fig. 5.
Ionic strength dependence of basal ATP turnover. (A and E) HMM (0.4 µM) (A) or 0.8 µM S1 (E) was mixed with 8.0 µM mant-ATP and then was mixed with 2.0 mM MgATP. Data best fit to two exponentials. (B) The rates of HMM’s basal mant-ATP turnover are relatively constant over these [KCl]; the average values are depicted by the horizontal line. Closed circles represent the fast phase; open circles represent the slow phase. (C) The amplitude of the fast phase increases with increasing [KCl]. Closed circles represent the fast phase; open circles represent the slow phase. Linear fits show trends. (D) In the presence of mava, HMM is sensitive to increasing ionic strength (compare blue and dark cyan traces). (F and G) The rates (F) and amplitudes (G) of S1’s basal mant-ATP turnover are relatively constant. Linear fits show trends. (H) S1 in the presence of mava is insensitive to changes in [KCl] (compare violet and gray traces), consistent with S1 in the absence of mava (E). n = 4 for replicates for each [KCl]. Fits are reported in SI Appendix, Table S1. Error bars indicate SEM.
Fig. 6.
Fig. 6.
Mava inhibits lever-arm rotation in HMM during actin activation as detected with (TR)2FRET. (A) Stopped-flow mix of fluorescently labeled myosin with actin to detect FRET between the lever arm and the catalytic domain of cardiac HMM during the actin-activated power stroke. An equilibrium of structural states for myosin (green or red) are depicted before and after stopped-flow mixing. Fluorophores are located on the RLC and nucleotide. S1 is shown for simplicity; HMM was used. (B) Mole fraction of the M** pre–power-stroke structural state detected with (TR)2FRET. Structural transients are fit to two exponentials. (C) Observed rate constants for the fast phase of the actin-activated power stroke over a range of [Actin]. kobs,fast,DMSO = 11.5⋅s−1[Actin]/(4.2 μM + [Actin]); kobs,fast,Mava = 4.9⋅s−1[Actin]/(0.6 μM + [Actin]). (D) Amplitude of the fast phase: Afast,DMSO = 0.59[Actin]/(5.1 μM + [Actin]); Afast,Mava = 0.23[Actin]/(1.6 μM + [Actin]). (E) Slow phase: kobs.slow,DMSO = 1.3⋅s−1[Actin]/(3.4 μM + [Actin]); kobs,slow,Myk461 = 0.4⋅s−1[Actin]/(1.0 μM + [Actin]). n = 6 replicates of biochemically independent mixes, each averaging 6–10 shots; two separate preparations of cardiac HMM. Error bars indicate SEM.
Fig. 7.
Fig. 7.
Structural model for thick-filament regulation informed by data in this study. (1) EM data support an IHM folded back against the thick filament (black). (1′) The heads may open while the S2 is on the thick filament. (2) Hypothesized state based on our detection of an SRX-like state in HMM. (3) Relaxed myosin with heads splayed and ready to interact with actin. (4) Active actomyosin cycling. (5) Hypothesized state based our detection of actin accelerating the autoinhibited basal ATP turnover of HMM and thus likely unfolding the IHM.

References

    1. Maron BJ, et al. Prevalence of hypertrophic cardiomyopathy in a general population of young adults. Echocardiographic analysis of 4111 subjects in the CARDIA Study. Coronary Artery Risk Development in (Young) Adults. Circulation. 1995;92:785–789. - PubMed
    1. Spudich JA. Hypertrophic and dilated cardiomyopathy: Four decades of basic research on muscle lead to potential therapeutic approaches to these devastating genetic diseases. Biophys J. 2014;106:1236–1249. - PMC - PubMed
    1. Green EM, et al. A small-molecule inhibitor of sarcomere contractility suppresses hypertrophic cardiomyopathy in mice. Science. 2016;351:617–621. - PMC - PubMed
    1. Kawas RF, et al. A small-molecule modulator of cardiac myosin acts on multiple stages of the myosin chemomechanical cycle. J Biol Chem. 2017;292:16571–16577. - PMC - PubMed
    1. Stern JA, et al. A small molecule inhibitor of sarcomere contractility acutely relieves left ventricular outflow tract obstruction in feline hypertrophic cardiomyopathy. PLoS One. 2016;11:e0168407. - PMC - PubMed

Publication types

MeSH terms