. 2018 Aug 1;32(15-16):1085-1100.
doi: 10.1101/gad.314096.118. Epub 2018 Jul 17.

Root stem cell niche organizer specification by molecular convergence of PLETHORA and SCARECROW transcription factor modules

Affiliations

Root stem cell niche organizer specification by molecular convergence of PLETHORA and SCARECROW transcription factor modules

Akie Shimotohno et al. Genes Dev. .

Abstract

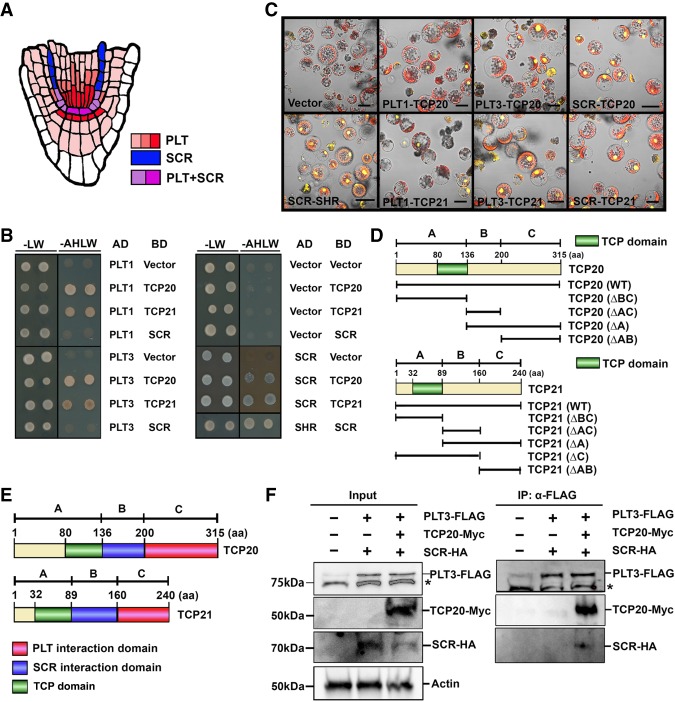
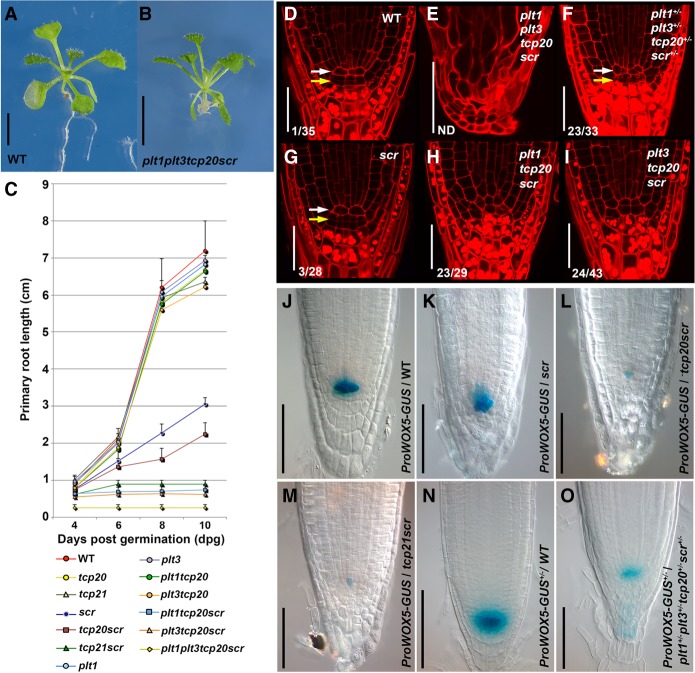
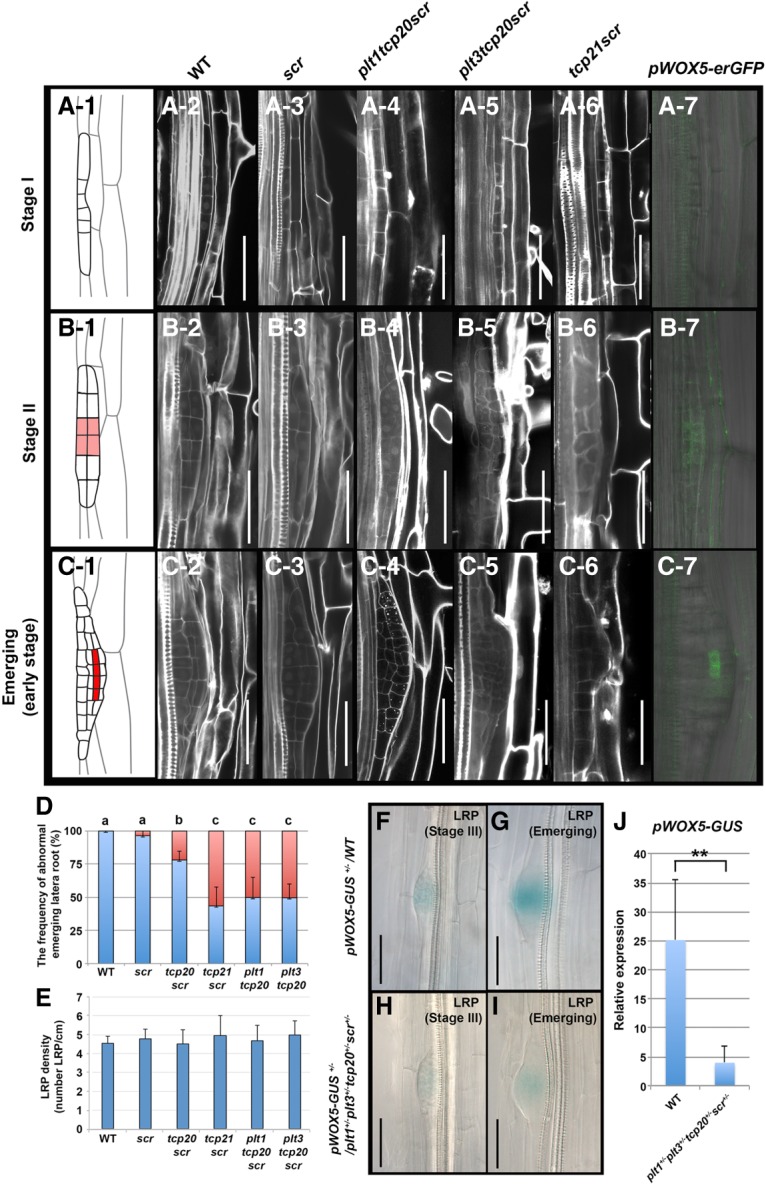
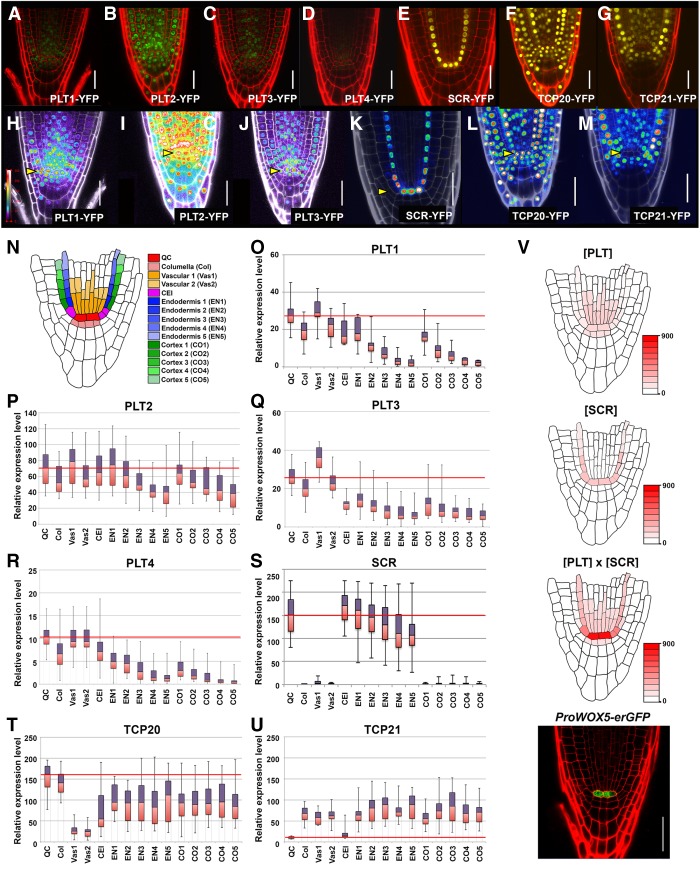
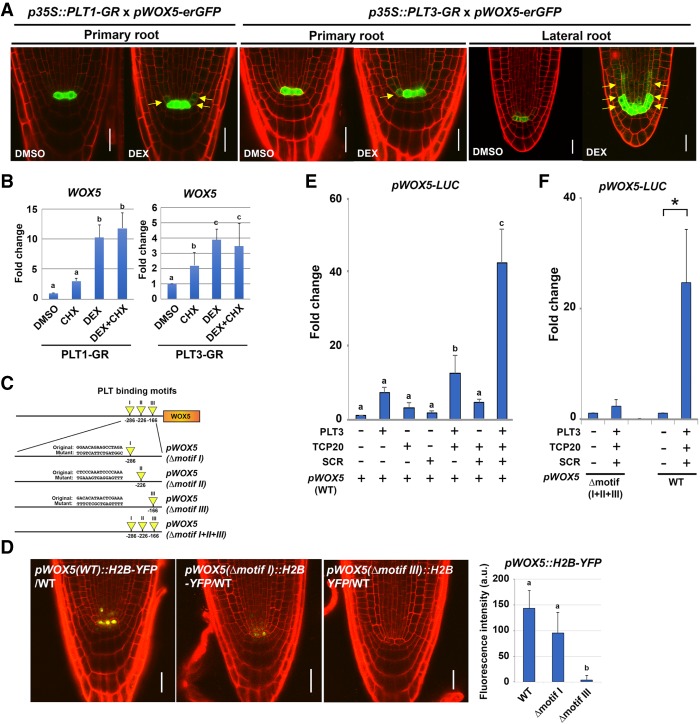
Continuous formation of somatic tissues in plants requires functional stem cell niches where undifferentiated cells are maintained. In Arabidopsis thaliana, PLETHORA (PLT) and SCARECROW (SCR) genes are outputs of apical-basal and radial patterning systems, and both are required for root stem cell specification and maintenance. The WUSCHEL-RELATED HOMEOBOX 5 (WOX5) gene is specifically expressed in and required for functions of a small group of root stem cell organizer cells, also called the quiescent center (QC). PLT and SCR are required for QC function, and their expression overlaps in the QC; however, how they specify the organizer has remained unknown. We show that PLT and SCR genetically and physically interact with plant-specific teosinte-branched cycloidea PCNA (TCP) transcription factors to specify the stem cell niche during embryogenesis and maintain organizer cells post-embryonically. PLT-TCP-SCR complexes converge on PLT-binding sites in the WOX5 promoter to induce expression.

Keywords: Arabidopsis; PLT-TCP-SCR complexes; WUSCHEL-RELATED HOMEOBOX 5; organizer; quiescent center; stem cell niche.


Figures

Figure 1.
Figure 1.
Protein interactions between TCPs and PLTs/SCR. (A) Scheme of PLTs and SCR protein expression in the Arabidopsis root apical meristem. PLTs are expressed broadly across the stem cell niche in the root (red), whereas SCR expression is restricted in the endodermis and QC cells (blue). The PLT and SCR expression domains overlap predominantly in QC cells and CEIs (purple). (B) Y2H assays between TCP20 or TCP21 and PLT1 or PLT3 or SCR were performed on SD/−Leu−Trp− Ade−His (−AHLW) medium for 4 d. SD/−Leu−Trp (−LW) medium was used as a growth control. Vector combination was used as a negative control, whereas SCR–SHR interaction was used as a positive control. (C) BiFC assay of the interaction between full-length PLT1 or PLT3 or SCR and TCP20 or TCP21 in Arabidopsis mesophyll protoplasts. Vector combination (vector) was used as a negative control, whereas SCR–SHR was used as a positive control. Bar, 30 µm. (D) Schematic presentations of the protein domains for truncated TCP20 and TCP21 used in Supplemental Figure 1, A–C. TCP domains are indicated in green. The numbers at the top indicate amino acids (aa). (E) The deduced domains of TCP protein binding to PLT (red), SCR (blue), and TCP domain (green). (F) Coimmunoprecipitation assay showing the positive interaction of PLT3–TCP20–SCR. 35S::PLT3-3xFlag, 35S::SCR-7xHA, and 35S::TCP20-10xMyc constructs were cotransfected in Arabidopsis mesophyll protoplasts and subjected to immunoprecipitation with anti-Flag antibody (IP:α-Flag), shown in the right panel. The left panel shows total cell lysate (input) from Arabidopsis mesophyll protoplasts expressing PLT3-Flag, SCR-HA, and TCP20-Myc followed by Western blot analysis. The presence of PLT3, SCR, and TCP20 was determined by anti-Flag, anti-HA, and anti-Myc antibody, respectively. Anti-actin antibody was used as a loading control. The asterisks indicate nonspecific bands. The original gel blot source is available in Supplemental Figure 1E.
Figure 2.
Figure 2.
The effect of plt, tcp, and scr genetic interaction on growth and stem cell maintenance in the Arabidopsis root. (A,B) Seedlings of wild-type (A) and the plt1-1−/−plt3-2−/−tcp20-1−/−scr-3−/− quadruple mutant (B) 10 d after germination (dag). (C) Primary root length measurements of indicated wild-type and mutant seedlings from 4 to 10 dag. Values are average lengths (means ± SD) of >25 seedling roots per genotype per time point. (DI) The root apical meristem of 2-dag seedlings in wild-type (D), plt1−/−plt3−/−tcp20−/−scr−/− (E), plt1+/−plt3+/− tcp20+/−scr+/− (F), plt1+/+plt3+/+tcp20+/+scr−/− (G), plt1−/−plt3+/+tcp20−/−scr−/− (H), and plt1+/+plt3−/−tcp20−/−scr−/− (I). Arrows indicate the QC (white) and columella stem cells (CSCs; yellow), respectively. Numbers indicate roots with additional QC divisions of total roots examined. (ND) Not determined. (JM) pWOX5-GUS expression levels in Columbia-0 (Col-0; J), scr-3−/− (K), tcp20-1−/−scr-3−/− (L), and tcp21-1−/−scr-3−/− (M) roots. (N,O) GUS expression levels in pWOX5-GUS+/− wild-type (N) and pWOX5-GUS+/−plt1+/−plt3+/− tcp20+/− scr-3+/− (O) roots. The images displayed in JO are representative of at least three independent experiments with >10 seedlings examined that obtained similar results. Bars: A,B, 1 cm; DI, 30 µm; JO 40 µm.
Figure 3.
Figure 3.
Genetic interaction among PLT, TCP, and SCR during embryogenesis. (A) The wild-type (Col-0) and plt1-3−/−plt3-1−/−tcp20-1−/−scr-3−/− embryos at the dermatogen to globular stages. Original cleared images (left) and merged images with tracings of embryos (right) are shown. Bars, 20 µm. (B) Expression patterns of PLT3-YFP, SCR-YFP, TCP20-YFP, and pWOX5::H2B-YFP at the transition between the dermatogen and early globular stages (left and middle) and expression heat maps during the late globular/transition states (right) are shown. Bars, 10 µm. (C) YFP signal intensities of PLT1-YFP, PLT3-YFP, SCR-YFP, TCP20-YFP, TCP21-YFP, and pWOX5::H2B-YFP during the octant to transition/heart stages exemplified in B. Box length represents the range in which the central 50% of the values fall, with the box edges at the lower (orange) and upper (gray) quartiles. The whiskers indicate the highest and lowest values. YFP fluorescence intensities (n > 15) in the QC (or its precursor cells in the octant and dermatogen stages) were quantified using ImageJ. (D) Cellular anatomies of the radicle in wild-type and scr-3−/−, plt1-1−/−tcp20-1−/−scr-3−/−, plt3-1−/−tcp20-1−/−scr-3−/−, tcp20-1−/−scr-3−/−, and plt1-3−/−plt3-1−/−tcp20-1−/−scr-3−/− homozygous mature embryos. The numbers of embryos that showed improper cell divisions in the QC per examined total embryos are indicated in the respective panels. (Yellow arrows) Position of the QC; (dots) positions of the columella cell layers. Bars, 30 µm.
Figure 4.
Figure 4.
The lateral root formation in various plt–tcp–scr mutant combinations. (A-1C-7) Early developmental stages during lateral root initiation in stage I (A-1–A-7), stage II (B-1–B-7), and emerging (C-1–C-7). Cell lineage maps are shown in A-1 (stage I), B-1 (stage II), and C-1 (emerging). (B-1,C-1) QC progenitor cells appear from late stage II onward (highlighted in red). Morphologies of stage I, stage II, and the emerging stage present in wild-type Col-0 (A-2,B-2,C-2), scr-3 (A-3,B-3,C-3), plt1-3−/−tcp20-1−/−scr-3−/− (A-4,B-4,C-4), plt3-1−/−tcp20-1−/− scr-3−/− (A-5,B-5,C-5), and tcp21-1−/− scr-3−/− (A-6,B-6,C-6), respectively. pWOX5-erGFP expression is observed in stage II (B-7) and the emerging stage (C-7) but is absent in stage I (A-7) wild-type primordium. Bars, 50 µm. (D) The frequencies (percentage) of the abnormal LRPs on the primary root from 8-dag wild-type and plt–tcp–scr mutant combination lines, as indicated. (Blue bar) Normal primordium; (red bar) abnormal primordium. Error bars show SDs. The letters above the bars (a, b, c) indicate significant differences (one-way ANOVA and Tukey's test, P < 0.01). Results are means ± SD, n = 15 per line. (E) Statistical analysis of the number of lateral roots per centimeter of the primary root from the 8-dag wild-type and the series of plt–tcp–scr mutant combinations. Results are means ± SD, n = 15, no significant differences by one-way ANOVA. (FI) Expression levels of pWOX5-GUS+/− in LRPs of wild-type (F,G) and plt1-3+/− plt3-1+/−tcp20-1+/− scr-3+/− mutant (H,I) backgrounds. (F,H) Stage III. (G,I) Emerging LRP. Bar, 40 µm. (J) Statistical analysis of pWOX5-GUS+/− expression in FI. Results are means ± SD. n = 46 in wild-type; n = 40 in plt1-3+/−plt3-1+/−tcp20-1+/−scr-3+/−. (**) P < 0.01, compared with the corresponding values of wild-type seedlings; two-tailed t-tests.
Figure 5.
Figure 5.
PLT1, PLT3, and SCR protein levels in and around the stem cell niche. (AG) pPLT1::PLT1-YFP, pPLT2::PLT2-YFP, pPLT3::PLT3-YFP, pPLT4::PLT4-YFP, pSCR::SCR-YFP, pTCP20::TCP20-YFP, and pTCP21::TCP21-YFP expression in 2-dag root apical meristems. All fluorescence signals of PLT1-YFP (A), PLT2-YFP (B), PLT3-YFP (C), and PLT4-YFP (D) seedlings roots at 2 dag were imaged using identical laser settings. (HM) Heat maps showing fluorescence intensities corresponding to AG. PLT1-YFP (H), PLT2-YFP (I), PLT3-YFP (J), SCR-YFP (K), TCP20-YFP (L), and TCP21-YFP (M) expression patterns are shown. (Yellow arrowheads) Positions of the QC cells. Bar, 20 µm. (N) Schematic transverse section depicting Arabidopsis root stem cells and their progeny. (OU) Box plot of average fluorescence intensities over the root stem cell niche of 2-dag seedlings for all four PLTs, SCR, and two TCPs according to the color code in N. The red lines across the middle of the boxes identify the median sample values in QC cells. The number of seedlings used in these experiments: pPLT1::PLT1-YFP (n = 19; O), pPLT2::PLT2-YFP (n = 13; P), pPLT3::PLT3-YFP (n = 45; Q), pPLT4::PLT4-YFP (n = 20; R), pSCR::SCR-YFP (n = 42; S), pTCP20::TCP20-YFP (n = 18; T), and pTCP21::TCP21-YFP (n = 20; U). (V) The overlap between PLT and SCR using expression levels from O, Q, and S and synergy data from Figure 6E ([PLT] × [SCR]) establishes a stronger enriched domain of QC specification and WOX5 expression in the stem cell niche than PLT or SCR alone ([PLT] or [SCR]). Red implies the highest expression of WOX5. The actual pWOX5-erGFP expression pattern in wild type (ProWOX5-erGFP). Bar, 30 µm.
Figure 6.
Figure 6.
PLTs directly induce WOX5 expression in cooperation with SCR and TCP proteins. (A) pWOX5-erGFP expression alterations by short-time PLT induction. Confocal images were taken after 3 h of 10 µM dexamethasone (DEX) treatment of 35S::PLT1-GR or 35S::PLT3-GR. (Yellow arrows) Ectopically expressed GFP. Seedlings at 2 dag and 5 dag were used for primary root primordium and LRP observations, respectively. Bars, 20 µm. (B) Results of quantitative RT–PCR assays showing WOX5 mRNA levels in Arabidopsis 4-dag seedling roots after 35S::PLT1-GR (left) or 35S::PLT3-GR (right) induction, respectively. The Arabidopsis roots were first treated with mock or 10 µM cycloheximide (CHX) for 15 min and then transferred and induced for 3 h on 10 µM DEX or 10 µM DEX plus CHX plates, respectively. Results are means ± SD. n ≥ 3. One-way ANOVA (Tukey's-Kramer test) was performed. Statistically significant differences are marked by lowercase letters. P < 0.01. (C) Diagrams of mutation analysis of the PLT-binding sites in the 1.6-kb WOX5 promoter. Yellow arrowheads indicate the positions of the indicated sequences of predicted PLT-binding motifs, and the numbers below the promoter represent nucleotide positions upstream of the transcription start site. For the mutated versions (Δmotif), the PLT binding motifs (Original) were replaced with the indicated random oligonucleotides (Mutant). (D) Expression of pWOX5::H2B-YFP variants from C in 5-dag wild-type seedlings. Bars, 20 µm. (Bottom right) Relative YFP expression levels in the QC are quantified. Results are means ± SD. n ≥ 9. One-way ANOVA (Tukey's-Kramer test) was performed. Statistically significant differences are marked by lowercase letters. P < 0.01. (E) Transient luciferase expression analysis in Arabidopsis mesophyll protoplasts normalized by vector control showing enhanced WOX5 promoter activity in 35S::PLT3-3xFlag, 35S::TCP20-10xMyc, and 35S::SCR-7xHA triple-infected protoplasts. Results are means ± SD. n ≥ 12. One-way ANOVA (Tukey's-Kramer test) was performed. Statistically significant differences are marked by lowercase letters. P < 0.01. (F) Transient luciferase expression analysis in Arabidopsis mesophyll protoplasts showing that PLT-binding motifs in the WOX5 promoter are crucial for activation by the PLT3, TCP20, and SCR protein combination. Protoplasts were prepared from 4-wk-old plants transfected with a pWOX5::LUC or pWOX5(Δmotif I+II+III)::LUC. All measurements were normalized to the cotransfected p35S::renilla luciferase (rLUC) activity. Results are means ± SD. n ≥ 3. Two-tailed t test, P < 0.05.

References

    1. Aggarwal P, Gupta MD, Joseph AP, Chatterjee N, Srinivasan N, Nath U. 2010. Identification of specific DNA binding residues in the TCP family of transcription factors in Arabidopsis. Plant Cell 22: 1174–1189. - PMC - PubMed
    1. Aguilar-Martínez JA, Sinha N. 2013. Analysis of the role of Arabidopsis class I TCP genes AtTCP7, AtTCP8, AtTCP22, and AtTCP23 in leaf development. Front Plant Sci 4: 1–13. - PMC - PubMed
    1. Aida M, Beis D, Heidstra R, Willemsen V, Blilou I, Galinha C, Nussaume L, Noh YS, Amasino R, Scheres B. 2004. The PLETHORA genes mediate patterning of the Arabidopsis root stem cell niche. Cell 119: 109–120. - PubMed
    1. Benfey PN, Linstead PJ, Roberts K, Schiefelbein JW, Hauser MT, Aeschbacher RA. 1993. Root development in Arabidopsis: four mutants with dramatically altered root morphogenesis. Development 119: 57–70. - PubMed
    1. Bennett T, Scheres B. 2010. Root development-two meristems for the price of one? Curr Top Dev Biol 91: 67–102. - PubMed

Publication types

MeSH terms

LinkOut - more resources