. 2018 Jul 17;9(1):2759.
doi: 10.1038/s41467-018-05134-3.

Single cell transcriptome profiling of retinal ganglion cells identifies cellular subtypes

Affiliations

Single cell transcriptome profiling of retinal ganglion cells identifies cellular subtypes

Bruce A Rheaume et al. Nat Commun. .

Erratum in

Abstract

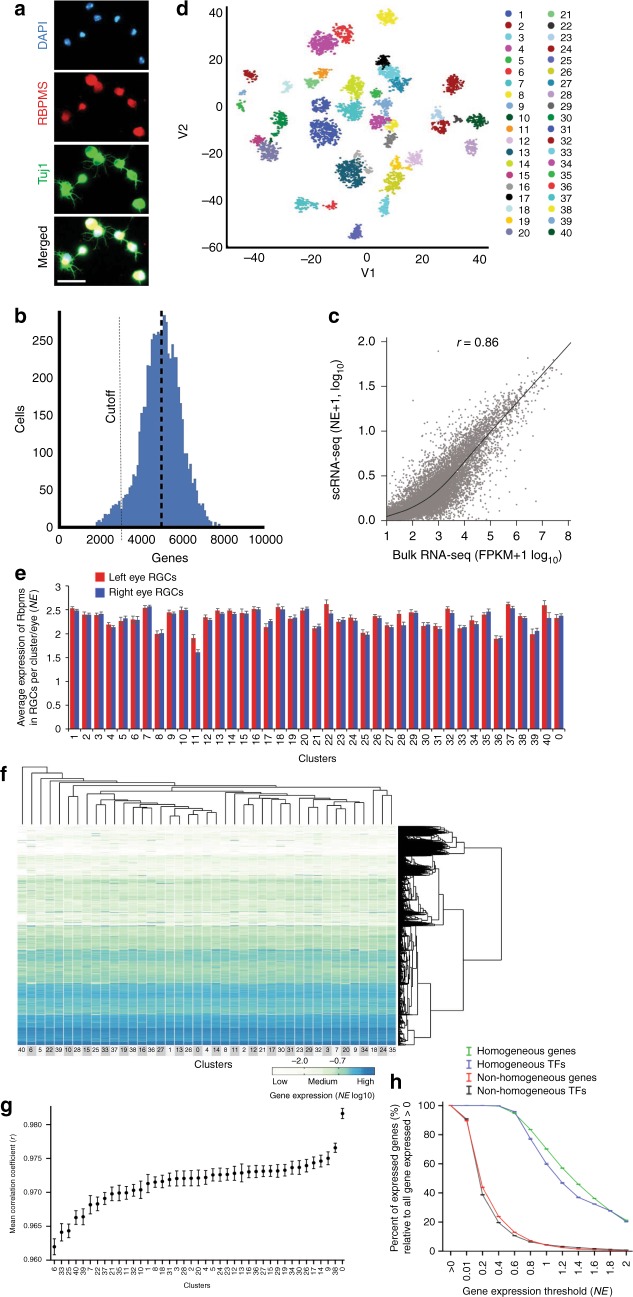
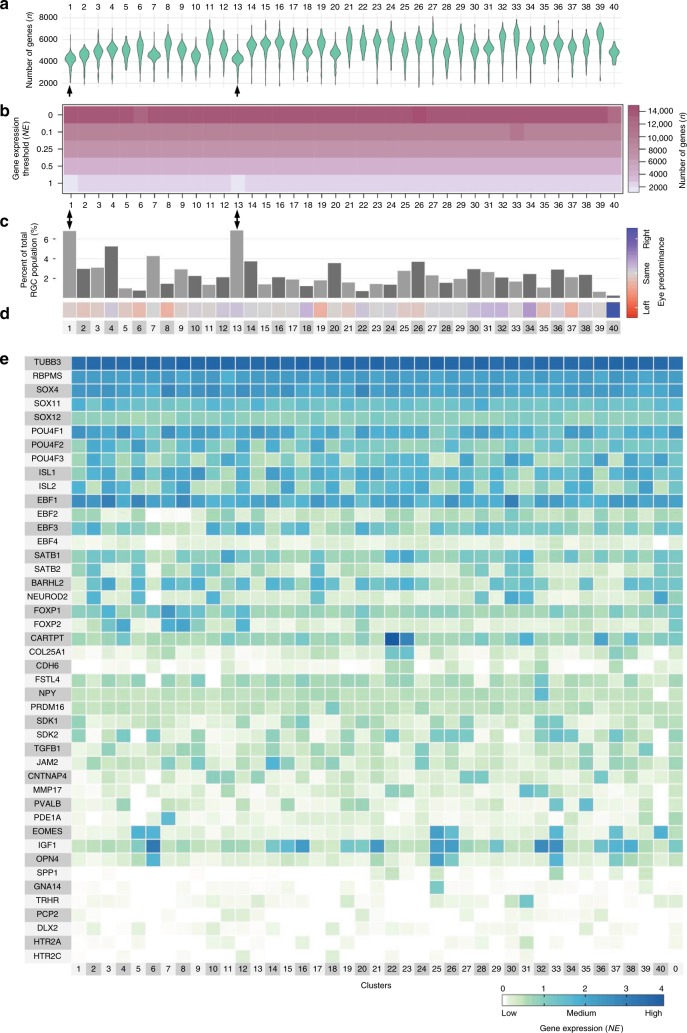
Retinal ganglion cells (RGCs) convey the major output of information collected from the eye to the brain. Thirty subtypes of RGCs have been identified to date. Here, we analyze 6225 RGCs (average of 5000 genes per cell) from right and left eyes by single-cell RNA-seq and classify them into 40 subtypes using clustering algorithms. We identify additional subtypes and markers, as well as transcription factors predicted to cooperate in specifying RGC subtypes. Zic1, a marker of the right eye-enriched subtype, is validated by immunostaining in situ. Runx1 and Fst, the markers of other subtypes, are validated in purified RGCs by fluorescent in situ hybridization (FISH) and immunostaining. We show the extent of gene expression variability needed for subtype segregation, and we show a hierarchy in diversification from a cell-type population to subtypes. Finally, we present a website for comparing the gene expression of RGC subtypes.


Conflict of interest statement

The authors declare no competing interests.

Figures

Fig. 1
Fig. 1
Clustering of single RGCs based on the transcriptomes. a Representative image of P5 RGCs immunostained for RGC marker RBPMS and neuronal marker Tuj1, at 12 h in culture after immunopanning (Scale bar, 50 µm). b Coverage depth of 5000 genes per cell, on average, was achieved. A sub-peak below 3000 genes per cell was excluded due to poor coverage (a cutoff threshold is indicated by a dashed line). c Correlation analysis of gene expression in population of RGCs, as inferred from the scRNA-seq profiling of RGCs (by averaging gene expression from all the cells), and as determined through bulk full-length mRNA-seq of pooled RGCs (Pearson r= 0.86, 2-tailed, p < 0.0001; fit line by LOESS). d RGC clusters were identified based on their transcriptome signatures and visualized using CellRanger and CellView pipeline (see Methods section for details). The t-SNE 2D graph, with the 3rd dimension color-coded, shows clusters distribution. e RBPMS is highly expressed in all RGC clusters, and in a similar proportion between left and right eyes across all the clusters. f Unsupervised k-means clustering heatmap and hierarchical clustering dendrogram of 6225 single RGCs gene expression profiles. The vertical distances on each branch of the dendrogram represent the degree of similarity between RGC clusters gene expression profiles. Expression level is color-coded; scale bar is NE log10-transformed following an addition of a pseudocount. g Distribution of RGC clusters from less to more similar (left to right) based on mean correlation coefficient between each cluster and every other cluster (mean ± SEM shown, Pearson r, 2-tailed). h Average percent of genes detected in RGC clusters (y-axis) across increasing expression thresholds (x-axis) relative to all genes that are expressed > 0 NE either within RGC homogeneous (expressed within 1.5-fold differences between any two clusters) or non-homogeneous (expressed > 1.5-fold difference between at least one cluster and another) genes and TFs categories (mean ± SEM shown; normalized separately within each category for comparison). In all the panels, cluster 0 represents RGCs which did not fit uniquely to any one cluster but expressed RGC markers and were highly correlated with other RGCs overall
Fig. 2
Fig. 2
Distribution of RGC subtypes by left/right eye. a Mean correlation coefficient between gene expression profiles of the same clusters in the left and right eyes is significantly higher than mean correlation coefficient between gene expression profiles of different clusters from both eyes (mean ± SEM shown, Pearson r, 2-tailed; *p < 0.0001 by independent samples t-test, 2-tailed). b Percent of RGCs per cluster is shown relative to the total RGCs in the left (red) or right (blue) eye. The bars are ranked from higher to lower based on the average percent of cells per cluster from both eyes. Significant (*p < 0.01 and **p < 0.001) clusters enrichments per eye are shown (statistical analysis described in Methods section). c Percent of RGCs comprising left and right eye clusters is highly correlated, r = 0.92, p < 0.001 (Pearson, 2-tailed)
Fig. 3
Fig. 3
Global properties of subtype transcriptome and the known RGC markers. a Violin graph showing average number and distribution of genes expressed per cluster as probability density. b Proportion of genes number expressed across different ranges, from low to highly expressed genes. c, d Percent of RGCs per cluster (c) and color-coded predominance of the cluster in left (red) or right (blue) eye (d). Subtypes 1 and 13 indicated by arrowheads in (ac) are the lighter intensity boxes in (b) at the 1 NE threshold. e Heatmap of the known RGC markers shows that Tubb3, RBPMS, and Sox4 have the most homogenous expression across all RGC subtypes. Most of the known RGC markers show strong expression in more than one cluster
Fig. 4
Fig. 4
Heatmap signatures of genes enriched in RGC subtypes. Enriched genes selection criteria: expression > 1.8-fold relative to every other cluster, at p-value ≤ 0.05 (except for two cluster 40 enriched genes which did not pass the p-value threshold, indicated by *, as detailed in the Methods section), and minimal expression > 0.05 NE. Genes with p ≤ 0.05 by t-test and Mann–Whitney U independent samples tests are shown in black font. Genes with p ≤ 0.05 by t-test and p ≤ 0.1 by Mann–Whitney U test are shown in green font. Genes with p ≤ 0.05 by either test but p > 0.1 by the other are shown in red font. Color-coded scale bar of gene expression indicates z-scores after normalizing to all the clusters (Methods section). Other genes enriched per cluster only based on the first two criteria are shown in Supplementary Data. 1
Fig. 5
Fig. 5
Runx1 and Fst label RGC subtypes. a Runx1 expression is enriched in the RGC subtype 27 (mean ± SEM shown). bg The t-SNE graph with V1,V2 2D view and color-code as in Fig. 1d, shows clusters distribution in (b) and just the expression of Runx1 in (c) and Fst in (d). An alternative V1,V3 2D view t-SNE graph shows clusters distribution in (e) and just the expression of Runx1 in (f) and Fst in (g), demonstrating clearer separation between the clusters 27 and 3, as well as their markers (Runx1 and Fst), in the 3rd dimension (which is color-coded in the V1,V2 2D view). h Representative image of purified P5 RGCs at 12 h in culture probed by FISH for Runx1, an RGC marker RBPMS, and DAPI, as marked. i, j Insets of two Runx1+ RGCs outlined with dashed box in the upper panels (in the middle i and on the bottom j) are shown enlarged below (cell soma outlined with dashed line). Merged image in the upper panel also includes brightfield, which was used to outline cell soma shape in the insets. Granularized signal (arrowheads) in the insets is a property of the single-molecule sensitivity FISH kit. k Interpolation line shows a higher distribution peak over RGCs with fewer Runx1 puncta compared to RGCs with more puncta. l Fst expression is highly enriched in the RGC subtype 3 (mean ± SEM shown). m Representative image of purified P5 RGCs at 12 h in culture immunostained for Fst, an RGC marker RBPMS, and DAPI, as marked. n, o Insets of Fst+ and Fst− RGCs outlined with dashed box in the upper panels (in the middle n and on the bottom o) are shown enlarged below (cell soma outlined with dashed line). ps Representative images of purified P5 RGCs at 12 h in culture probed by FISH for Runx1, and then immunostained for Fst and DAPI, as marked. Insets of Runx1−/Fst+ (p) and Runx1+/Fst− (r) RGCs outlined with dashed box in the upper panels are shown enlarged below (q and s, respectively; cell soma outlined with dashed line). (Scale bars: upper panels, 100 µm; lower panels, 5 µm)
Fig. 6
Fig. 6
Validation of Zic1 as a marker for the right eye-enriched RGC subtype 34. a Average expression of Zic1 is higher in the right eye RGCs compared to the left eye RGCs (mean ± SEM shown; independent samples t-test, *p < 0.0001). b Average expression of Zic1 per RGC is similar between right and left eye RGCs in cluster 34, which is enriched for Zic1 (mean ± SEM shown; arrow indicates subtype 34). c, d Percent of RGCs per cluster that express Zic1 is shown relative to the total RGCs in the left (red) or right (blue) eye. Arrow indicates subtype 34 in which Zic1 is expressed in almost twice as many right eye RGCs compared to the left eye (c), consistent with the percent of right eye RGCs in subtype 34 being almost twice higher compared to left eye RGCs, relative to the total RGCs in each eye (d). e, f Representative images of retinal cross-sections ganglion cell layer (GCL) from the left (e) and right (f) eyes of mature mice, immunostained as marked for an RGC marker RBPMS, nuclear marker DAPI, and Zic1. Enlarged examples of Zic1+/RBPMS+/DAPI+ RGCs from regions outlined in dashed line box are shown in insets on the sides, demonstrate that Zic1 signal colocalizes with DAPI in the nucleus, as expected for a TF. An example of Zic1+/RBPMS−/DAPI+ (possibly displaced amacrine) cells in the GCL is outlined in dashed line oval (e). Scale bars as marked. g Quantifications of Zic1+/RBPMS+ RGCs as percent of total RGCs in different retinal regions show significant enrichment of Zic1+ RGCs in the right eye overall and in the ventrotemporomedial retinal regions in both eyes (mean ± SEM shown; *p < 0.05, **p< 0.01 by ANOVA with post hoc LSD pairwise comparisons; N= 4 for left and right eye each, with different retinal regions quantified from each eye, shown as dots plot overlaying the bars, as detailed in the Methods)
Fig. 7
Fig. 7
RGC subtypes diversification. a Circular phylogenetic tree-style diagram of RGC subtypes hierarchical diversification. The distance of a branch from the center point represents the extent of its divergence, and ramification of the branches represents the hierarchical relationship between RGC subtypes transcriptome profiles. Genes enriched in color-coded intermediate branches, that represent the ISPs, are shown on the side. TFs are italicized, and where a combination of TFs is not sufficient to explain all the subtypes comprising the ISP, a “?” represents yet undetermined TF or epigenetic/TF regulator that may participate in specifying these ISPs. bf Expression profiles of genes, including TFs, which are enriched in specific ISPs are shown, as marked. g The pie graph shows prevalence of the ISPs relative to the total RGC population
Fig. 8
Fig. 8
Examples of RGC subtype-specific TF combinations. a, b 2-way combinations of TFs (a), and a TF and transcriptional regulator Tagln2 (b), uniquely enriched in RGC subtypes. c Different 2-way TF combinations involving the same TF uniquely enriched in different RGC subtypes. d Three-way TF combination uniquely enriched in an RGC subtype
Fig. 9
Fig. 9
RGC subtypes enriched for axon growth-regulating genes. a Heatmap of genes known to regulate axon growth and regeneration shows differential expression between RGC subtypes. b Correlation between enrichment of Klf9 and Jun genes expression in different RGC subtypes, r = 0.62, p < 0.01 (Pearson, 2-tailed). c Heatmap of genes enriched in melanopsin-expressing ipRGCs, and a dendrogram showing clustering of putative αRGC subtypes (red box). d Myc gene is highly expressed in putative αRGC subtypes

References

    1. Lichtman JW, Denk W. The big and the small: challenges of imaging the brain’s circuits. Science. 2011;334:618–623. doi: 10.1126/science.1209168. - DOI - PubMed
    1. Poulin JF, Tasic B, Hjerling-Leffler J, Trimarchi JM, Awatramani R. Disentangling neural cell diversity using single-cell transcriptomics. Nat. Neurosci. 2016;19:1131–1141. doi: 10.1038/nn.4366. - DOI - PubMed
    1. Trakhtenberg EF, et al. Cell types differ in global coordination of splicing and proportion of highly expressed genes. Sci. Rep. 2016;6:32249. doi: 10.1038/srep32249. - DOI - PMC - PubMed
    1. Tasic B, et al. Adult mouse cortical cell taxonomy revealed by single cell transcriptomics. Nat. Neurosci. 2016;19:335–346. doi: 10.1038/nn.4216. - DOI - PMC - PubMed
    1. Zeng H, Sanes JR. Neuronal cell-type classification: challenges, opportunities and the path forward. Nat. Rev. Neurosci. 2017;18:530–546. doi: 10.1038/nrn.2017.85. - DOI - PubMed

Publication types

MeSH terms