

Heterogeneity within the PF-EPN-B ependymoma subgroup
- PMID: 30019219
- PMCID: PMC6373486
- DOI: 10.1007/s00401-018-1888-x
Heterogeneity within the PF-EPN-B ependymoma subgroup
Abstract
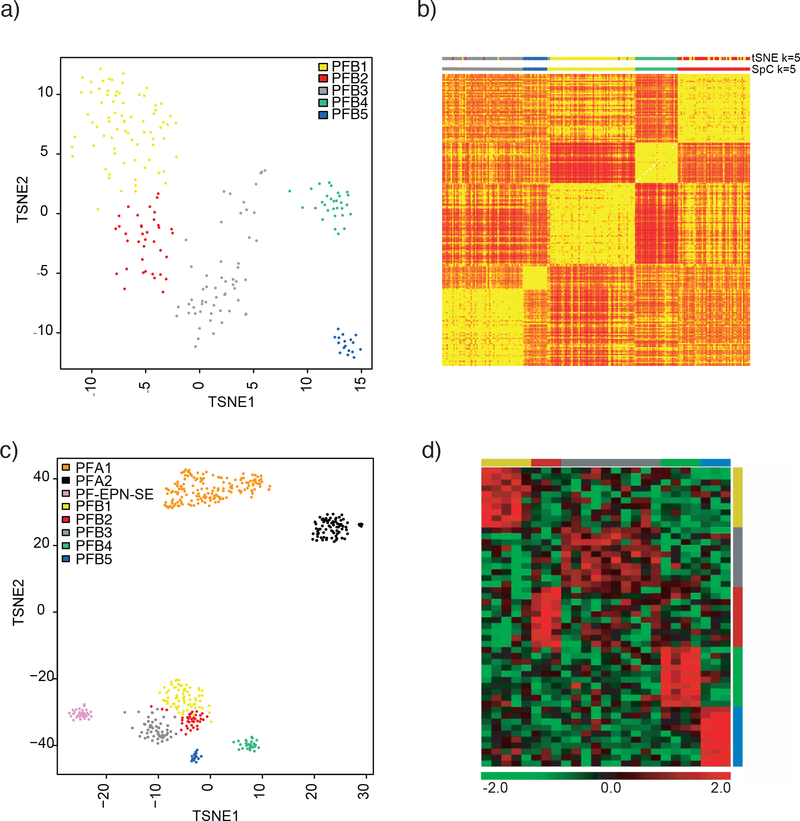
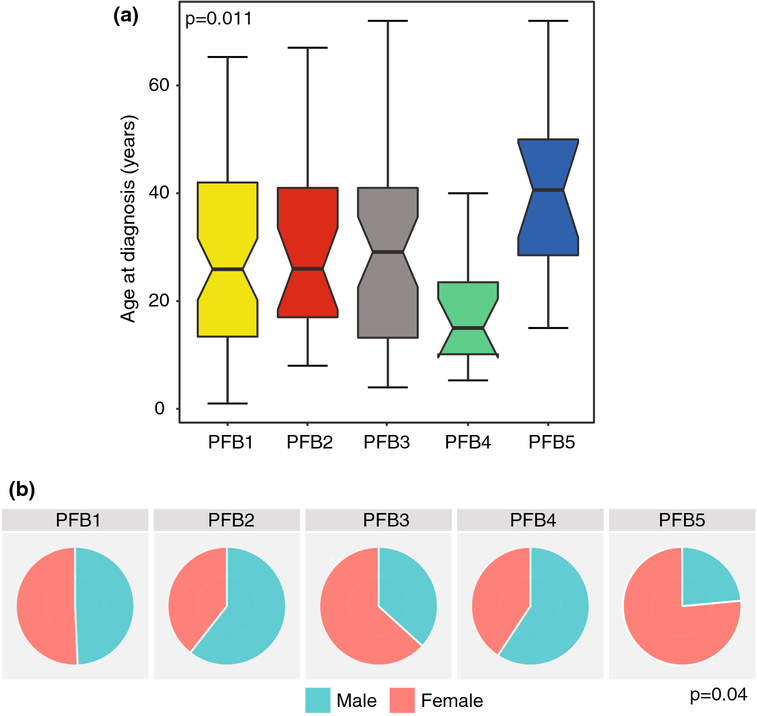
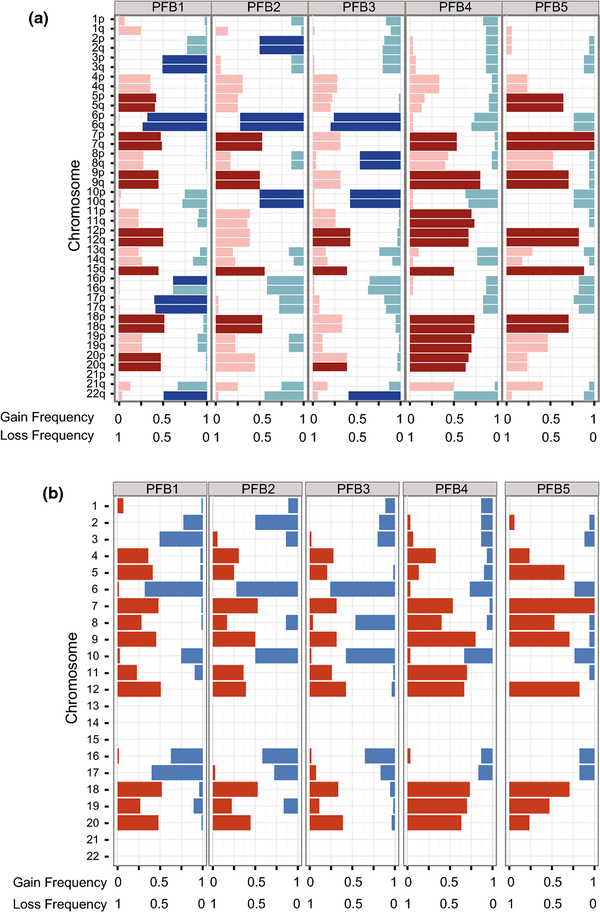
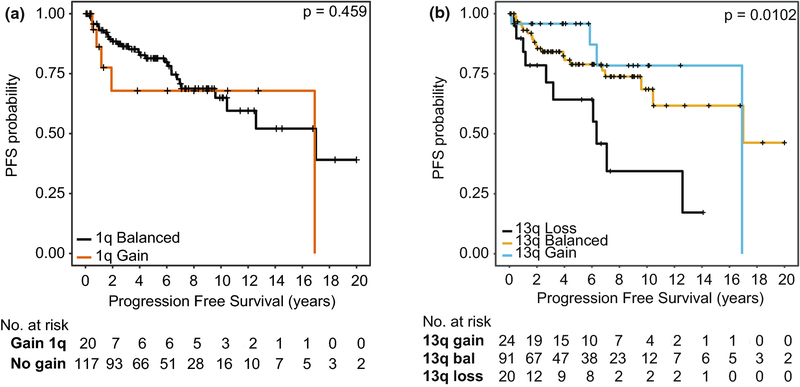
Posterior fossa ependymoma comprise three distinct molecular variants, termed PF-EPN-A (PFA), PF-EPN-B (PFB), and PF-EPN-SE (subependymoma). Clinically, they are very disparate and PFB tumors are currently being considered for a trial of radiation avoidance. However, to move forward, unraveling the heterogeneity within PFB would be highly desirable. To discern the molecular heterogeneity within PFB, we performed an integrated analysis consisting of DNA methylation profiling, copy-number profiling, gene expression profiling, and clinical correlation across a cohort of 212 primary posterior fossa PFB tumors. Unsupervised spectral clustering and t-SNE analysis of genome-wide methylation data revealed five distinct subtypes of PFB tumors, termed PFB1-5, with distinct demographics, copy-number alterations, and gene expression profiles. All PFB subtypes were distinct from PFA and posterior fossa subependymomas. Of the five subtypes, PFB4 and PFB5 are more discrete, consisting of younger and older patients, respectively, with a strong female-gender enrichment in PFB5 (age: p = 0.011, gender: p = 0.04). Broad copy-number aberrations were common; however, many events such as chromosome 2 loss, 5 gain, and 17 loss were enriched in specific subtypes and 1q gain was enriched in PFB1. Late relapses were common across all five subtypes, but deaths were uncommon and present in only two subtypes (PFB1 and PFB3). Unlike the case in PFA ependymoma, 1q gain was not a robust marker of poor progression-free survival; however, chromosome 13q loss may represent a novel marker for risk stratification across the spectrum of PFB subtypes. Similar to PFA ependymoma, there exists a significant intertumoral heterogeneity within PFB, with distinct molecular subtypes identified. Even when accounting for this heterogeneity, extent of resection remains the strongest predictor of poor outcome. However, this biological heterogeneity must be accounted for in future preclinical modeling and personalized therapies.
Keywords: Clustering; Ependymoma; PFA; PFB; Posterior fossa; Subgrouping.
Figures
References
-
- Araki A, Chocholous M, Gojo J, Dorfer C, Czech T, Heinzl H et al. (2016) Chromosome 1q gain and tenascin-C expression are candidate markers to define different risk groups in pediatric posterior fossa ependymoma. Acta neuropathologica communications 4: 88Doi 10.1186/s40478-016-0349-9 - DOI - PMC - PubMed
-
- Hovestadt V, Remke M, Kool M, Pietsch T, Northcott PA, Fischer R et al. (2013) Robust molecular subgrouping and copy-number profiling of medulloblastoma from small amounts of archival tumour material using high-density DNA methylation arrays. Acta Neuropathol 125: 913–916 Doi 10.1007/s00401-013-1126-5 - DOI - PMC - PubMed
Publication types
MeSH terms
Grants and funding
LinkOut - more resources
Full Text Sources
Other Literature Sources
Molecular Biology Databases
