. 2018 Jul 18;7(7):CD011094.
doi: 10.1002/14651858.CD011094.pub3.

Omega-6 fats for the primary and secondary prevention of cardiovascular disease

Affiliations

Omega-6 fats for the primary and secondary prevention of cardiovascular disease

Lee Hooper et al. Cochrane Database Syst Rev. .

Update in

Abstract

Background: Omega-6 fats are polyunsaturated fats vital for many physiological functions, but their effect on cardiovascular disease (CVD) risk is debated.

Objectives: To assess effects of increasing omega-6 fats (linoleic acid (LA), gamma-linolenic acid (GLA), dihomo-gamma-linolenic acid (DGLA) and arachidonic acid (AA)) on CVD and all-cause mortality.

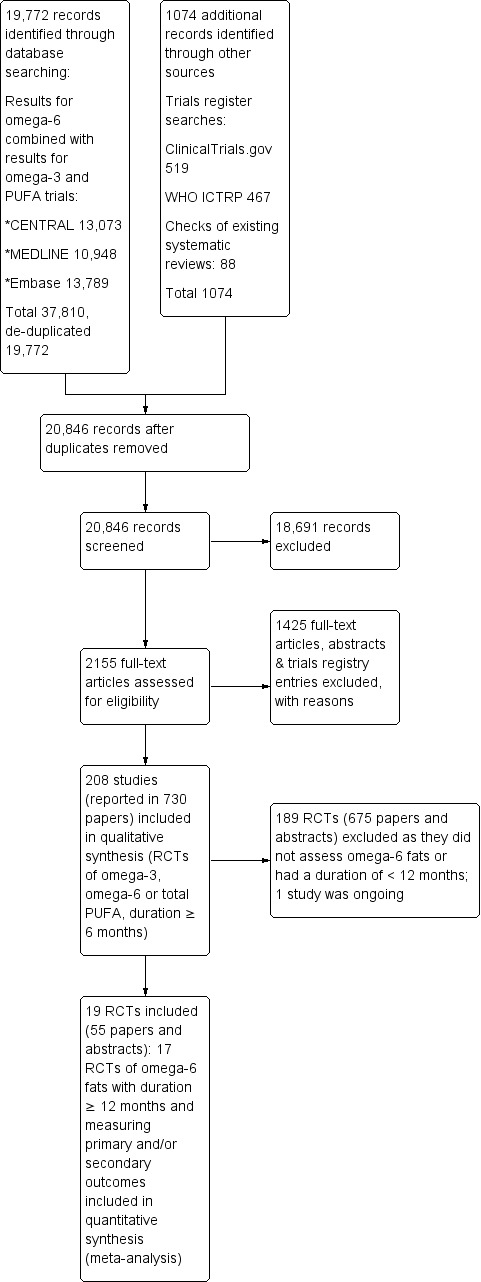
Search methods: We searched CENTRAL, MEDLINE and Embase to May 2017 and clinicaltrials.gov and the World Health Organization International Clinical Trials Registry Platform to September 2016, without language restrictions. We checked trials included in relevant systematic reviews.

Selection criteria: We included randomised controlled trials (RCTs) comparing higher versus lower omega-6 fat intake in adults with or without CVD, assessing effects over at least 12 months. We included full texts, abstracts, trials registry entries and unpublished studies. Outcomes were all-cause mortality, CVD mortality, CVD events, risk factors (blood lipids, adiposity, blood pressure), and potential adverse events. We excluded trials where we could not separate omega-6 fat effects from those of other dietary, lifestyle or medication interventions.

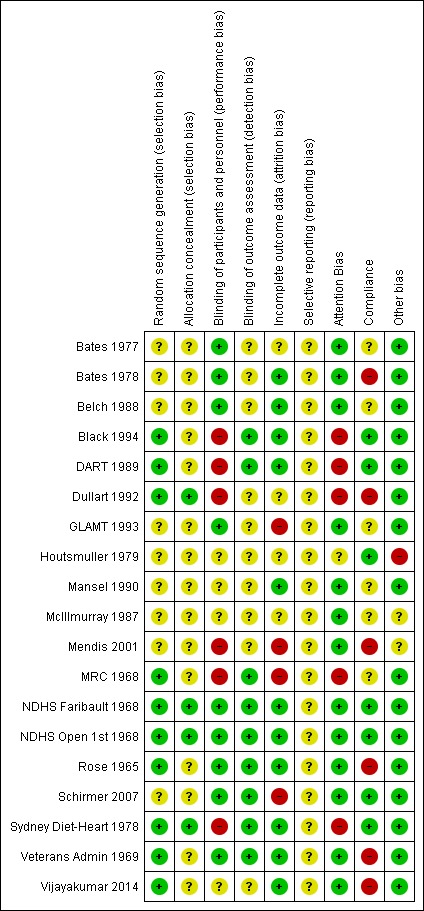
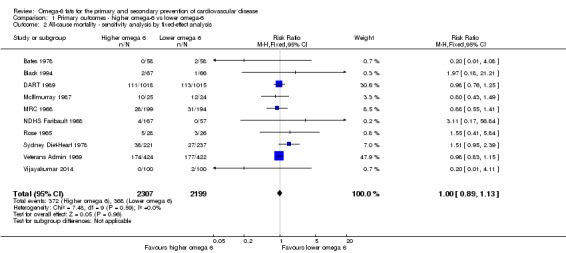
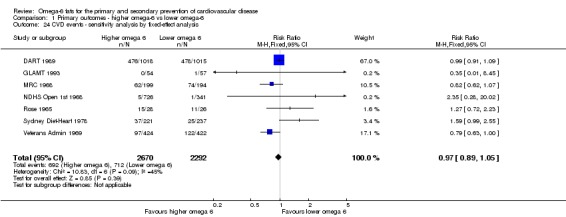
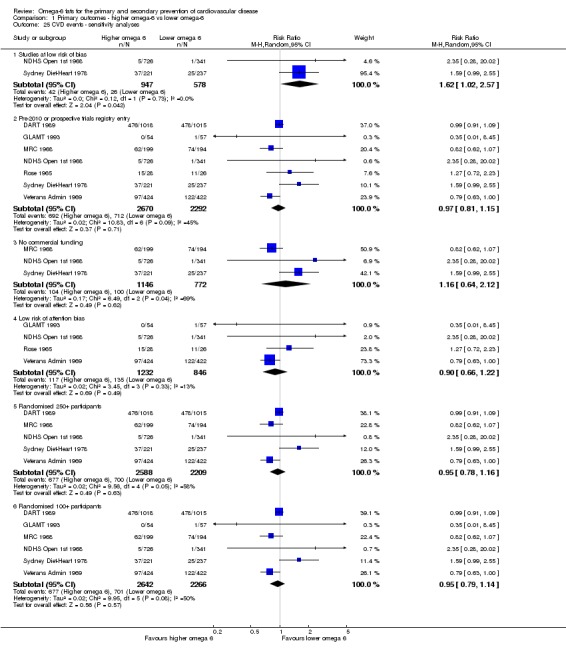
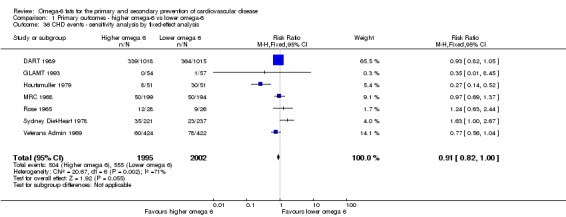
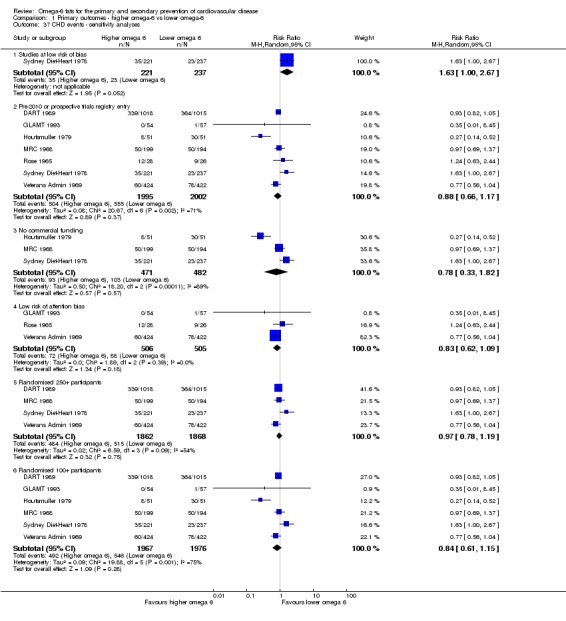
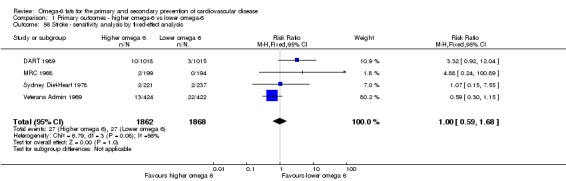
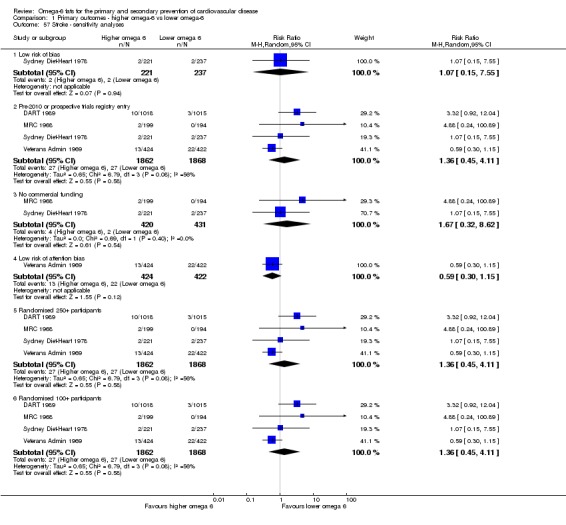
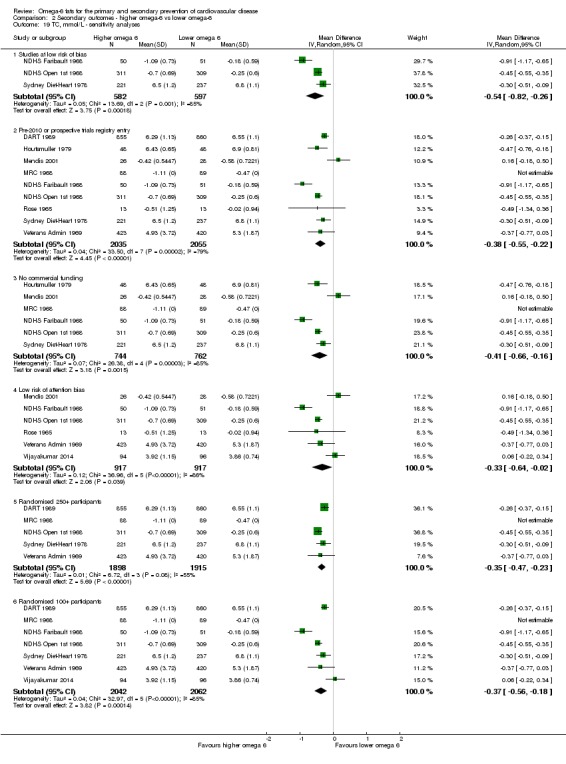
Data collection and analysis: Two authors independently screened titles/abstracts, assessed trials for inclusion, extracted data, and assessed risk of bias of included trials. We wrote to authors of included studies. Meta-analyses used random-effects analysis, while sensitivity analyses used fixed-effects and limited analyses to trials at low summary risk of bias. We assessed GRADE quality of evidence for 'Summary of findings' tables.

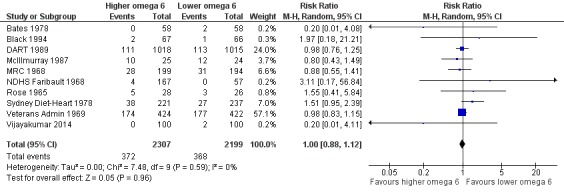
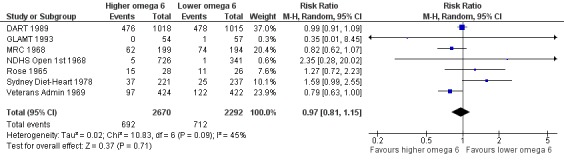
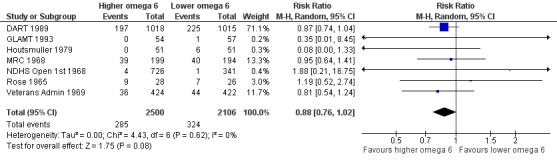
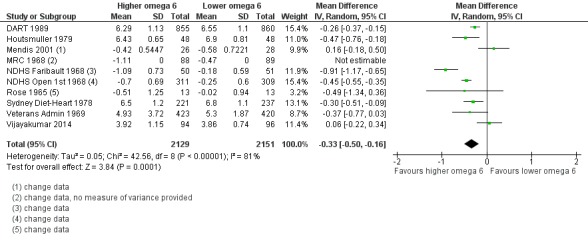
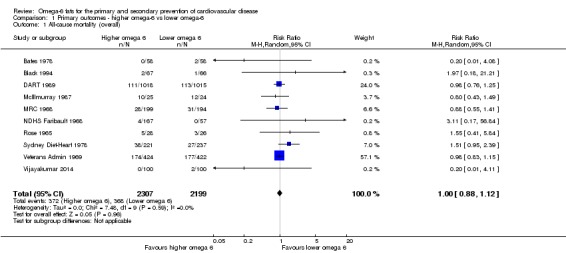
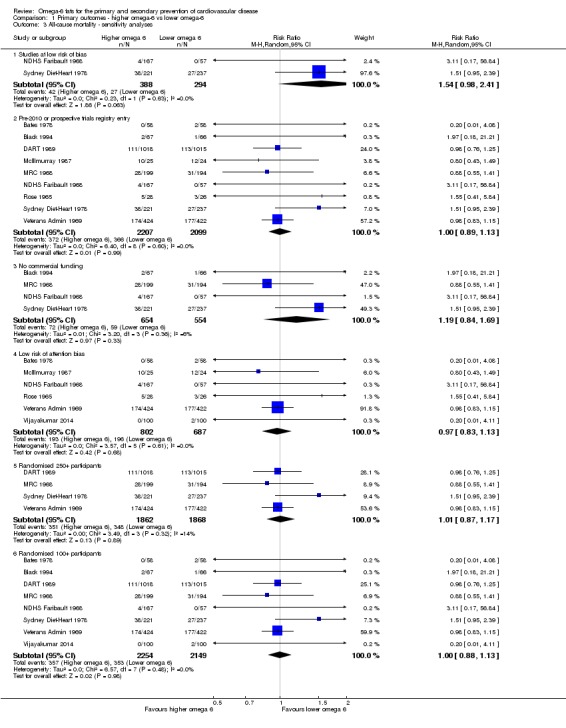
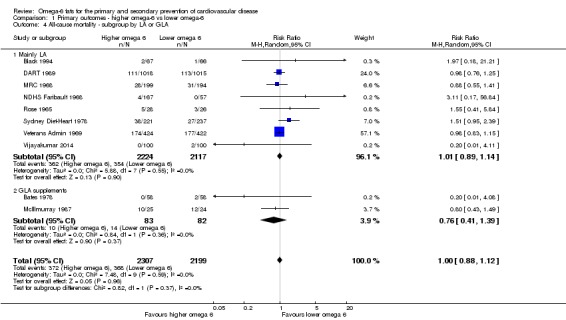
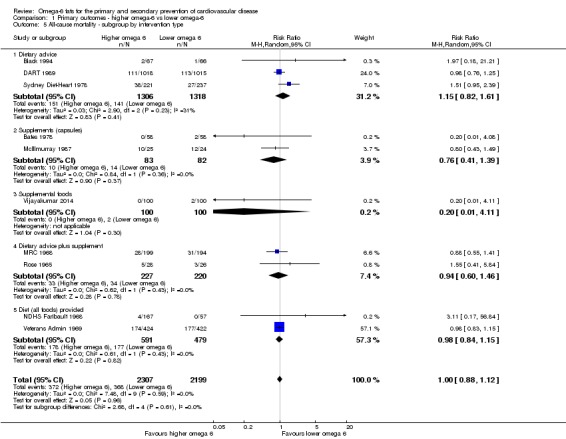
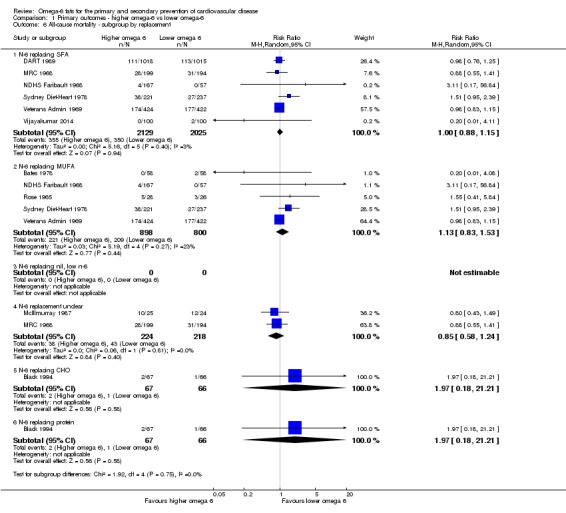
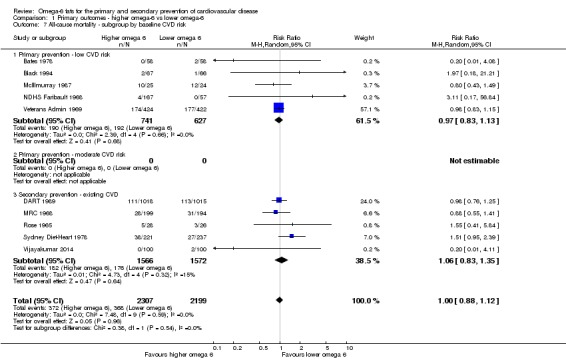
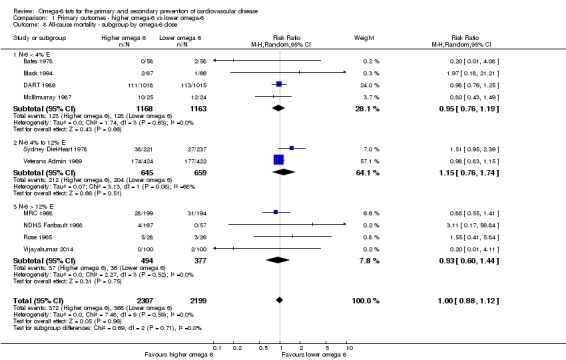
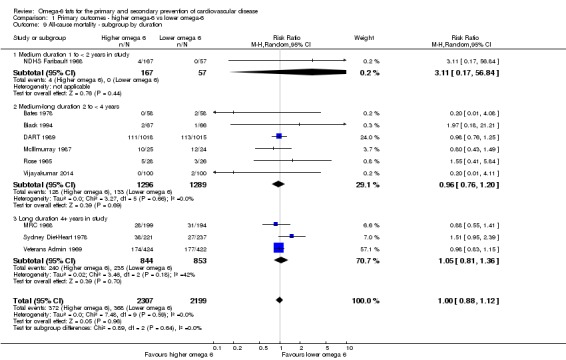
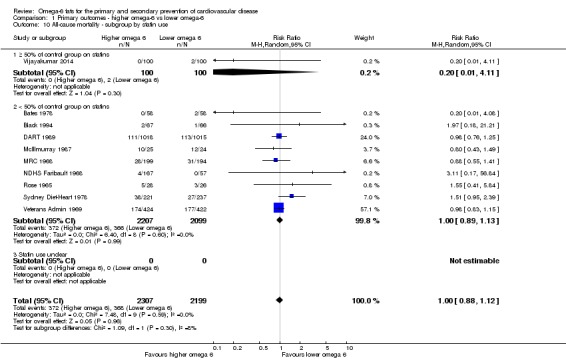
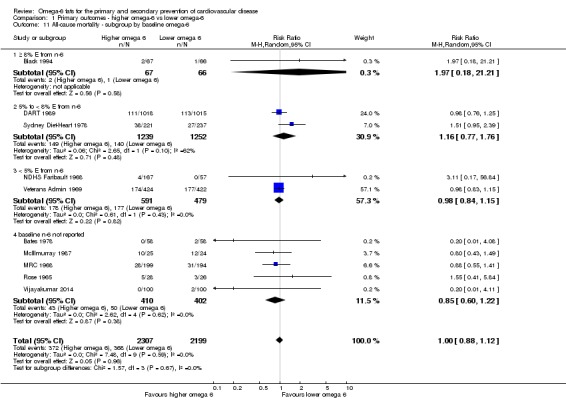
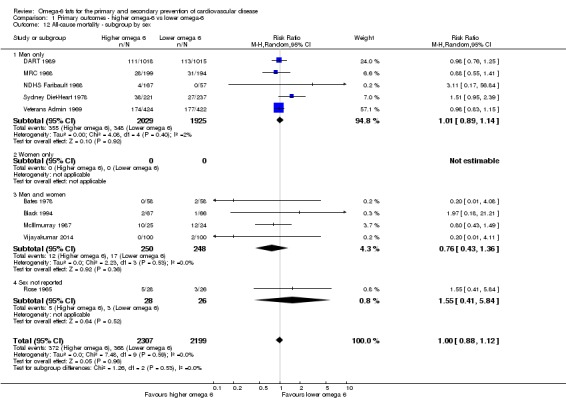
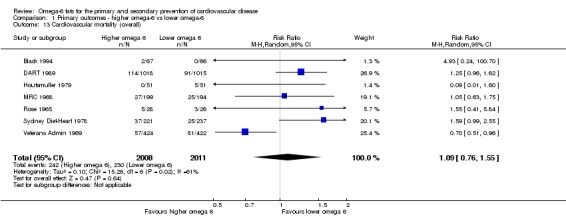
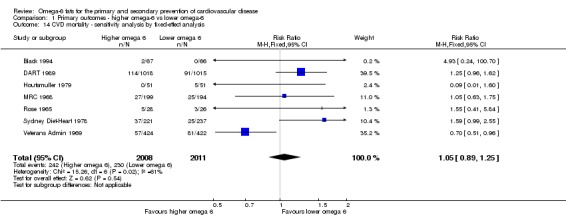
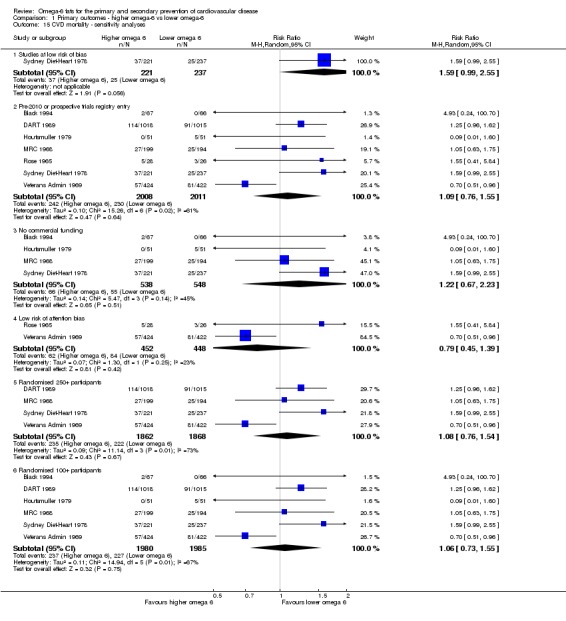
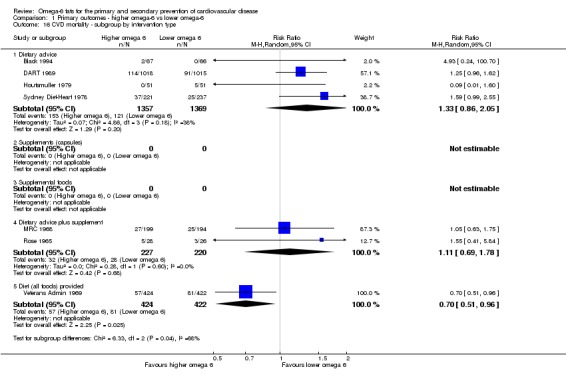
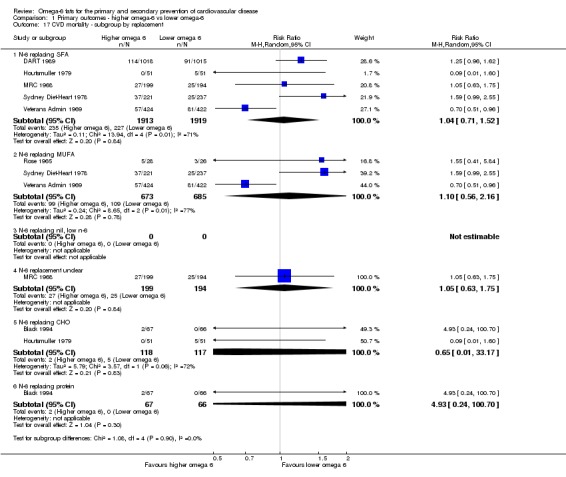
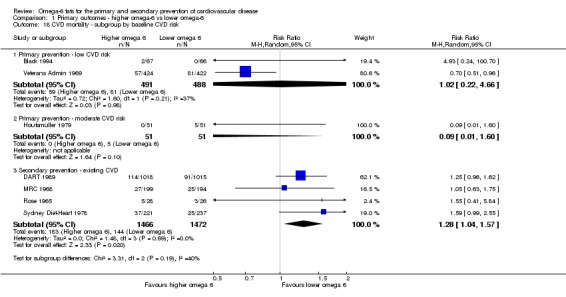
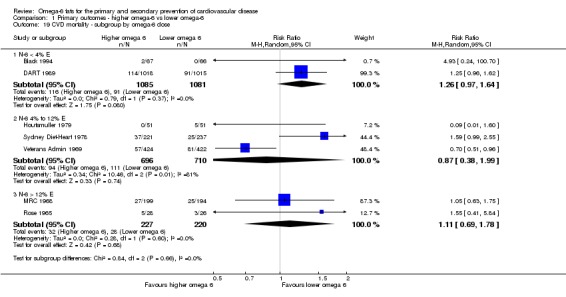
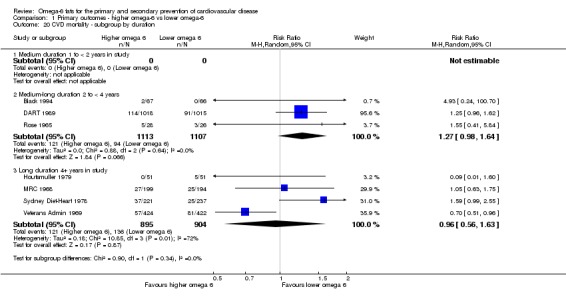
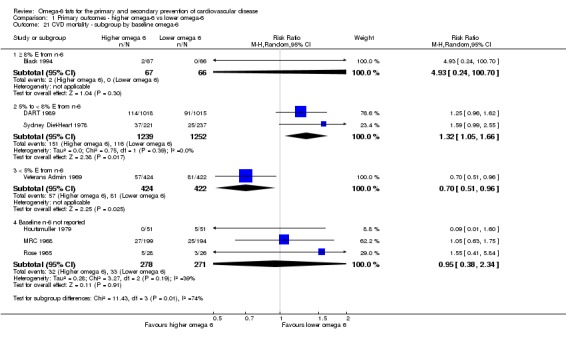
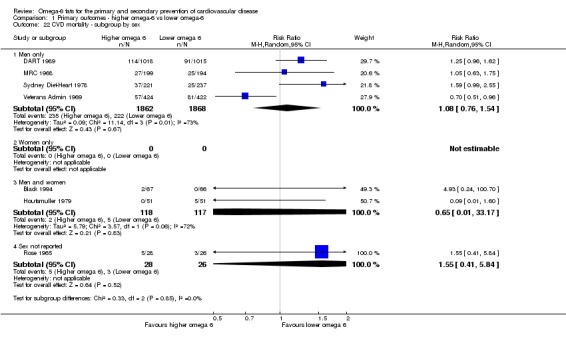
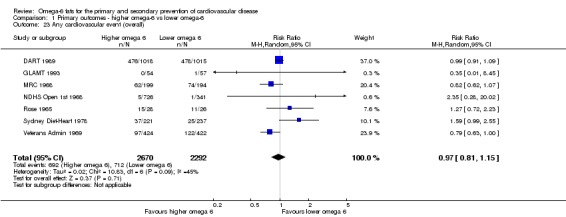
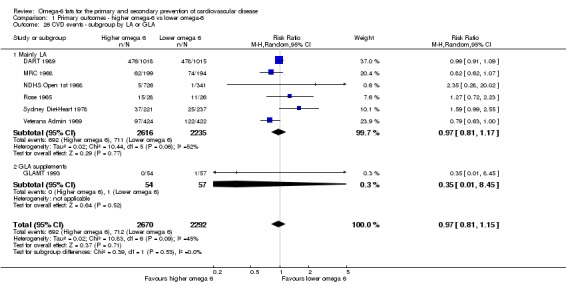
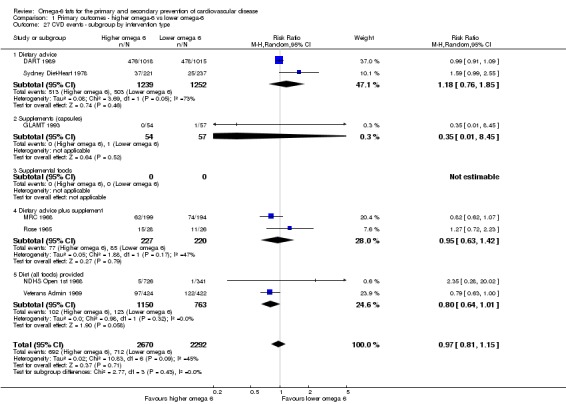
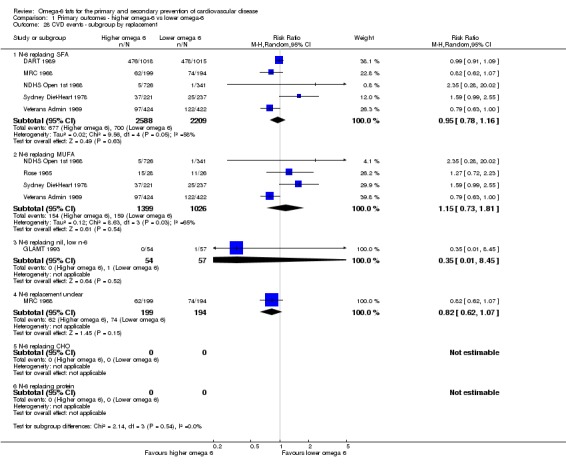
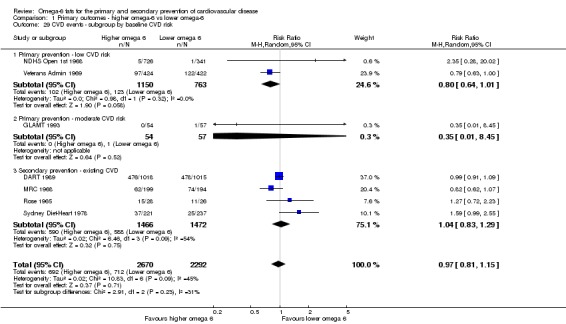
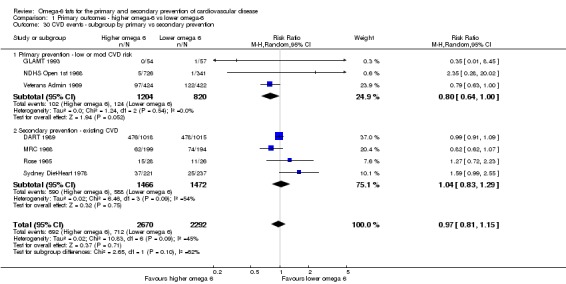
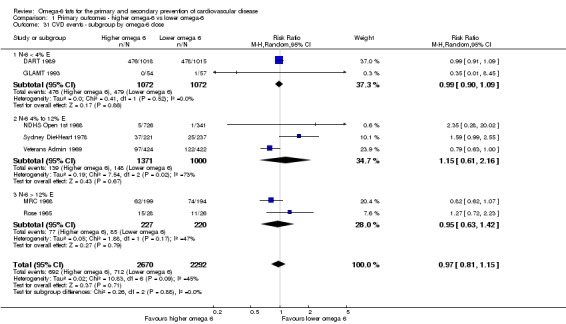
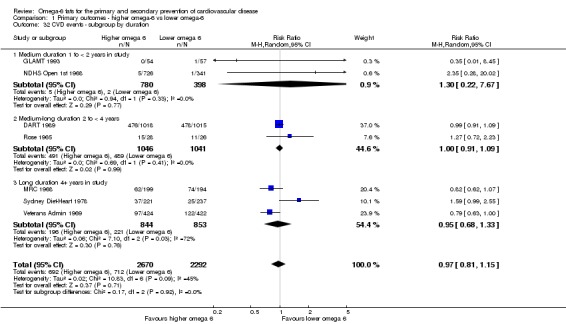
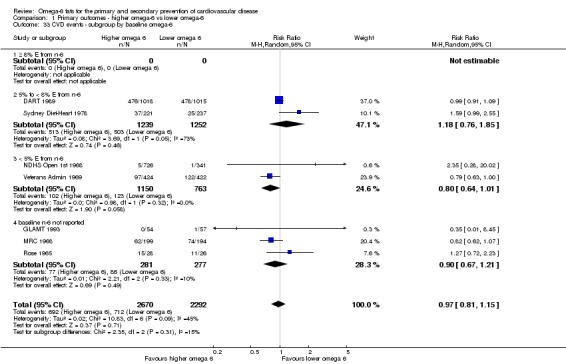
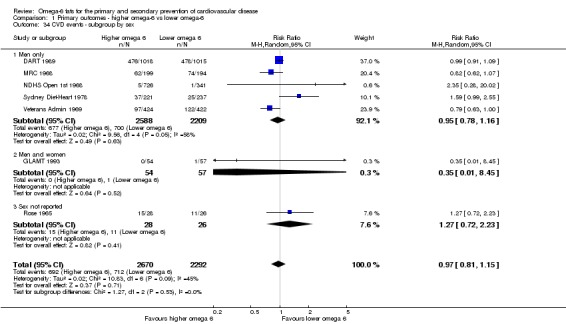
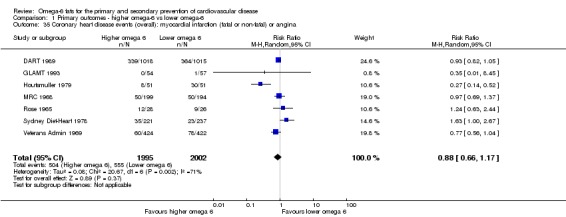
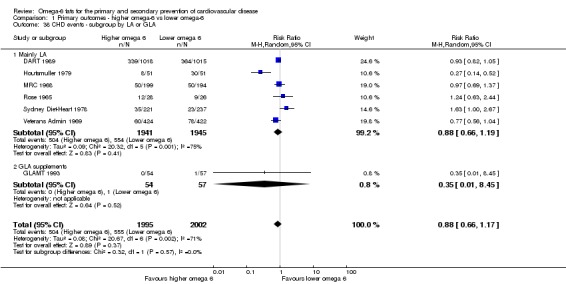
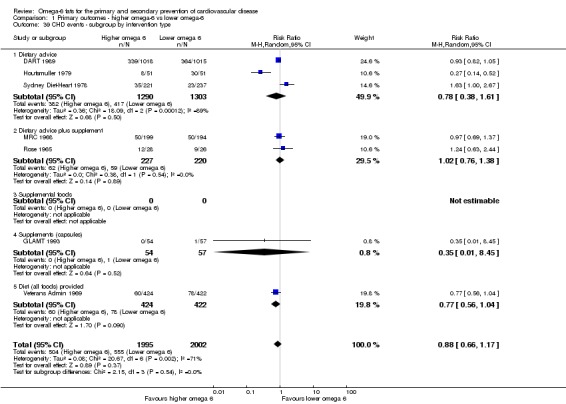
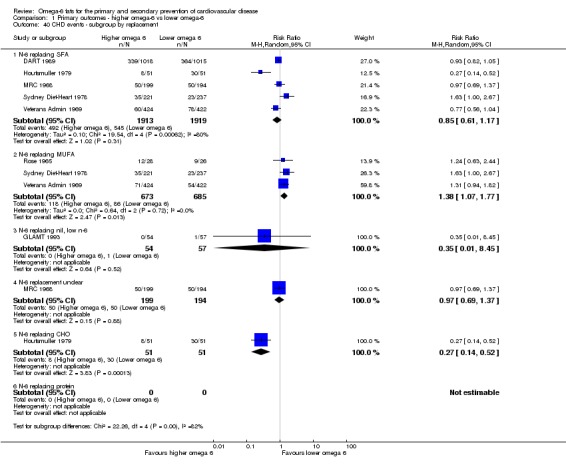
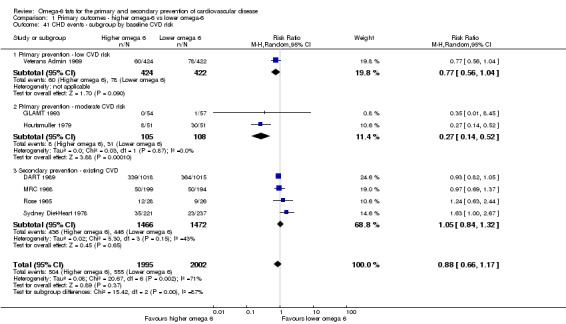
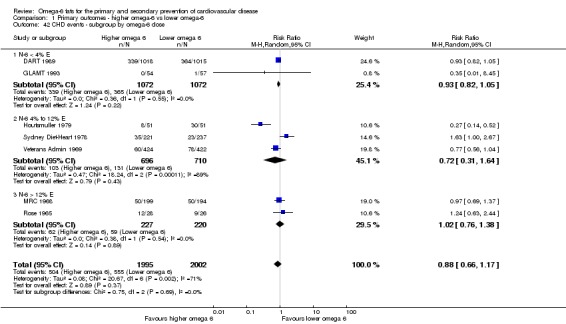
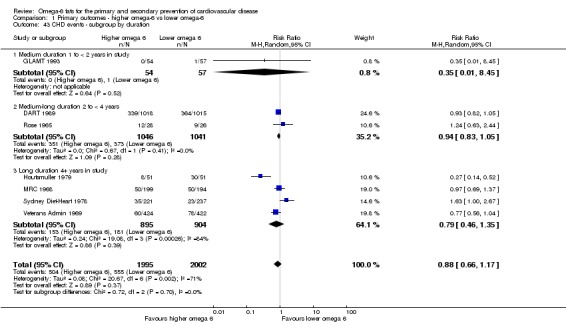
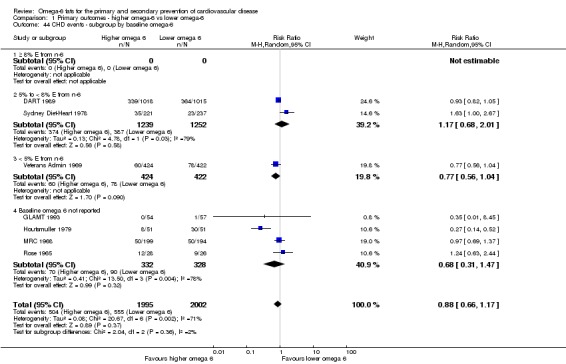
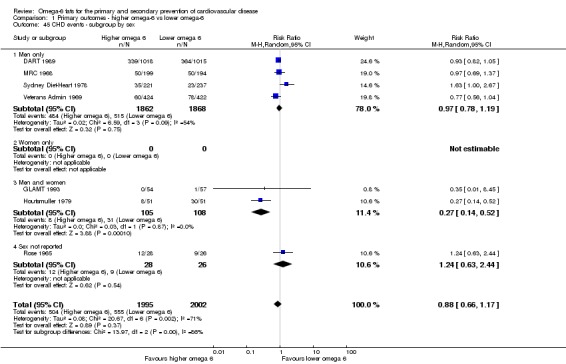
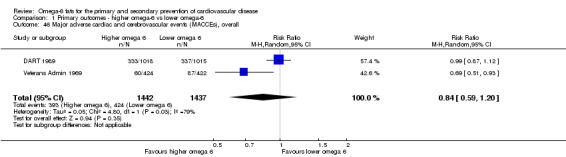
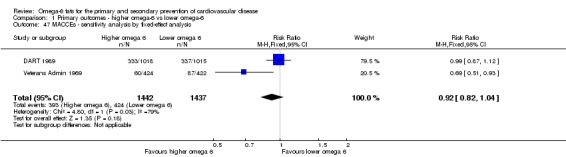
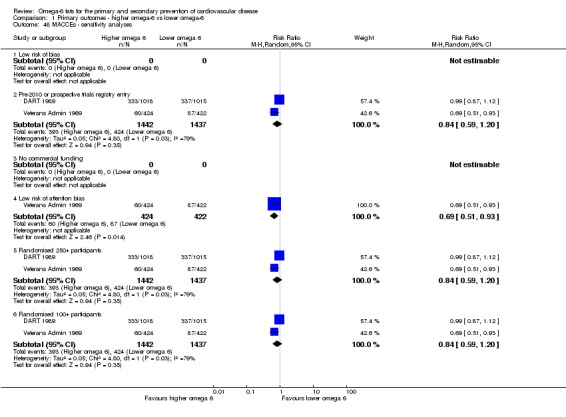
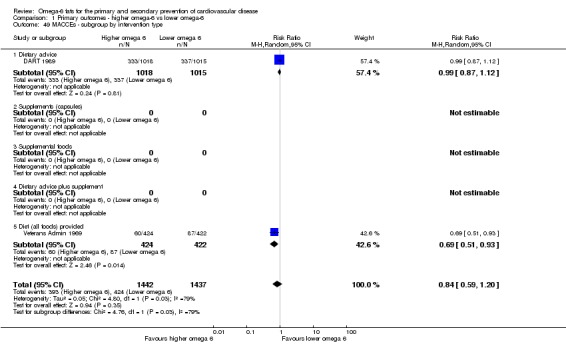
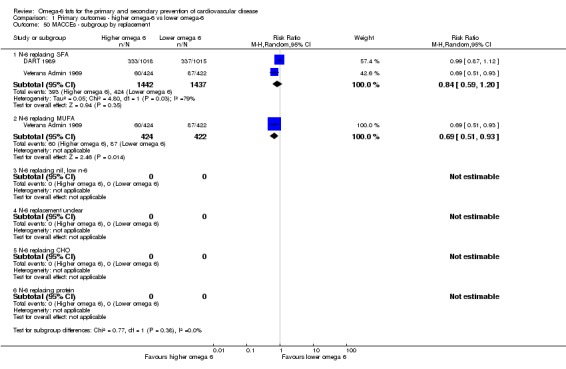
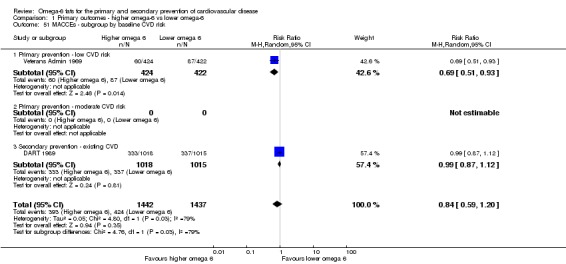
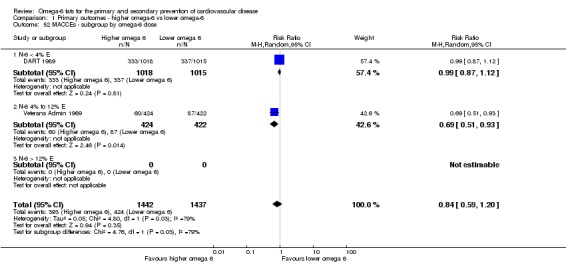
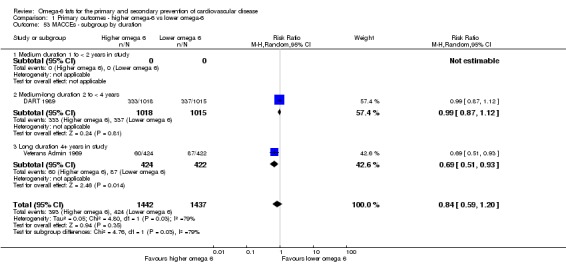
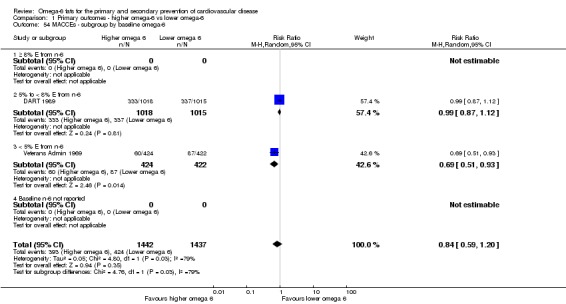
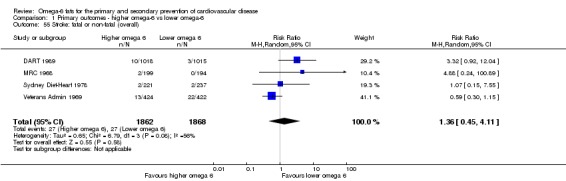
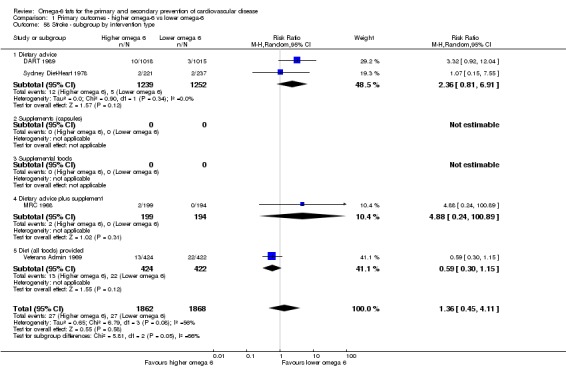
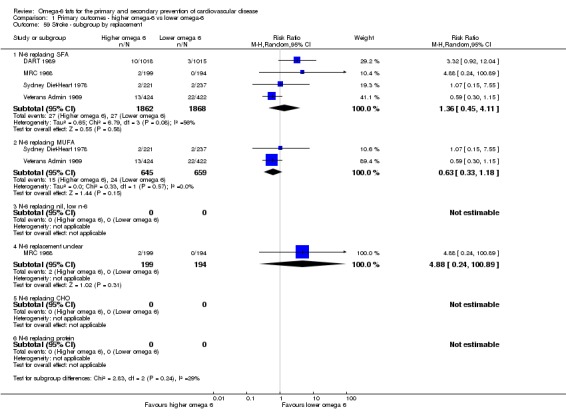
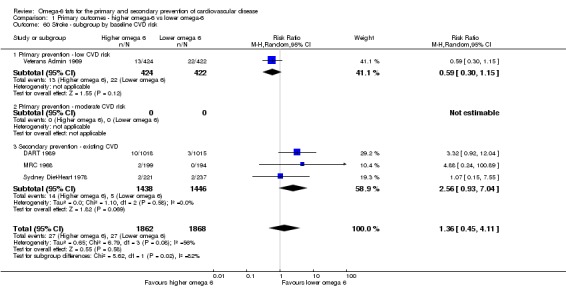
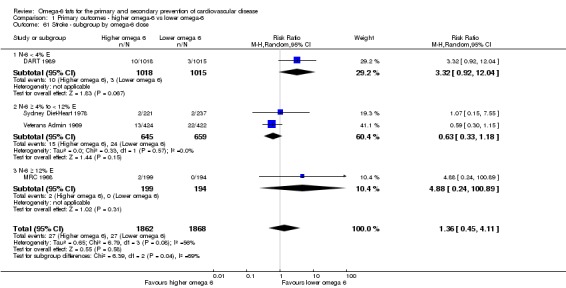
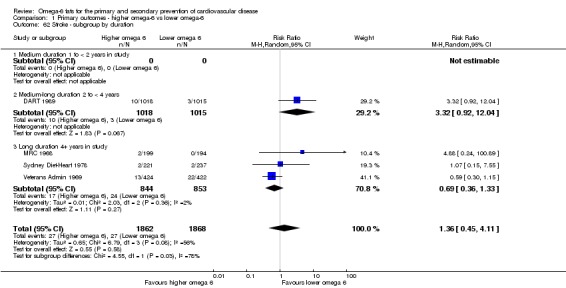
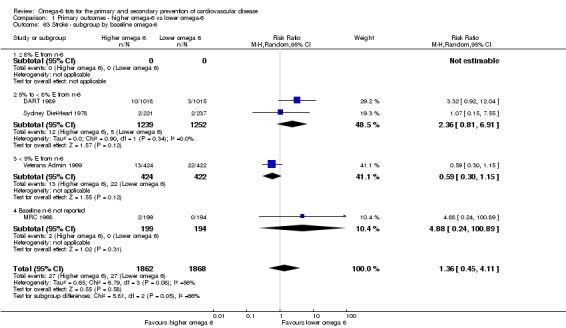
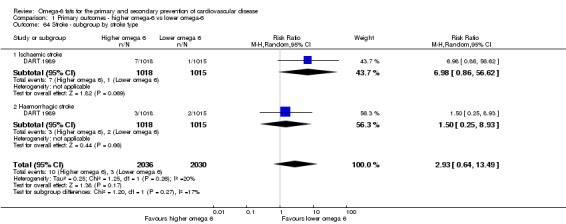
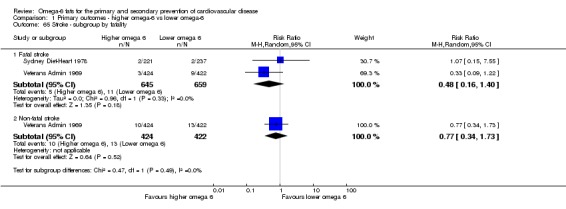
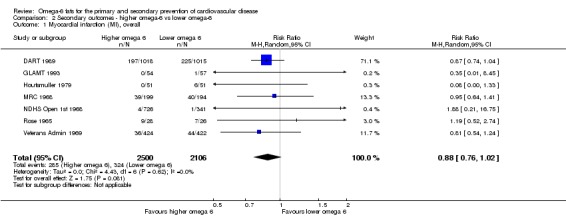
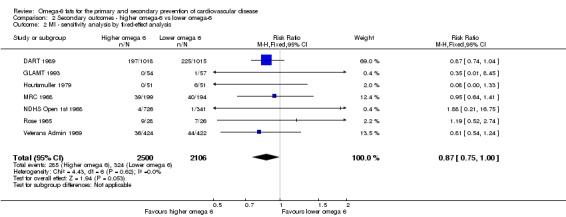
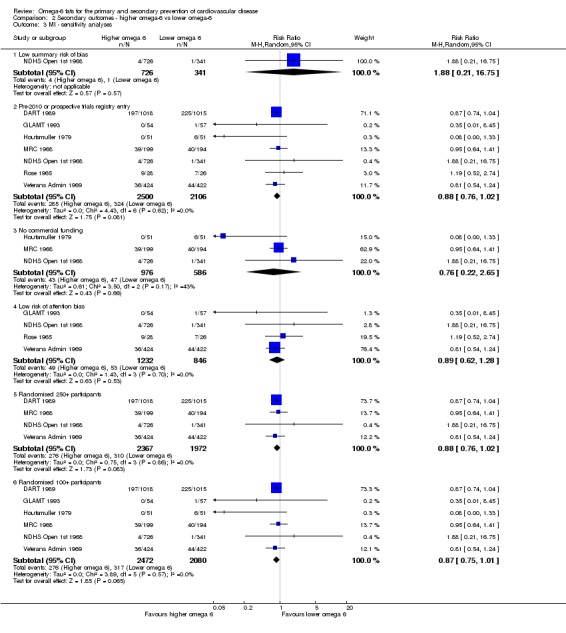
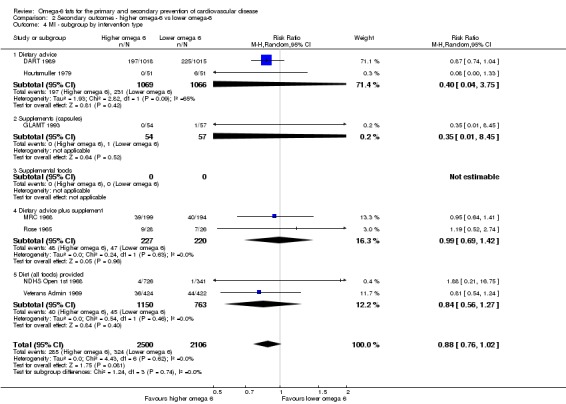
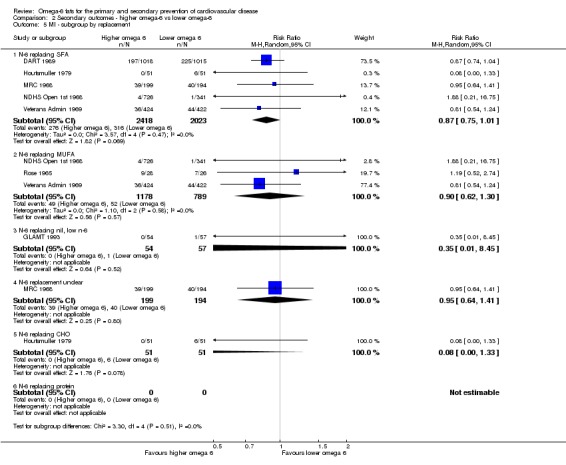
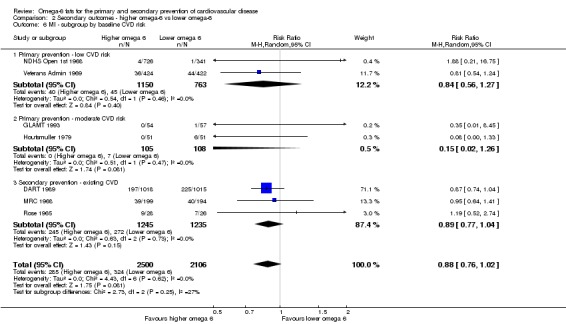
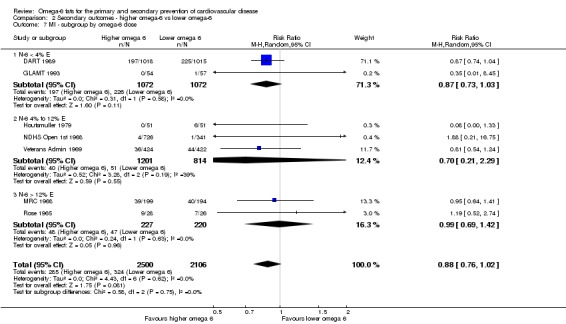
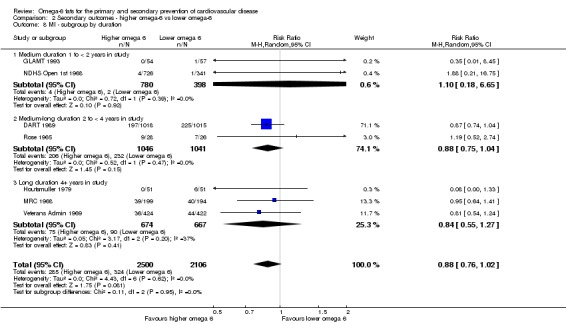
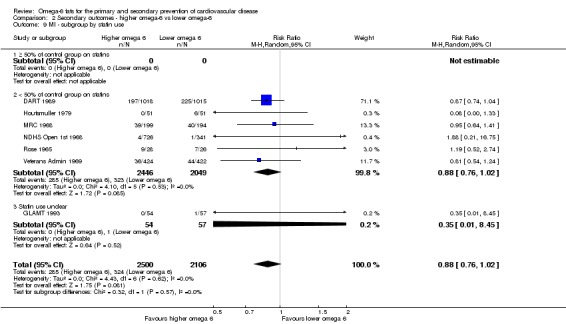
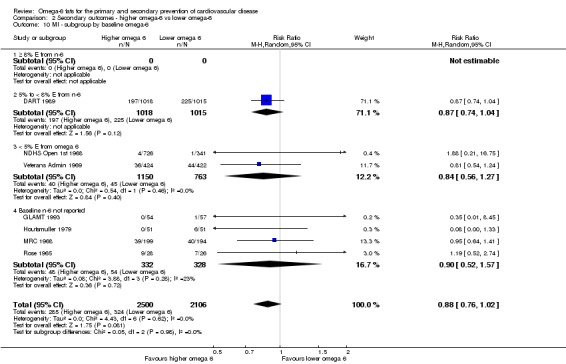
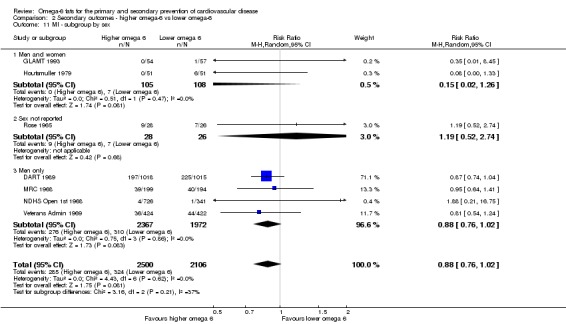
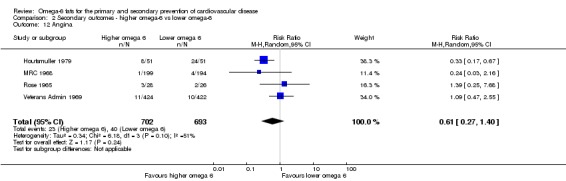
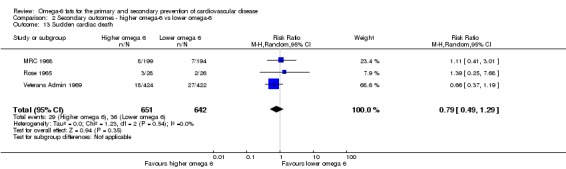
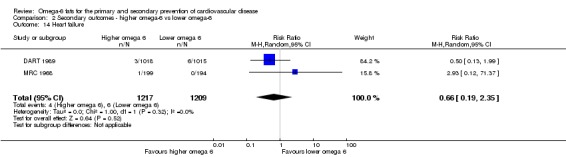
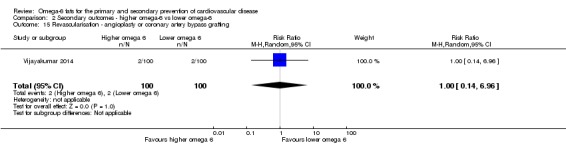
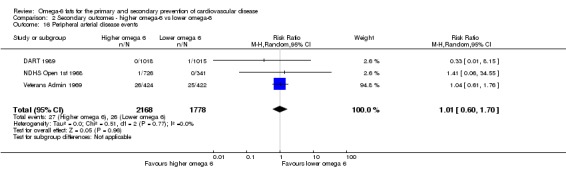
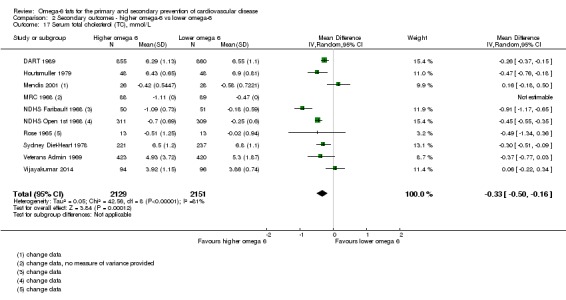
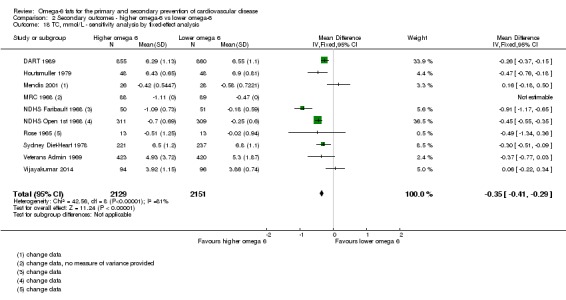
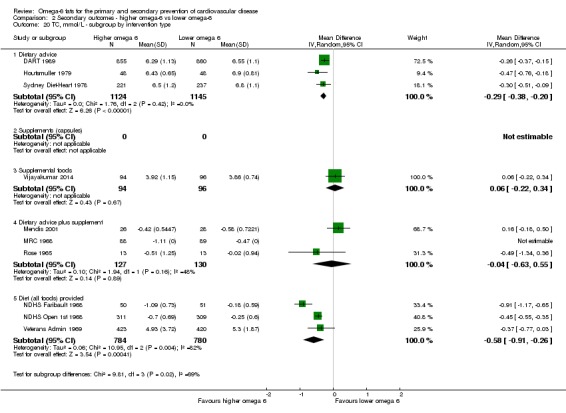
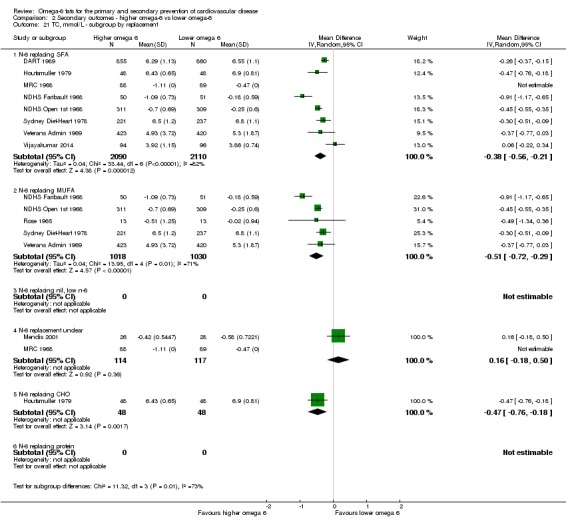
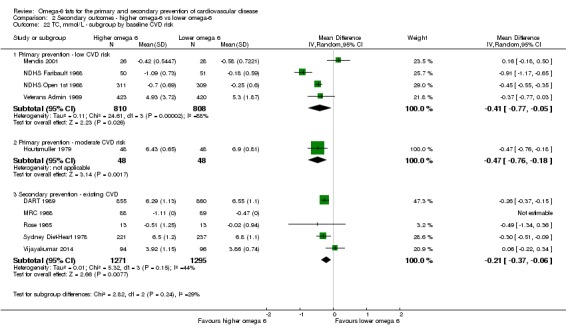
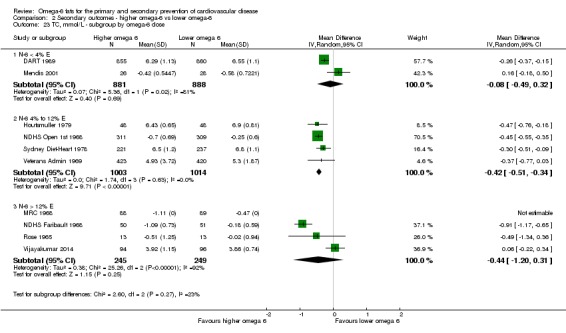
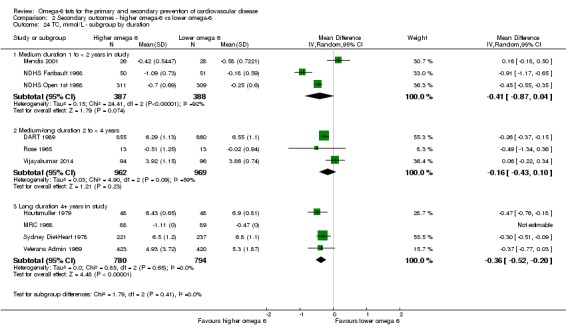
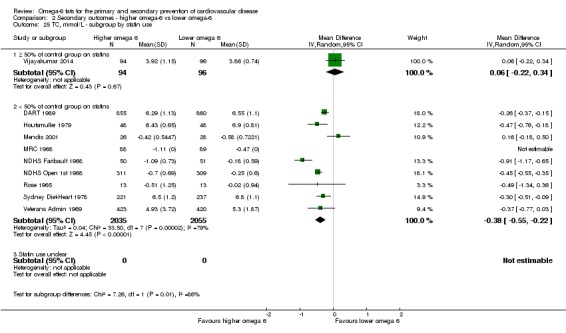
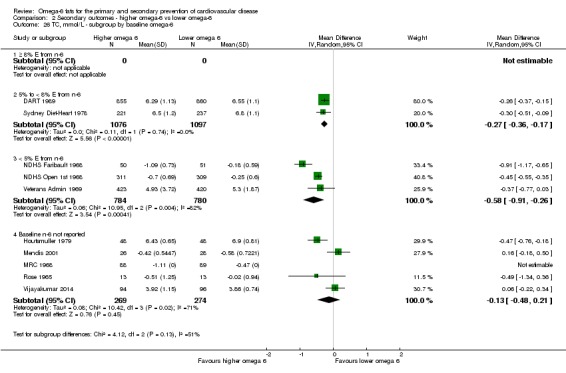
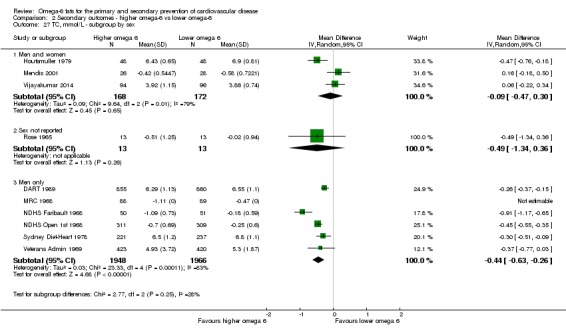
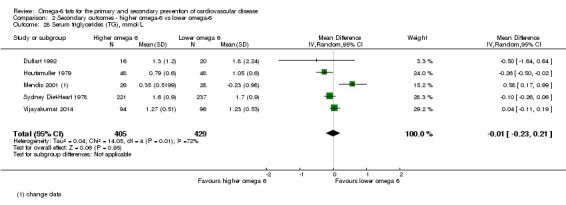
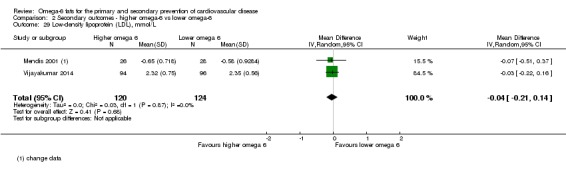
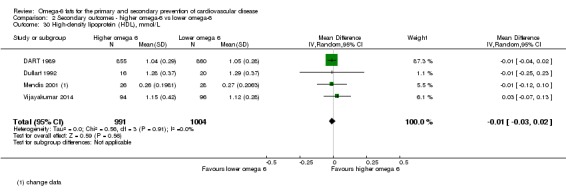
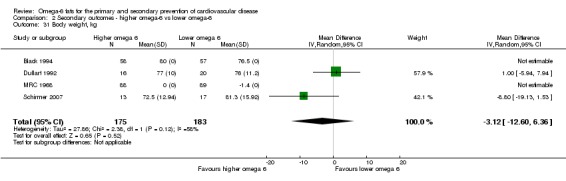
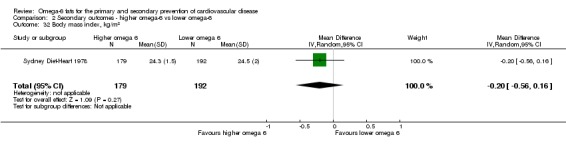
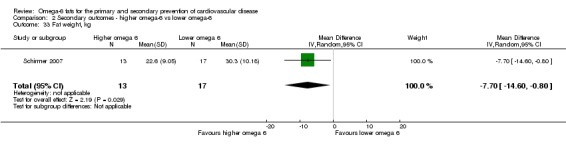
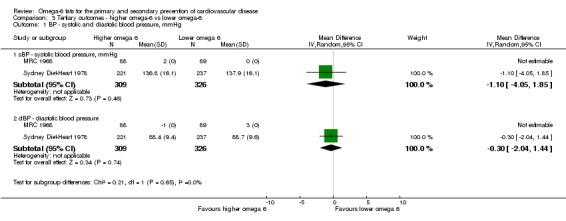
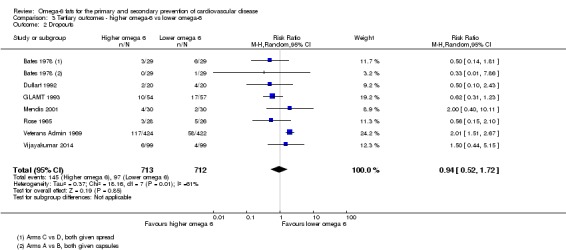
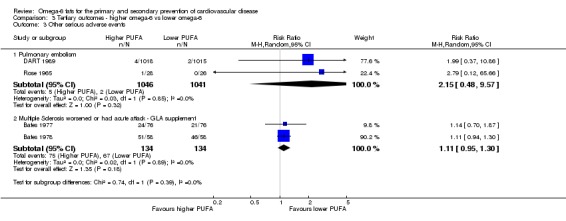
Main results: We included 19 RCTs in 6461 participants who were followed for one to eight years. Seven trials assessed the effects of supplemental GLA and 12 of LA, none DGLA or AA; the omega-6 fats usually displaced dietary saturated or monounsaturated fats. We assessed three RCTs as being at low summary risk of bias.Primary outcomes: we found low-quality evidence that increased intake of omega-6 fats may make little or no difference to all-cause mortality (risk ratio (RR) 1.00, 95% confidence interval (CI) 0.88 to 1.12, 740 deaths, 4506 randomised, 10 trials) or CVD events (RR 0.97, 95% CI 0.81 to 1.15, 1404 people experienced events of 4962 randomised, 7 trials). We are uncertain whether increasing omega-6 fats affects CVD mortality (RR 1.09, 95% CI 0.76 to 1.55, 472 deaths, 4019 randomised, 7 trials), coronary heart disease events (RR 0.88, 95% CI 0.66 to 1.17, 1059 people with events of 3997 randomised, 7 trials), major adverse cardiac and cerebrovascular events (RR 0.84, 95% CI 0.59 to 1.20, 817 events, 2879 participants, 2 trials) or stroke (RR 1.36, 95% CI 0.45 to 4.11, 54 events, 3730 participants, 4 trials), as we assessed the evidence as being of very low quality. We found no evidence of dose-response or duration effects for any primary outcome, but there was a suggestion of greater protection in participants with lower baseline omega-6 intake across outcomes.Additional key outcomes: we found increased intake of omega-6 fats may reduce myocardial infarction (MI) risk (RR 0.88, 95% CI 0.76 to 1.02, 609 events, 4606 participants, 7 trials, low-quality evidence). High-quality evidence suggests increasing omega-6 fats reduces total serum cholesterol a little in the long term (mean difference (MD) -0.33 mmol/L, 95% CI -0.50 to -0.16, I2 = 81%; heterogeneity partially explained by dose, 4280 participants, 10 trials). Increasing omega-6 fats probably has little or no effect on adiposity (body mass index (BMI) MD -0.20 kg/m2, 95% CI -0.56 to 0.16, 371 participants, 1 trial, moderate-quality evidence). It may make little or no difference to serum triglycerides (MD -0.01 mmol/L, 95% CI -0.23 to 0.21, 834 participants, 5 trials), HDL (MD -0.01 mmol/L, 95% CI -0.03 to 0.02, 1995 participants, 4 trials) or low-density lipoprotein (MD -0.04 mmol/L, 95% CI -0.21 to 0.14, 244 participants, 2 trials, low-quality evidence).

Authors' conclusions: This is the most extensive systematic assessment of effects of omega-6 fats on cardiovascular health, mortality, lipids and adiposity to date, using previously unpublished data. We found no evidence that increasing omega-6 fats reduces cardiovascular outcomes other than MI, where 53 people may need to increase omega-6 fat intake to prevent 1 person from experiencing MI. Although benefits of omega-6 fats remain to be proven, increasing omega-6 fats may be of benefit in people at high risk of MI. Increased omega-6 fats reduce serum total cholesterol but not other blood fat fractions or adiposity.


Conflict of interest statement

LH: WHO provided funding to the University of East Anglia to support this review update. Some of this funding was used to fund LH's employment. WHO also funded LH's attendance at WHO NUGAG Subgroup on Diet and Health and CODEX meetings to discuss and present this review and others in this set. No other conflicts known.

LA‐K: none known.

ASA: WHO provided funding to the University of East Anglia to support this review update. Some of this funding was used to fund ASA's employment. WHO also funded ASA's attendance at WHO NUGAG Subgroup on Diet and Health meetings to discuss and present this review and others in this set. No other conflicts known.

KR: none known.

JSB: WHO provided funding to the University of East Anglia to support this review update. Some of this funding was used to fund JSB's employment. No other conflicts known.

TJB: WHO provided funding to the University of East Anglia to support this review update. Some of this funding was used to fund TJB's employment. No other conflicts known.

SMAA: WHO provided funding to the University of East Anglia to support this review update. Some of this funding was used to fund SMAA's employment. No other conflicts known.

ATO'B: none known; carried out as part of his MBBS degree at the University of East Anglia.

LEW: none known; carried out as part of her MBBS degree at the University of East Anglia.

DHD: none known; carried out as part of her MBBS degree at the University of East Anglia.

FS: WHO provided funding to the University of East Anglia to support this review update. Some of this funding was used to fund FS's employment. No other conflicts known.

KHOD: WHO provided funding to the University of East Anglia to support this review update. Some of this funding was used to fund KHOD's employment. No other conflicts known.

Figures

Figure 1
Figure 1
Study flow diagram.
Figure 2
Figure 2
'Risk of bias' summary: review authors' judgements about each 'Risk of bias' item for each included study.
Figure 3
Figure 3
Forest plot of comparison: 1 Primary outcomes ‐ higher omega‐6 vs lower omega‐6, outcome: 1.1 All‐cause mortality (overall).
Figure 4
Figure 4
Forest plot of comparison: 1 Primary outcomes ‐ higher omega‐6 vs lower omega‐6, outcome: 1.23 Any cardiovascular event (overall).
Figure 5
Figure 5
Forest plot of comparison: 2 Secondary outcomes ‐ higher omega‐6 vs lower omega‐6, outcome: 2.1 Myocardial infarction (MI), overall.
Figure 6
Figure 6
Forest plot of comparison: 2 Secondary outcomes ‐ higher omega‐6 vs lower omega‐6, outcome: 2.17 Serum total cholesterol (TC), mmol/L.
Analysis 1.1
Analysis 1.1
Comparison 1 Primary outcomes ‐ higher omega‐6 vs lower omega‐6, Outcome 1 All‐cause mortality (overall).
Analysis 1.2
Analysis 1.2
Comparison 1 Primary outcomes ‐ higher omega‐6 vs lower omega‐6, Outcome 2 All‐cause mortality ‐ sensitivity analysis by fixed‐effect analysis.
Analysis 1.3
Analysis 1.3
Comparison 1 Primary outcomes ‐ higher omega‐6 vs lower omega‐6, Outcome 3 All‐cause mortality ‐ sensitivity analyses.
Analysis 1.4
Analysis 1.4
Comparison 1 Primary outcomes ‐ higher omega‐6 vs lower omega‐6, Outcome 4 All‐cause mortality ‐ subgroup by LA or GLA.
Analysis 1.5
Analysis 1.5
Comparison 1 Primary outcomes ‐ higher omega‐6 vs lower omega‐6, Outcome 5 All‐cause mortality ‐ subgroup by intervention type.
Analysis 1.6
Analysis 1.6
Comparison 1 Primary outcomes ‐ higher omega‐6 vs lower omega‐6, Outcome 6 All‐cause mortality ‐ subgroup by replacement.
Analysis 1.7
Analysis 1.7
Comparison 1 Primary outcomes ‐ higher omega‐6 vs lower omega‐6, Outcome 7 All‐cause mortality ‐ subgroup by baseline CVD risk.
Analysis 1.8
Analysis 1.8
Comparison 1 Primary outcomes ‐ higher omega‐6 vs lower omega‐6, Outcome 8 All‐cause mortality ‐ subgroup by omega‐6 dose.
Analysis 1.9
Analysis 1.9
Comparison 1 Primary outcomes ‐ higher omega‐6 vs lower omega‐6, Outcome 9 All‐cause mortality ‐ subgroup by duration.
Analysis 1.10
Analysis 1.10
Comparison 1 Primary outcomes ‐ higher omega‐6 vs lower omega‐6, Outcome 10 All‐cause mortality ‐ subgroup by statin use.
Analysis 1.11
Analysis 1.11
Comparison 1 Primary outcomes ‐ higher omega‐6 vs lower omega‐6, Outcome 11 All‐cause mortality ‐ subgroup by baseline omega‐6.
Analysis 1.12
Analysis 1.12
Comparison 1 Primary outcomes ‐ higher omega‐6 vs lower omega‐6, Outcome 12 All‐cause mortality ‐ subgroup by sex.
Analysis 1.13
Analysis 1.13
Comparison 1 Primary outcomes ‐ higher omega‐6 vs lower omega‐6, Outcome 13 Cardiovascular mortality (overall).
Analysis 1.14
Analysis 1.14
Comparison 1 Primary outcomes ‐ higher omega‐6 vs lower omega‐6, Outcome 14 CVD mortality ‐ sensitivity analysis by fixed‐effect analysis.
Analysis 1.15
Analysis 1.15
Comparison 1 Primary outcomes ‐ higher omega‐6 vs lower omega‐6, Outcome 15 CVD mortality ‐ sensitivity analyses.
Analysis 1.16
Analysis 1.16
Comparison 1 Primary outcomes ‐ higher omega‐6 vs lower omega‐6, Outcome 16 CVD mortality ‐ subgroup by intervention type.
Analysis 1.17
Analysis 1.17
Comparison 1 Primary outcomes ‐ higher omega‐6 vs lower omega‐6, Outcome 17 CVD mortality ‐ subgroup by replacement.
Analysis 1.18
Analysis 1.18
Comparison 1 Primary outcomes ‐ higher omega‐6 vs lower omega‐6, Outcome 18 CVD mortality ‐ subgroup by baseline CVD risk.
Analysis 1.19
Analysis 1.19
Comparison 1 Primary outcomes ‐ higher omega‐6 vs lower omega‐6, Outcome 19 CVD mortality ‐ subgroup by omega‐6 dose.
Analysis 1.20
Analysis 1.20
Comparison 1 Primary outcomes ‐ higher omega‐6 vs lower omega‐6, Outcome 20 CVD mortality ‐ subgroup by duration.
Analysis 1.21
Analysis 1.21
Comparison 1 Primary outcomes ‐ higher omega‐6 vs lower omega‐6, Outcome 21 CVD mortality ‐ subgroup by baseline omega‐6.
Analysis 1.22
Analysis 1.22
Comparison 1 Primary outcomes ‐ higher omega‐6 vs lower omega‐6, Outcome 22 CVD mortality ‐ subgroup by sex.
Analysis 1.23
Analysis 1.23
Comparison 1 Primary outcomes ‐ higher omega‐6 vs lower omega‐6, Outcome 23 Any cardiovascular event (overall).
Analysis 1.24
Analysis 1.24
Comparison 1 Primary outcomes ‐ higher omega‐6 vs lower omega‐6, Outcome 24 CVD events ‐ sensitivity analysis by fixed‐effect analysis.
Analysis 1.25
Analysis 1.25
Comparison 1 Primary outcomes ‐ higher omega‐6 vs lower omega‐6, Outcome 25 CVD events ‐ sensitivity analyses.
Analysis 1.26
Analysis 1.26
Comparison 1 Primary outcomes ‐ higher omega‐6 vs lower omega‐6, Outcome 26 CVD events ‐ subgroup by LA or GLA.
Analysis 1.27
Analysis 1.27
Comparison 1 Primary outcomes ‐ higher omega‐6 vs lower omega‐6, Outcome 27 CVD events ‐ subgroup by intervention type.
Analysis 1.28
Analysis 1.28
Comparison 1 Primary outcomes ‐ higher omega‐6 vs lower omega‐6, Outcome 28 CVD events ‐ subgroup by replacement.
Analysis 1.29
Analysis 1.29
Comparison 1 Primary outcomes ‐ higher omega‐6 vs lower omega‐6, Outcome 29 CVD events ‐ subgroup by baseline CVD risk.
Analysis 1.30
Analysis 1.30
Comparison 1 Primary outcomes ‐ higher omega‐6 vs lower omega‐6, Outcome 30 CVD events ‐ subgroup by primary vs secondary prevention.
Analysis 1.31
Analysis 1.31
Comparison 1 Primary outcomes ‐ higher omega‐6 vs lower omega‐6, Outcome 31 CVD events ‐ subgroup by omega‐6 dose.
Analysis 1.32
Analysis 1.32
Comparison 1 Primary outcomes ‐ higher omega‐6 vs lower omega‐6, Outcome 32 CVD events ‐ subgroup by duration.
Analysis 1.33
Analysis 1.33
Comparison 1 Primary outcomes ‐ higher omega‐6 vs lower omega‐6, Outcome 33 CVD events ‐ subgroup by baseline omega‐6.
Analysis 1.34
Analysis 1.34
Comparison 1 Primary outcomes ‐ higher omega‐6 vs lower omega‐6, Outcome 34 CVD events ‐ subgroup by sex.
Analysis 1.35
Analysis 1.35
Comparison 1 Primary outcomes ‐ higher omega‐6 vs lower omega‐6, Outcome 35 Coronary heart disease events (overall): myocardial infarction (fatal or non‐fatal) or angina.
Analysis 1.36
Analysis 1.36
Comparison 1 Primary outcomes ‐ higher omega‐6 vs lower omega‐6, Outcome 36 CHD events ‐ sensitivity analysis by fixed‐effect analysis.
Analysis 1.37
Analysis 1.37
Comparison 1 Primary outcomes ‐ higher omega‐6 vs lower omega‐6, Outcome 37 CHD events ‐ sensitivity analyses.
Analysis 1.38
Analysis 1.38
Comparison 1 Primary outcomes ‐ higher omega‐6 vs lower omega‐6, Outcome 38 CHD events ‐ subgroup by LA or GLA.
Analysis 1.39
Analysis 1.39
Comparison 1 Primary outcomes ‐ higher omega‐6 vs lower omega‐6, Outcome 39 CHD events ‐ subgroup by intervention type.
Analysis 1.40
Analysis 1.40
Comparison 1 Primary outcomes ‐ higher omega‐6 vs lower omega‐6, Outcome 40 CHD events ‐ subgroup by replacement.
Analysis 1.41
Analysis 1.41
Comparison 1 Primary outcomes ‐ higher omega‐6 vs lower omega‐6, Outcome 41 CHD events ‐ subgroup by baseline CVD risk.
Analysis 1.42
Analysis 1.42
Comparison 1 Primary outcomes ‐ higher omega‐6 vs lower omega‐6, Outcome 42 CHD events ‐ subgroup by omega‐6 dose.
Analysis 1.43
Analysis 1.43
Comparison 1 Primary outcomes ‐ higher omega‐6 vs lower omega‐6, Outcome 43 CHD events ‐ subgroup by duration.
Analysis 1.44
Analysis 1.44
Comparison 1 Primary outcomes ‐ higher omega‐6 vs lower omega‐6, Outcome 44 CHD events ‐ subgroup by baseline omega‐6.
Analysis 1.45
Analysis 1.45
Comparison 1 Primary outcomes ‐ higher omega‐6 vs lower omega‐6, Outcome 45 CHD events ‐ subgroup by sex.
Analysis 1.46
Analysis 1.46
Comparison 1 Primary outcomes ‐ higher omega‐6 vs lower omega‐6, Outcome 46 Major adverse cardiac and cerebrovascular events (MACCEs), overall.
Analysis 1.47
Analysis 1.47
Comparison 1 Primary outcomes ‐ higher omega‐6 vs lower omega‐6, Outcome 47 MACCEs ‐ sensitivity analysis by fixed‐effect analysis.
Analysis 1.48
Analysis 1.48
Comparison 1 Primary outcomes ‐ higher omega‐6 vs lower omega‐6, Outcome 48 MACCEs ‐ sensitivity analyses.
Analysis 1.49
Analysis 1.49
Comparison 1 Primary outcomes ‐ higher omega‐6 vs lower omega‐6, Outcome 49 MACCEs ‐ subgroup by intervention type.
Analysis 1.50
Analysis 1.50
Comparison 1 Primary outcomes ‐ higher omega‐6 vs lower omega‐6, Outcome 50 MACCEs ‐ subgroup by replacement.
Analysis 1.51
Analysis 1.51
Comparison 1 Primary outcomes ‐ higher omega‐6 vs lower omega‐6, Outcome 51 MACCEs ‐ subgroup by baseline CVD risk.
Analysis 1.52
Analysis 1.52
Comparison 1 Primary outcomes ‐ higher omega‐6 vs lower omega‐6, Outcome 52 MACCEs ‐ subgroup by omega‐6 dose.
Analysis 1.53
Analysis 1.53
Comparison 1 Primary outcomes ‐ higher omega‐6 vs lower omega‐6, Outcome 53 MACCEs ‐ subgroup by duration.
Analysis 1.54
Analysis 1.54
Comparison 1 Primary outcomes ‐ higher omega‐6 vs lower omega‐6, Outcome 54 MACCEs ‐ subgroup by baseline omega‐6.
Analysis 1.55
Analysis 1.55
Comparison 1 Primary outcomes ‐ higher omega‐6 vs lower omega‐6, Outcome 55 Stroke: fatal or non‐fatal (overall).
Analysis 1.56
Analysis 1.56
Comparison 1 Primary outcomes ‐ higher omega‐6 vs lower omega‐6, Outcome 56 Stroke ‐ sensitivity analysis by fixed‐effect analysis.
Analysis 1.57
Analysis 1.57
Comparison 1 Primary outcomes ‐ higher omega‐6 vs lower omega‐6, Outcome 57 Stroke ‐ sensitivity analyses.
Analysis 1.58
Analysis 1.58
Comparison 1 Primary outcomes ‐ higher omega‐6 vs lower omega‐6, Outcome 58 Stroke ‐ subgroup by intervention type.
Analysis 1.59
Analysis 1.59
Comparison 1 Primary outcomes ‐ higher omega‐6 vs lower omega‐6, Outcome 59 Stroke ‐ subgroup by replacement.
Analysis 1.60
Analysis 1.60
Comparison 1 Primary outcomes ‐ higher omega‐6 vs lower omega‐6, Outcome 60 Stroke ‐ subgroup by baseline CVD risk.
Analysis 1.61
Analysis 1.61
Comparison 1 Primary outcomes ‐ higher omega‐6 vs lower omega‐6, Outcome 61 Stroke ‐ subgroup by omega‐6 dose.
Analysis 1.62
Analysis 1.62
Comparison 1 Primary outcomes ‐ higher omega‐6 vs lower omega‐6, Outcome 62 Stroke ‐ subgroup by duration.
Analysis 1.63
Analysis 1.63
Comparison 1 Primary outcomes ‐ higher omega‐6 vs lower omega‐6, Outcome 63 Stroke ‐ subgroup by baseline omega‐6.
Analysis 1.64
Analysis 1.64
Comparison 1 Primary outcomes ‐ higher omega‐6 vs lower omega‐6, Outcome 64 Stroke ‐ subgroup by stroke type.
Analysis 1.65
Analysis 1.65
Comparison 1 Primary outcomes ‐ higher omega‐6 vs lower omega‐6, Outcome 65 Stroke ‐ subgroup by fatality.
Analysis 2.1
Analysis 2.1
Comparison 2 Secondary outcomes ‐ higher omega‐6 vs lower omega‐6, Outcome 1 Myocardial infarction (MI), overall.
Analysis 2.2
Analysis 2.2
Comparison 2 Secondary outcomes ‐ higher omega‐6 vs lower omega‐6, Outcome 2 MI ‐ sensitivity analysis by fixed‐effect analysis.
Analysis 2.3
Analysis 2.3
Comparison 2 Secondary outcomes ‐ higher omega‐6 vs lower omega‐6, Outcome 3 MI ‐ sensitivity analyses.
Analysis 2.4
Analysis 2.4
Comparison 2 Secondary outcomes ‐ higher omega‐6 vs lower omega‐6, Outcome 4 MI ‐ subgroup by intervention type.
Analysis 2.5
Analysis 2.5
Comparison 2 Secondary outcomes ‐ higher omega‐6 vs lower omega‐6, Outcome 5 MI ‐ subgroup by replacement.
Analysis 2.6
Analysis 2.6
Comparison 2 Secondary outcomes ‐ higher omega‐6 vs lower omega‐6, Outcome 6 MI ‐ subgroup by baseline CVD risk.
Analysis 2.7
Analysis 2.7
Comparison 2 Secondary outcomes ‐ higher omega‐6 vs lower omega‐6, Outcome 7 MI ‐ subgroup by omega‐6 dose.
Analysis 2.8
Analysis 2.8
Comparison 2 Secondary outcomes ‐ higher omega‐6 vs lower omega‐6, Outcome 8 MI ‐ subgroup by duration.
Analysis 2.9
Analysis 2.9
Comparison 2 Secondary outcomes ‐ higher omega‐6 vs lower omega‐6, Outcome 9 MI ‐ subgroup by statin use.
Analysis 2.10
Analysis 2.10
Comparison 2 Secondary outcomes ‐ higher omega‐6 vs lower omega‐6, Outcome 10 MI ‐ subgroup by baseline omega‐6.
Analysis 2.11
Analysis 2.11
Comparison 2 Secondary outcomes ‐ higher omega‐6 vs lower omega‐6, Outcome 11 MI ‐ subgroup by sex.
Analysis 2.12
Analysis 2.12
Comparison 2 Secondary outcomes ‐ higher omega‐6 vs lower omega‐6, Outcome 12 Angina.
Analysis 2.13
Analysis 2.13
Comparison 2 Secondary outcomes ‐ higher omega‐6 vs lower omega‐6, Outcome 13 Sudden cardiac death.
Analysis 2.14
Analysis 2.14
Comparison 2 Secondary outcomes ‐ higher omega‐6 vs lower omega‐6, Outcome 14 Heart failure.
Analysis 2.15
Analysis 2.15
Comparison 2 Secondary outcomes ‐ higher omega‐6 vs lower omega‐6, Outcome 15 Revascularisation ‐ angioplasty or coronary artery bypass grafting.
Analysis 2.16
Analysis 2.16
Comparison 2 Secondary outcomes ‐ higher omega‐6 vs lower omega‐6, Outcome 16 Peripheral arterial disease events.
Analysis 2.17
Analysis 2.17
Comparison 2 Secondary outcomes ‐ higher omega‐6 vs lower omega‐6, Outcome 17 Serum total cholesterol (TC), mmol/L.
Analysis 2.18
Analysis 2.18
Comparison 2 Secondary outcomes ‐ higher omega‐6 vs lower omega‐6, Outcome 18 TC, mmol/L ‐ sensitivity analysis by fixed‐effect analysis.
Analysis 2.19
Analysis 2.19
Comparison 2 Secondary outcomes ‐ higher omega‐6 vs lower omega‐6, Outcome 19 TC, mmol/L ‐ sensitivity analyses.
Analysis 2.20
Analysis 2.20
Comparison 2 Secondary outcomes ‐ higher omega‐6 vs lower omega‐6, Outcome 20 TC, mmol/L ‐ subgroup by intervention type.
Analysis 2.21
Analysis 2.21
Comparison 2 Secondary outcomes ‐ higher omega‐6 vs lower omega‐6, Outcome 21 TC, mmol/L ‐ subgroup by replacement.
Analysis 2.22
Analysis 2.22
Comparison 2 Secondary outcomes ‐ higher omega‐6 vs lower omega‐6, Outcome 22 TC, mmol/L ‐ subgroup by baseline CVD risk.
Analysis 2.23
Analysis 2.23
Comparison 2 Secondary outcomes ‐ higher omega‐6 vs lower omega‐6, Outcome 23 TC, mmol/L ‐ subgroup by omega‐6 dose.
Analysis 2.24
Analysis 2.24
Comparison 2 Secondary outcomes ‐ higher omega‐6 vs lower omega‐6, Outcome 24 TC, mmol/L ‐ subgroup by duration.
Analysis 2.25
Analysis 2.25
Comparison 2 Secondary outcomes ‐ higher omega‐6 vs lower omega‐6, Outcome 25 TC, mmol/L ‐ subgroup by statin use.
Analysis 2.26
Analysis 2.26
Comparison 2 Secondary outcomes ‐ higher omega‐6 vs lower omega‐6, Outcome 26 TC, mmol/L ‐ subgroup by baseline omega‐6.
Analysis 2.27
Analysis 2.27
Comparison 2 Secondary outcomes ‐ higher omega‐6 vs lower omega‐6, Outcome 27 TC, mmol/L ‐ subgroup by sex.
Analysis 2.28
Analysis 2.28
Comparison 2 Secondary outcomes ‐ higher omega‐6 vs lower omega‐6, Outcome 28 Serum triglycerides (TG), mmol/L.
Analysis 2.29
Analysis 2.29
Comparison 2 Secondary outcomes ‐ higher omega‐6 vs lower omega‐6, Outcome 29 Low‐density lipoprotein (LDL), mmol/L.
Analysis 2.30
Analysis 2.30
Comparison 2 Secondary outcomes ‐ higher omega‐6 vs lower omega‐6, Outcome 30 High‐density lipoprotein (HDL), mmol/L.
Analysis 2.31
Analysis 2.31
Comparison 2 Secondary outcomes ‐ higher omega‐6 vs lower omega‐6, Outcome 31 Body weight, kg.
Analysis 2.32
Analysis 2.32
Comparison 2 Secondary outcomes ‐ higher omega‐6 vs lower omega‐6, Outcome 32 Body mass index, kg/m2.
Analysis 2.33
Analysis 2.33
Comparison 2 Secondary outcomes ‐ higher omega‐6 vs lower omega‐6, Outcome 33 Fat weight, kg.
Analysis 3.1
Analysis 3.1
Comparison 3 Tertiary outcomes ‐ higher omega‐6 vs lower omega‐6, Outcome 1 BP ‐ systolic and diastolic blood pressure, mmHg.
Analysis 3.2
Analysis 3.2
Comparison 3 Tertiary outcomes ‐ higher omega‐6 vs lower omega‐6, Outcome 2 Dropouts.
Analysis 3.3
Analysis 3.3
Comparison 3 Tertiary outcomes ‐ higher omega‐6 vs lower omega‐6, Outcome 3 Other serious adverse events.

Update of

Comment in

References

References to studies included in this review

    1. Bates D, Fawcett PR, Shaw DA, Weightman D. Trial of polyunsaturated fatty acids in non‐relapsing multiple sclerosis. British Medical Journal 1977;2(6092):932‐3. - PMC - PubMed
    2. Dworkin RH, Bates D, Millar JH, Paty DW. Linoleic acid and multiple sclerosis: a reanalysis of three double‐blind trials. Neurology 1984;34(11):1441‐5. - PubMed
    1. Bates D, Fawcett PR, Shaw DA, Weightman D. Polyunsaturated fatty acids in treatment of acute remitting multiple sclerosis. British Medical Journal 1978;2(6149):1390‐1. - PMC - PubMed
    2. Dworkin RH, Bates D, Millar JH, Paty DW. Linoleic acid and multiple sclerosis: a reanalysis of three double‐blind trials. Neurology 1984;34(11):1441‐5. - PubMed
    1. Belch JJ, Ansell D, Madhok R, O'Dowd A, Sturrock RD. Effects of altering dietary essential fatty acids on requirements for non‐steroidal anti‐inflammatory drugs in patients with rheumatoid arthritis: a double blind placebo controlled study. Annals of the Rheumatic Diseases 1988;47(2):96‐104. - PMC - PubMed
    1. Black HS, Herd JA, Goldberg LH, Wolf‐JE J, Thornby JI, Rosen T, et al. Effect of a low‐fat diet on the incidence of actinic keratosis. New England Journal of Medicine 1994;330(18):1272‐5. - PubMed
    2. Black HS, Thornby JI, Wolf‐JE J, Goldberg LH, Herd JA, Rosen T, et al. Evidence that a low‐fat diet reduces the occurrence of non‐melanoma skin cancer. International Journal of Cancer 1995;62(2):165‐9. - PubMed
    3. Jaax S, Scott LW, Wolf‐JE J, Thornby JI, Black HS. General guidelines for a low‐fat diet effective in the management and prevention of nonmelanoma skin cancer. Nutrition and Cancer 1997;27(2):150‐6. - PubMed
    1. Burr ML, Fehily AM. Fish and the heart. Lancet 1989;ii:1450‐2. - PubMed
    2. Burr ML, Fehily AM, Gilbert JF, Rogers S, Holliday RM, Sweetnam PM, et al. Effects of changes in fat, fish, and fibre intakes on death and myocardial reinfarction: diet and reinfarction trial (DART). Lancet 1989;2(8666):757‐61. - PubMed
    3. Burr ML, Fehily AM, Rogers S, Welsby E, King S, Sandham S. Diet and reinfarction trial (DART): design, recruitment, and compliance. European Heart Journal 1989;10(6):558‐67. - PubMed
    4. Burr ML, Holliday RM, Fehily AM, Whitehead PJ. Haematological prognostic indices after myocardial infarction: evidence from the diet and reinfarction trial (DART). European Heart Journal 1992;13(2):166‐70. - PubMed
    5. Burr ML, Sweetham PM, Fehily AM. Diet and reinfarction (letter). European Heart Journal 1994;15(8):1152‐3. - PubMed
    6. Fehily AM, Vaughan‐Williams E, Shiels K, Williams AH, Horner M, Bingham G, et al. The effect of dietary advice on nutrient intakes: evidence from the diet and reinfarction trial (DART). Journal of Human Nutrition & Dietetics 1989;2(4):225‐5.

References to studies excluded from this review

    1. Bierenbaum ML, Green DP, Gherman C, Florin A, Caidwell AB. The effects of two low fat dietary patterns on the blood cholesterol level of young male coronary patients. Journal of Chronic Diseases 1963;16(10):1073‐83. - PubMed
    1. Bramkamp K, Wirths W. Influence of linoleic acid enriched margarine on serum cholesterol levels in the elderly [Über den Einfluß von linolsäurereicher Margarine auf den Serumcholesterinspiegel älterer Menschen]. Zeitschrift für Ernährungswissenschaft 1974;13(1‐2):59‐68. - PubMed
    1. Dembinska‐Kiec A, Malczewska‐Malec M, Roche H, Leszczynska‐Golabek I, Hartwich J, Wybranska I, et al. The effect of the n‐3/n‐6 PUFA ratio on the transformation of postprandial state proatherogenic LDL phenotype and oxidative stress parameters. Atherosclerosis Supplements 2010;11(2):129‐30.
    1. Dembinska‐Kiec A, Malczewska‐Malec M, Hartwich J, Wnek D, Goralska J, Kiec‐Wilk B, et al. The effect of dietary intervention on proatherogenic profile of lipoproteins and the blood oxidative stress parameters measured in the course of postprandial lipemia: Lipgene study. Journal of Diabetes 2011;3(s1):28.
    1. Elisha B, Guebre‐Egziabher F, Vidal H, Bastard J, Laville M, Rabasa‐Lhoret R. From French to Mediterranean diet: importance of the omega‐6/omega‐3 fatty acids ratio. World Review of Nutrition and Dietetics 2011;102:81‐91. - PubMed

References to ongoing studies

    1. Chandrakala G, Arpana G, Rao PV. Long‐term effects of a reduced fat diet intervention in pre‐diabetes. 70th Scientific Sessions of the American Diabetes Association; 25‐29 June 2010; Orlando (FL). 2010; Vol. professional.diabetes.org/meeting/scientific‐sessions/70th‐scientific‐se....
    2. Chandrakala G, Arpana G, Sreenivas T, Rao PV. Low‐fat (<20%) diets prevent type 2 diabetes mellitus. Diabetes 2012;61:A190.

Additional references

    1. Abdelhamid A, Hooper L, Welch A. Polyunsaturated fatty acids for musculoskeletal health and functional status in older adults. PROSPERO 2017 CRD42017079211. Available from: www.crd.york.ac.uk/PROSPERO/display_record.php?ID=CRD420....
    1. Abdelhamid AS, Brown TJ, Brainard JS, Biswas P, Thorpe GC, Moore HJ, et al. Omega‐3 fatty acids for the primary and secondary prevention of cardiovascular disease. Cochrane Database of Systematic Reviews 2018, Issue 6. [DOI: 10.1002/14651858.CD003177.pub3] - DOI - PMC - PubMed
    1. Abdelhamid AS, Martin N, Bridges C, Brainard JS, Wang X, Brown TJ, et al. Polyunsaturated fatty acids for the primary and secondary prevention of cardiovascular disease. Cochrane Database of Systematic Reviews 2018, Issue 6. [DOI: 10.1002/14651858.CD012345.pub2] - DOI - PMC - PubMed
    1. Aburto NJ, Ziolkovska A, Hooper L, Elliott P, Cappuccio FP, Meerpohl JJ. Effect of lower sodium intake on health: systematic review and meta‐analysis. BMJ 2013;346:F1326. [DOI: 10.1136/bmj.f1326] - DOI - PMC - PubMed
    1. Aburto NJ, Hanson S, Gutierrez H, Hooper L, Elliott P, Cappuccio FP. Effect of increased potassium intake on cardiovascular risk factors and disease: systematic review and meta‐analysis. BMJ 2013;346:f1378. [DOI: 10.1136/bmj.f1378] - DOI - PMC - PubMed

References to other published versions of this review

    1. Al‐Khudairy L, Hartley L, Clar C, Flowers N, Hooper L, Rees K. Omega 6 fatty acids for the primary prevention of cardiovascular disease. Cochrane Database of Systematic Reviews 2015;11:CD011094. - PubMed
    1. Hartley L, Clar C, Flowers N, Hooper L, Rees K. Omega 6 fatty acids for the primary prevention of cardiovascular disease. Cochrane Database of Systematic Reviews 2014, Issue 5. [DOI: 10.1002/14651858.CD011094] - DOI - PubMed

Publication types

MeSH terms

LinkOut - more resources