Meta-Analysis
. 2018 Jul 18;7(7):CD012345.
doi: 10.1002/14651858.CD012345.pub2.

Polyunsaturated fatty acids for the primary and secondary prevention of cardiovascular disease

Affiliations
Meta-Analysis

Polyunsaturated fatty acids for the primary and secondary prevention of cardiovascular disease

Asmaa S Abdelhamid et al. Cochrane Database Syst Rev. .

Update in

Abstract

Background: Evidence on the health effects of total polyunsaturated fatty acids (PUFA) is equivocal. Fish oils are rich in omega-3 PUFA and plant oils in omega-6 PUFA. Evidence suggests that increasing PUFA-rich foods, supplements or supplemented foods can reduce serum cholesterol, but may increase body weight, so overall cardiovascular effects are unclear.

Objectives: To assess effects of increasing total PUFA intake on cardiovascular disease and all-cause mortality, lipids and adiposity in adults.

Search methods: We searched CENTRAL, MEDLINE and Embase to April 2017 and clinicaltrials.gov and the World Health Organization International Clinical Trials Registry Platform to September 2016, without language restrictions. We checked trials included in relevant systematic reviews.

Selection criteria: We included randomised controlled trials (RCTs) comparing higher with lower PUFA intakes in adults with or without cardiovascular disease that assessed effects over 12 months or longer. We included full texts, abstracts, trials registry entries and unpublished data. Outcomes were all-cause mortality, cardiovascular disease mortality and events, risk factors (blood lipids, adiposity, blood pressure), and adverse events. We excluded trials where we could not separate effects of PUFA intake from other dietary, lifestyle or medication interventions.

Data collection and analysis: Two review authors independently screened titles and abstracts, assessed trials for inclusion, extracted data, and assessed risk of bias. We wrote to authors of included trials for further data. Meta-analyses used random-effects analysis, sensitivity analyses included fixed-effects and limiting to low summary risk of bias. We assessed GRADE quality of evidence.

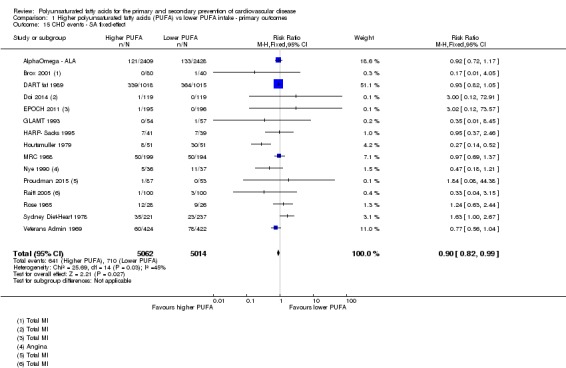
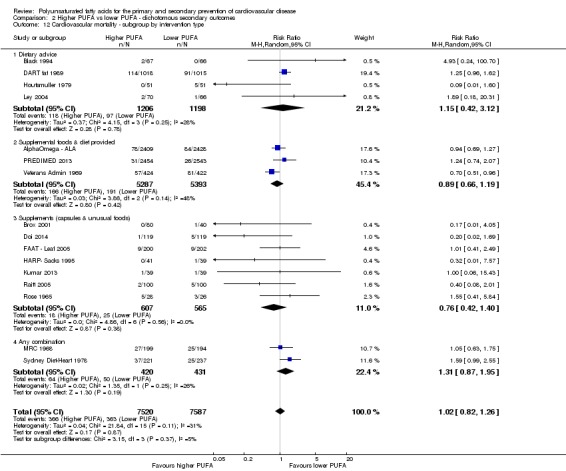
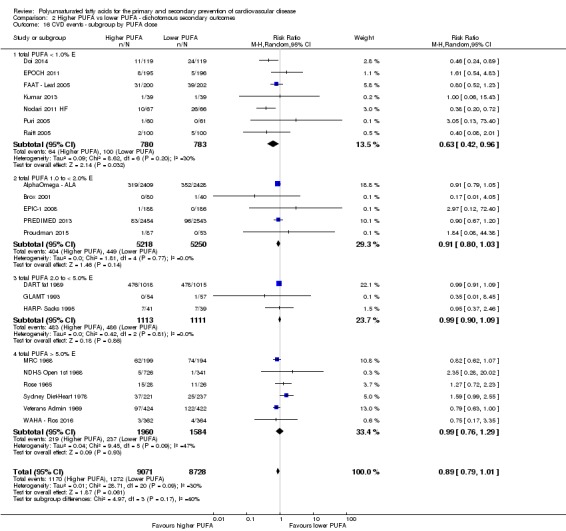
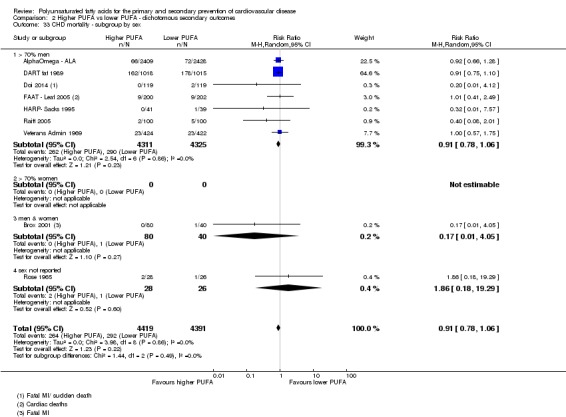
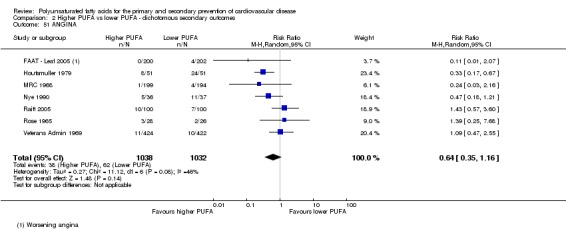
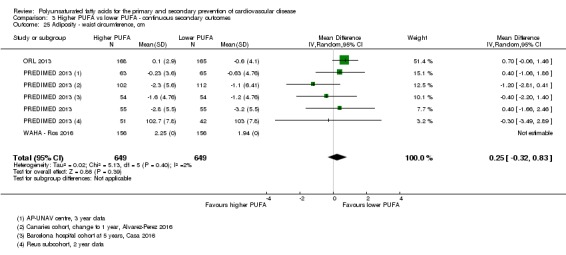
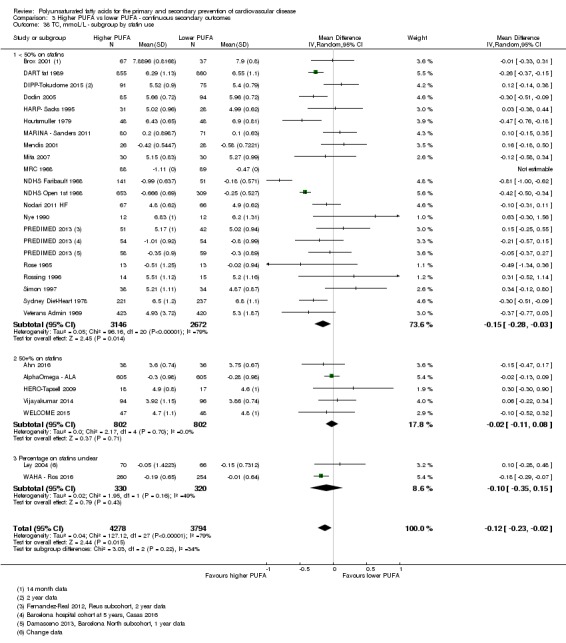
Main results: We included 49 RCTs randomising 24,272 participants, with duration of one to eight years. Eleven included trials were at low summary risk of bias, 33 recruited participants without cardiovascular disease. Baseline PUFA intake was unclear in most trials, but 3.9% to 8% of total energy intake where reported. Most trials gave supplemental capsules, but eight gave dietary advice, eight gave supplemental foods such as nuts or margarine, and three used a combination of methods to increase PUFA.Increasing PUFA intake probably has little or no effect on all-cause mortality (risk 7.8% vs 7.6%, risk ratio (RR) 0.98, 95% confidence interval (CI) 0.89 to 1.07, 19,290 participants in 24 trials), but probably slightly reduces risk of coronary heart disease events from 14.2% to 12.3% (RR 0.87, 95% CI 0.72 to 1.06, 15 trials, 10,076 participants) and cardiovascular disease events from 14.6% to 13.0% (RR 0.89, 95% CI 0.79 to 1.01, 17,799 participants in 21 trials), all moderate-quality evidence. Increasing PUFA may slightly reduce risk of coronary heart disease death (6.6% to 6.1%, RR 0.91, 95% CI 0.78 to 1.06, 9 trials, 8810 participants) andstroke (1.2% to 1.1%, RR 0.91, 95% CI 0.58 to 1.44, 11 trials, 14,742 participants, though confidence intervals include important harms), but has little or no effect on cardiovascular mortality (RR 1.02, 95% CI 0.82 to 1.26, 16 trials, 15,107 participants) all low-quality evidence. Effects of increasing PUFA on major adverse cardiac and cerebrovascular events and atrial fibrillation are unclear as evidence is of very low quality.Increasing PUFA intake slightly reduces total cholesterol (mean difference (MD) -0.12 mmol/L, 95% CI -0.23 to -0.02, 26 trials, 8072 participants) and probably slightly decreases triglycerides (MD -0.12 mmol/L, 95% CI -0.20 to -0.04, 20 trials, 3905 participants), but has little or no effect on high-density lipoprotein (HDL) (MD -0.01 mmol/L, 95% CI -0.02 to 0.01, 18 trials, 4674 participants) or low-density lipoprotein (LDL) (MD -0.01 mmol/L, 95% CI -0.09 to 0.06, 15 trials, 3362 participants). Increasing PUFA probably causes slight weight gain (MD 0.76 kg, 95% CI 0.34 to 1.19, 12 trials, 7100 participants).Effects of increasing PUFA on serious adverse events such as pulmonary embolism and bleeding are unclear as the evidence is of very low quality.

Authors' conclusions: This is the most extensive systematic review of RCTs conducted to date to assess effects of increasing PUFA on cardiovascular disease, mortality, lipids or adiposity. Increasing PUFA intake probably slightly reduces risk of coronary heart disease and cardiovascular disease events, may slightly reduce risk of coronary heart disease mortality and stroke (though not ruling out harms), but has little or no effect on all-cause or cardiovascular disease mortality. The mechanism may be via lipid reduction, but increasing PUFA probably slightly increases weight.


Conflict of interest statement

ASA: This review was funded by a grant from the World Health Organization. NM: None known CB: None known XW: This review was funded by a grant from the World Health Organization. JSB: This review was funded by a grant from the World Health Organization. TJB: This review was funded by a grant from the World Health Organization. SH: This review was funded by a grant from the World Health Organization. OFJ: This review was funded by a grant from the World Health Organization. SMAA: This review was funded by a grant from the World Health Organization. FS: This review was funded by a grant from the World Health Organization. KHOD: This review was funded by a grant from the World Health Organization. LH: This review was funded by a grant from the World Health Organization.

Figures

Figure 1
Figure 1
Study flow diagram
Figure 2
Figure 2
Risk of bias graph: review authors' judgements about each risk of bias item presented as percentages across all included trials
Figure 3
Figure 3
Risk of bias summary: review authors' judgements about each risk of bias item for each included trial
Figure 4
Figure 4
Funnel plot of comparison 2. Higher PUFA vs lower PUFA ‐ dichotomous secondary outcomes, outcome: 2.25 CORONARY HEART DISEASE (CHD) MORTALITY
Analysis 1.1
Analysis 1.1
Comparison 1 Higher polyunsaturated fatty acids (PUFA) vs lower PUFA intake ‐ primary outcomes, Outcome 1 ALL‐CAUSE MORTALITY.
Analysis 1.2
Analysis 1.2
Comparison 1 Higher polyunsaturated fatty acids (PUFA) vs lower PUFA intake ‐ primary outcomes, Outcome 2 All‐cause mortality ‐ SA.
Analysis 1.3
Analysis 1.3
Comparison 1 Higher polyunsaturated fatty acids (PUFA) vs lower PUFA intake ‐ primary outcomes, Outcome 3 All‐cause mortality ‐ SA fixed‐effect.
Analysis 1.4
Analysis 1.4
Comparison 1 Higher polyunsaturated fatty acids (PUFA) vs lower PUFA intake ‐ primary outcomes, Outcome 4 All‐cause mortality ‐ subgroup by PUFA dose.
Analysis 1.5
Analysis 1.5
Comparison 1 Higher polyunsaturated fatty acids (PUFA) vs lower PUFA intake ‐ primary outcomes, Outcome 5 All‐cause mortality ‐ subgroup by duration.
Analysis 1.6
Analysis 1.6
Comparison 1 Higher polyunsaturated fatty acids (PUFA) vs lower PUFA intake ‐ primary outcomes, Outcome 6 All‐cause mortality ‐ subgroup by primary or secondary prevention.
Analysis 1.7
Analysis 1.7
Comparison 1 Higher polyunsaturated fatty acids (PUFA) vs lower PUFA intake ‐ primary outcomes, Outcome 7 All‐cause mortality ‐ subgroup by baseline PUFA dose.
Analysis 1.8
Analysis 1.8
Comparison 1 Higher polyunsaturated fatty acids (PUFA) vs lower PUFA intake ‐ primary outcomes, Outcome 8 All‐cause mortality ‐ subgroup by replacement.
Analysis 1.9
Analysis 1.9
Comparison 1 Higher polyunsaturated fatty acids (PUFA) vs lower PUFA intake ‐ primary outcomes, Outcome 9 All‐cause mortality ‐ subgroup by sex.
Analysis 1.10
Analysis 1.10
Comparison 1 Higher polyunsaturated fatty acids (PUFA) vs lower PUFA intake ‐ primary outcomes, Outcome 10 All‐cause mortality ‐ subgroup by age.
Analysis 1.11
Analysis 1.11
Comparison 1 Higher polyunsaturated fatty acids (PUFA) vs lower PUFA intake ‐ primary outcomes, Outcome 11 All‐cause mortality ‐ subgroup by statin use.
Analysis 1.12
Analysis 1.12
Comparison 1 Higher polyunsaturated fatty acids (PUFA) vs lower PUFA intake ‐ primary outcomes, Outcome 12 All‐cause mortality ‐ subgroup by intervention type.
Analysis 1.13
Analysis 1.13
Comparison 1 Higher polyunsaturated fatty acids (PUFA) vs lower PUFA intake ‐ primary outcomes, Outcome 13 CORONARY HEART DISEASE (CHD) EVENTS: myocardial infarction (fatal or non‐fatal) or angina.
Analysis 1.14
Analysis 1.14
Comparison 1 Higher polyunsaturated fatty acids (PUFA) vs lower PUFA intake ‐ primary outcomes, Outcome 14 CHD events ‐ SA.
Analysis 1.15
Analysis 1.15
Comparison 1 Higher polyunsaturated fatty acids (PUFA) vs lower PUFA intake ‐ primary outcomes, Outcome 15 CHD events ‐ SA fixed‐effect.
Analysis 1.16
Analysis 1.16
Comparison 1 Higher polyunsaturated fatty acids (PUFA) vs lower PUFA intake ‐ primary outcomes, Outcome 16 CHD events ‐ subgroup by PUFA dose.
Analysis 1.17
Analysis 1.17
Comparison 1 Higher polyunsaturated fatty acids (PUFA) vs lower PUFA intake ‐ primary outcomes, Outcome 17 CHD events ‐ subgroup by duration.
Analysis 1.18
Analysis 1.18
Comparison 1 Higher polyunsaturated fatty acids (PUFA) vs lower PUFA intake ‐ primary outcomes, Outcome 18 CHD events ‐ subgroup by primary or secondary prevention.
Analysis 1.19
Analysis 1.19
Comparison 1 Higher polyunsaturated fatty acids (PUFA) vs lower PUFA intake ‐ primary outcomes, Outcome 19 CHD events ‐ subgroup by baseline PUFA dose.
Analysis 1.20
Analysis 1.20
Comparison 1 Higher polyunsaturated fatty acids (PUFA) vs lower PUFA intake ‐ primary outcomes, Outcome 20 CHD events ‐ subgroup by replacement.
Analysis 1.21
Analysis 1.21
Comparison 1 Higher polyunsaturated fatty acids (PUFA) vs lower PUFA intake ‐ primary outcomes, Outcome 21 CHD events ‐ subgroup by sex.
Analysis 1.22
Analysis 1.22
Comparison 1 Higher polyunsaturated fatty acids (PUFA) vs lower PUFA intake ‐ primary outcomes, Outcome 22 CHD events ‐ subgroup by age.
Analysis 1.23
Analysis 1.23
Comparison 1 Higher polyunsaturated fatty acids (PUFA) vs lower PUFA intake ‐ primary outcomes, Outcome 23 CHD events ‐ subgroup by statin use.
Analysis 1.24
Analysis 1.24
Comparison 1 Higher polyunsaturated fatty acids (PUFA) vs lower PUFA intake ‐ primary outcomes, Outcome 24 CHD events ‐ subgroup by intervention type.
Analysis 1.25
Analysis 1.25
Comparison 1 Higher polyunsaturated fatty acids (PUFA) vs lower PUFA intake ‐ primary outcomes, Outcome 25 STROKE ‐ fatal & non fatal.
Analysis 1.26
Analysis 1.26
Comparison 1 Higher polyunsaturated fatty acids (PUFA) vs lower PUFA intake ‐ primary outcomes, Outcome 26 Stroke ‐ SA.
Analysis 1.27
Analysis 1.27
Comparison 1 Higher polyunsaturated fatty acids (PUFA) vs lower PUFA intake ‐ primary outcomes, Outcome 27 Stroke ‐ SA fixed‐effect.
Analysis 1.28
Analysis 1.28
Comparison 1 Higher polyunsaturated fatty acids (PUFA) vs lower PUFA intake ‐ primary outcomes, Outcome 28 Stroke ‐ subgroup by PUFA dose.
Analysis 1.29
Analysis 1.29
Comparison 1 Higher polyunsaturated fatty acids (PUFA) vs lower PUFA intake ‐ primary outcomes, Outcome 29 Stroke ‐ subgroup by duration.
Analysis 1.30
Analysis 1.30
Comparison 1 Higher polyunsaturated fatty acids (PUFA) vs lower PUFA intake ‐ primary outcomes, Outcome 30 Stroke ‐ subgroup by primary or secondary prevention.
Analysis 1.31
Analysis 1.31
Comparison 1 Higher polyunsaturated fatty acids (PUFA) vs lower PUFA intake ‐ primary outcomes, Outcome 31 Stroke ‐ subgroup by baseline PUFA dose.
Analysis 1.32
Analysis 1.32
Comparison 1 Higher polyunsaturated fatty acids (PUFA) vs lower PUFA intake ‐ primary outcomes, Outcome 32 Stroke ‐ subgroup by replacement.
Analysis 1.33
Analysis 1.33
Comparison 1 Higher polyunsaturated fatty acids (PUFA) vs lower PUFA intake ‐ primary outcomes, Outcome 33 Stroke ‐ subgroup by sex.
Analysis 1.34
Analysis 1.34
Comparison 1 Higher polyunsaturated fatty acids (PUFA) vs lower PUFA intake ‐ primary outcomes, Outcome 34 Stroke ‐ subgroup by age.
Analysis 1.35
Analysis 1.35
Comparison 1 Higher polyunsaturated fatty acids (PUFA) vs lower PUFA intake ‐ primary outcomes, Outcome 35 Stroke ‐ subgroup by statin use.
Analysis 1.36
Analysis 1.36
Comparison 1 Higher polyunsaturated fatty acids (PUFA) vs lower PUFA intake ‐ primary outcomes, Outcome 36 Stroke ‐ subgroup by intervention type.
Analysis 1.37
Analysis 1.37
Comparison 1 Higher polyunsaturated fatty acids (PUFA) vs lower PUFA intake ‐ primary outcomes, Outcome 37 Stroke ‐ subgroup by fatal & non fatal.
Analysis 1.38
Analysis 1.38
Comparison 1 Higher polyunsaturated fatty acids (PUFA) vs lower PUFA intake ‐ primary outcomes, Outcome 38 Stroke ‐ subgroup by ischaemic & haemorrhagic.
Analysis 1.39
Analysis 1.39
Comparison 1 Higher polyunsaturated fatty acids (PUFA) vs lower PUFA intake ‐ primary outcomes, Outcome 39 MAJOR ADVERSE CARDIAC & CEREBROVASCULAR EVENTS (MACCEs).
Analysis 1.40
Analysis 1.40
Comparison 1 Higher polyunsaturated fatty acids (PUFA) vs lower PUFA intake ‐ primary outcomes, Outcome 40 MACCEs ‐ SA.
Analysis 1.41
Analysis 1.41
Comparison 1 Higher polyunsaturated fatty acids (PUFA) vs lower PUFA intake ‐ primary outcomes, Outcome 41 MACCEs ‐ SA fixed‐effect.
Analysis 1.42
Analysis 1.42
Comparison 1 Higher polyunsaturated fatty acids (PUFA) vs lower PUFA intake ‐ primary outcomes, Outcome 42 MACCEs ‐ subgroup by PUFA dose.
Analysis 1.43
Analysis 1.43
Comparison 1 Higher polyunsaturated fatty acids (PUFA) vs lower PUFA intake ‐ primary outcomes, Outcome 43 MACCEs ‐ subgroup by duration.
Analysis 1.44
Analysis 1.44
Comparison 1 Higher polyunsaturated fatty acids (PUFA) vs lower PUFA intake ‐ primary outcomes, Outcome 44 MACCEs ‐ subgroup by primary or secondary prevention.
Analysis 1.45
Analysis 1.45
Comparison 1 Higher polyunsaturated fatty acids (PUFA) vs lower PUFA intake ‐ primary outcomes, Outcome 45 MACCEs ‐ subgroup by baseline PUFA dose.
Analysis 1.46
Analysis 1.46
Comparison 1 Higher polyunsaturated fatty acids (PUFA) vs lower PUFA intake ‐ primary outcomes, Outcome 46 MACCEs ‐ subgroup by replacement.
Analysis 1.47
Analysis 1.47
Comparison 1 Higher polyunsaturated fatty acids (PUFA) vs lower PUFA intake ‐ primary outcomes, Outcome 47 MACCEs ‐ subgroup by sex.
Analysis 1.48
Analysis 1.48
Comparison 1 Higher polyunsaturated fatty acids (PUFA) vs lower PUFA intake ‐ primary outcomes, Outcome 48 MACCEs ‐ subgroup by age.
Analysis 1.49
Analysis 1.49
Comparison 1 Higher polyunsaturated fatty acids (PUFA) vs lower PUFA intake ‐ primary outcomes, Outcome 49 MACCEs ‐ subgroup by statin use.
Analysis 1.50
Analysis 1.50
Comparison 1 Higher polyunsaturated fatty acids (PUFA) vs lower PUFA intake ‐ primary outcomes, Outcome 50 MACCEs ‐ subgroup by intervention type.
Analysis 2.1
Analysis 2.1
Comparison 2 Higher PUFA vs lower PUFA ‐ dichotomous secondary outcomes, Outcome 1 CARDIOVASCULAR MORTALITY.
Analysis 2.2
Analysis 2.2
Comparison 2 Higher PUFA vs lower PUFA ‐ dichotomous secondary outcomes, Outcome 2 Cardiovascular mortality ‐ SA.
Analysis 2.3
Analysis 2.3
Comparison 2 Higher PUFA vs lower PUFA ‐ dichotomous secondary outcomes, Outcome 3 Cardiovascular mortality ‐ SA fixed‐effect.
Analysis 2.4
Analysis 2.4
Comparison 2 Higher PUFA vs lower PUFA ‐ dichotomous secondary outcomes, Outcome 4 Cardiovascular mortality ‐ subgroup by PUFA dose.
Analysis 2.5
Analysis 2.5
Comparison 2 Higher PUFA vs lower PUFA ‐ dichotomous secondary outcomes, Outcome 5 Cardiovascular mortality ‐ subgroup by duration.
Analysis 2.6
Analysis 2.6
Comparison 2 Higher PUFA vs lower PUFA ‐ dichotomous secondary outcomes, Outcome 6 Cardiovascular mortality ‐ subgroup by primary or secondary prevention.
Analysis 2.7
Analysis 2.7
Comparison 2 Higher PUFA vs lower PUFA ‐ dichotomous secondary outcomes, Outcome 7 Cardiovascular mortality ‐ subgroup by baseline PUFA dose.
Analysis 2.8
Analysis 2.8
Comparison 2 Higher PUFA vs lower PUFA ‐ dichotomous secondary outcomes, Outcome 8 Cardiovascular mortality ‐ subgroup by replacement.
Analysis 2.9
Analysis 2.9
Comparison 2 Higher PUFA vs lower PUFA ‐ dichotomous secondary outcomes, Outcome 9 Cardiovascular mortality ‐ subgroup by sex.
Analysis 2.10
Analysis 2.10
Comparison 2 Higher PUFA vs lower PUFA ‐ dichotomous secondary outcomes, Outcome 10 Cardiovascular mortality ‐ subgroup by age.
Analysis 2.11
Analysis 2.11
Comparison 2 Higher PUFA vs lower PUFA ‐ dichotomous secondary outcomes, Outcome 11 Cardiovascular mortality ‐ subgroup by statin use.
Analysis 2.12
Analysis 2.12
Comparison 2 Higher PUFA vs lower PUFA ‐ dichotomous secondary outcomes, Outcome 12 Cardiovascular mortality ‐ subgroup by intervention type.
Analysis 2.13
Analysis 2.13
Comparison 2 Higher PUFA vs lower PUFA ‐ dichotomous secondary outcomes, Outcome 13 CARDIOVASCULAR EVENTS.
Analysis 2.14
Analysis 2.14
Comparison 2 Higher PUFA vs lower PUFA ‐ dichotomous secondary outcomes, Outcome 14 CVD events ‐ SA.
Analysis 2.15
Analysis 2.15
Comparison 2 Higher PUFA vs lower PUFA ‐ dichotomous secondary outcomes, Outcome 15 CVD events ‐ SA fixed‐effect.
Analysis 2.16
Analysis 2.16
Comparison 2 Higher PUFA vs lower PUFA ‐ dichotomous secondary outcomes, Outcome 16 CVD events ‐ subgroup by PUFA dose.
Analysis 2.17
Analysis 2.17
Comparison 2 Higher PUFA vs lower PUFA ‐ dichotomous secondary outcomes, Outcome 17 CVD events ‐ subgroup by duration.
Analysis 2.18
Analysis 2.18
Comparison 2 Higher PUFA vs lower PUFA ‐ dichotomous secondary outcomes, Outcome 18 CVD events ‐ subgroup by primary or secondary prevention.
Analysis 2.19
Analysis 2.19
Comparison 2 Higher PUFA vs lower PUFA ‐ dichotomous secondary outcomes, Outcome 19 CVD events ‐ subgroup by baseline PUFA dose.
Analysis 2.20
Analysis 2.20
Comparison 2 Higher PUFA vs lower PUFA ‐ dichotomous secondary outcomes, Outcome 20 CVD events ‐ subgroup by replacement.
Analysis 2.21
Analysis 2.21
Comparison 2 Higher PUFA vs lower PUFA ‐ dichotomous secondary outcomes, Outcome 21 CVD events ‐ subgroup by sex.
Analysis 2.22
Analysis 2.22
Comparison 2 Higher PUFA vs lower PUFA ‐ dichotomous secondary outcomes, Outcome 22 CVD events ‐ subgroup by age.
Analysis 2.23
Analysis 2.23
Comparison 2 Higher PUFA vs lower PUFA ‐ dichotomous secondary outcomes, Outcome 23 CVD events ‐ subgroup by statin use.
Analysis 2.24
Analysis 2.24
Comparison 2 Higher PUFA vs lower PUFA ‐ dichotomous secondary outcomes, Outcome 24 CVD events ‐ subgroup by intervention type.
Analysis 2.25
Analysis 2.25
Comparison 2 Higher PUFA vs lower PUFA ‐ dichotomous secondary outcomes, Outcome 25 CORONARY HEART DISEASE (CHD) MORTALITY.
Analysis 2.26
Analysis 2.26
Comparison 2 Higher PUFA vs lower PUFA ‐ dichotomous secondary outcomes, Outcome 26 CHD mortality ‐ SA.
Analysis 2.27
Analysis 2.27
Comparison 2 Higher PUFA vs lower PUFA ‐ dichotomous secondary outcomes, Outcome 27 CHD mortality ‐ SA fixed‐effect.
Analysis 2.28
Analysis 2.28
Comparison 2 Higher PUFA vs lower PUFA ‐ dichotomous secondary outcomes, Outcome 28 CHD mortality ‐ subgroup by PUFA dose.
Analysis 2.29
Analysis 2.29
Comparison 2 Higher PUFA vs lower PUFA ‐ dichotomous secondary outcomes, Outcome 29 CHD mortality ‐ subgroup by duration.
Analysis 2.30
Analysis 2.30
Comparison 2 Higher PUFA vs lower PUFA ‐ dichotomous secondary outcomes, Outcome 30 CHD mortality ‐ subgroup by primary or secondary prevention.
Analysis 2.31
Analysis 2.31
Comparison 2 Higher PUFA vs lower PUFA ‐ dichotomous secondary outcomes, Outcome 31 CHD mortality ‐ subgroup by baseline PUFA dose.
Analysis 2.32
Analysis 2.32
Comparison 2 Higher PUFA vs lower PUFA ‐ dichotomous secondary outcomes, Outcome 32 CHD mortality ‐ subgroup by replacement.
Analysis 2.33
Analysis 2.33
Comparison 2 Higher PUFA vs lower PUFA ‐ dichotomous secondary outcomes, Outcome 33 CHD mortality ‐ subgroup by sex.
Analysis 2.34
Analysis 2.34
Comparison 2 Higher PUFA vs lower PUFA ‐ dichotomous secondary outcomes, Outcome 34 CHD mortality ‐ subgroup by age.
Analysis 2.35
Analysis 2.35
Comparison 2 Higher PUFA vs lower PUFA ‐ dichotomous secondary outcomes, Outcome 35 CHD mortality ‐ subgroup by statin use.
Analysis 2.36
Analysis 2.36
Comparison 2 Higher PUFA vs lower PUFA ‐ dichotomous secondary outcomes, Outcome 36 CHD mortality ‐ subgroup by intervention type.
Analysis 2.37
Analysis 2.37
Comparison 2 Higher PUFA vs lower PUFA ‐ dichotomous secondary outcomes, Outcome 37 MYOCARDIAL INFARCTION (MI) ‐ fatal and non fatal.
Analysis 2.38
Analysis 2.38
Comparison 2 Higher PUFA vs lower PUFA ‐ dichotomous secondary outcomes, Outcome 38 SUDDEN CARDIAC DEATH (SCD).
Analysis 2.39
Analysis 2.39
Comparison 2 Higher PUFA vs lower PUFA ‐ dichotomous secondary outcomes, Outcome 39 ATRIAL FIBRILLATION (AF) & ARRHYTHMIAS (including AF, ventricular tachycardia (VT), ventricular fibrillation(VF).
Analysis 2.40
Analysis 2.40
Comparison 2 Higher PUFA vs lower PUFA ‐ dichotomous secondary outcomes, Outcome 40 AF ‐ SA.
Analysis 2.41
Analysis 2.41
Comparison 2 Higher PUFA vs lower PUFA ‐ dichotomous secondary outcomes, Outcome 41 AF ‐ SA fixed‐effect.
Analysis 2.42
Analysis 2.42
Comparison 2 Higher PUFA vs lower PUFA ‐ dichotomous secondary outcomes, Outcome 42 AF ‐ subgroup by PUFA dose.
Analysis 2.43
Analysis 2.43
Comparison 2 Higher PUFA vs lower PUFA ‐ dichotomous secondary outcomes, Outcome 43 AF ‐ subgroup by duration.
Analysis 2.44
Analysis 2.44
Comparison 2 Higher PUFA vs lower PUFA ‐ dichotomous secondary outcomes, Outcome 44 AF ‐ subgroup by primary or secondary prevention.
Analysis 2.45
Analysis 2.45
Comparison 2 Higher PUFA vs lower PUFA ‐ dichotomous secondary outcomes, Outcome 45 Atrial fibrillation ‐ subgroup by baseline PUFA dose.
Analysis 2.46
Analysis 2.46
Comparison 2 Higher PUFA vs lower PUFA ‐ dichotomous secondary outcomes, Outcome 46 AF ‐ subgroup by replacement.
Analysis 2.47
Analysis 2.47
Comparison 2 Higher PUFA vs lower PUFA ‐ dichotomous secondary outcomes, Outcome 47 Atrial fibrillation ‐ subgroup by sex.
Analysis 2.48
Analysis 2.48
Comparison 2 Higher PUFA vs lower PUFA ‐ dichotomous secondary outcomes, Outcome 48 AF ‐ subgroup by age.
Analysis 2.49
Analysis 2.49
Comparison 2 Higher PUFA vs lower PUFA ‐ dichotomous secondary outcomes, Outcome 49 AF ‐ subgroup by statin use.
Analysis 2.50
Analysis 2.50
Comparison 2 Higher PUFA vs lower PUFA ‐ dichotomous secondary outcomes, Outcome 50 AF ‐ subgroup by intervention type.
Analysis 2.51
Analysis 2.51
Comparison 2 Higher PUFA vs lower PUFA ‐ dichotomous secondary outcomes, Outcome 51 ANGINA.
Analysis 2.52
Analysis 2.52
Comparison 2 Higher PUFA vs lower PUFA ‐ dichotomous secondary outcomes, Outcome 52 HEART FAILURE.
Analysis 2.53
Analysis 2.53
Comparison 2 Higher PUFA vs lower PUFA ‐ dichotomous secondary outcomes, Outcome 53 PERIPHERAL ARTERIAL DISEASE (PAD).
Analysis 2.54
Analysis 2.54
Comparison 2 Higher PUFA vs lower PUFA ‐ dichotomous secondary outcomes, Outcome 54 REVASCULARISATION ‐ angioplasty and/or coronary artery bypass grafting.
Analysis 3.1
Analysis 3.1
Comparison 3 Higher PUFA vs lower PUFA ‐ continuous secondary outcomes, Outcome 1 ADIPOSITY ‐ BODY WEIGHT, kg.
Analysis 3.2
Analysis 3.2
Comparison 3 Higher PUFA vs lower PUFA ‐ continuous secondary outcomes, Outcome 2 Body weight, kg ‐ SA.
Analysis 3.3
Analysis 3.3
Comparison 3 Higher PUFA vs lower PUFA ‐ continuous secondary outcomes, Outcome 3 Body weight, kg ‐ SA fixed‐effect.
Analysis 3.4
Analysis 3.4
Comparison 3 Higher PUFA vs lower PUFA ‐ continuous secondary outcomes, Outcome 4 Body weight, kg ‐ subgroup by PUFA dose.
Analysis 3.5
Analysis 3.5
Comparison 3 Higher PUFA vs lower PUFA ‐ continuous secondary outcomes, Outcome 5 Body weight, kg ‐ subgroup by duration.
Analysis 3.6
Analysis 3.6
Comparison 3 Higher PUFA vs lower PUFA ‐ continuous secondary outcomes, Outcome 6 Body weight, kg ‐ subgroup by primary or secondary prevention.
Analysis 3.7
Analysis 3.7
Comparison 3 Higher PUFA vs lower PUFA ‐ continuous secondary outcomes, Outcome 7 Body weight, kg ‐ subgroup by baseline PUFA dose.
Analysis 3.8
Analysis 3.8
Comparison 3 Higher PUFA vs lower PUFA ‐ continuous secondary outcomes, Outcome 8 Body weight, kg ‐ subgroup by replacement.
Analysis 3.9
Analysis 3.9
Comparison 3 Higher PUFA vs lower PUFA ‐ continuous secondary outcomes, Outcome 9 Body weight, kg ‐ subgroup by sex.
Analysis 3.10
Analysis 3.10
Comparison 3 Higher PUFA vs lower PUFA ‐ continuous secondary outcomes, Outcome 10 Body weight, kg ‐ subgroup by age.
Analysis 3.11
Analysis 3.11
Comparison 3 Higher PUFA vs lower PUFA ‐ continuous secondary outcomes, Outcome 11 Body weight, kg ‐ subgroup by statin use.
Analysis 3.12
Analysis 3.12
Comparison 3 Higher PUFA vs lower PUFA ‐ continuous secondary outcomes, Outcome 12 Body weight, kg ‐ subgroup by intervention type.
Analysis 3.13
Analysis 3.13
Comparison 3 Higher PUFA vs lower PUFA ‐ continuous secondary outcomes, Outcome 13 ADIPOSITY ‐ Body Mass Index (BMI), kg/m2.
Analysis 3.14
Analysis 3.14
Comparison 3 Higher PUFA vs lower PUFA ‐ continuous secondary outcomes, Outcome 14 BMI, kg/m2 ‐ SA.
Analysis 3.15
Analysis 3.15
Comparison 3 Higher PUFA vs lower PUFA ‐ continuous secondary outcomes, Outcome 15 BMI, kg/m2 ‐ SA fixed‐effect.
Analysis 3.16
Analysis 3.16
Comparison 3 Higher PUFA vs lower PUFA ‐ continuous secondary outcomes, Outcome 16 BMI, kg/m2 ‐ subgroup by PUFA dose.
Analysis 3.17
Analysis 3.17
Comparison 3 Higher PUFA vs lower PUFA ‐ continuous secondary outcomes, Outcome 17 BMI, kg/m2 ‐ subgroup by duration.
Analysis 3.18
Analysis 3.18
Comparison 3 Higher PUFA vs lower PUFA ‐ continuous secondary outcomes, Outcome 18 BMI, kg/m2 ‐ subgroup by primary or secondary prevention.
Analysis 3.19
Analysis 3.19
Comparison 3 Higher PUFA vs lower PUFA ‐ continuous secondary outcomes, Outcome 19 BMI, kg/m2 ‐ subgroup by baseline PUFA dose.
Analysis 3.20
Analysis 3.20
Comparison 3 Higher PUFA vs lower PUFA ‐ continuous secondary outcomes, Outcome 20 BMI, kg/m2 ‐ subgroup by replacement.
Analysis 3.21
Analysis 3.21
Comparison 3 Higher PUFA vs lower PUFA ‐ continuous secondary outcomes, Outcome 21 BMI, kg/m2 ‐ subgroup by sex.
Analysis 3.22
Analysis 3.22
Comparison 3 Higher PUFA vs lower PUFA ‐ continuous secondary outcomes, Outcome 22 BMI, kg/m2 ‐ subgroup by age.
Analysis 3.23
Analysis 3.23
Comparison 3 Higher PUFA vs lower PUFA ‐ continuous secondary outcomes, Outcome 23 BMI, kg/m2 ‐ subgroup by statin use.
Analysis 3.24
Analysis 3.24
Comparison 3 Higher PUFA vs lower PUFA ‐ continuous secondary outcomes, Outcome 24 BMI, kg/m2 ‐ subgroup by intervention type.
Analysis 3.25
Analysis 3.25
Comparison 3 Higher PUFA vs lower PUFA ‐ continuous secondary outcomes, Outcome 25 Adiposity ‐ waist circumference, cm.
Analysis 3.26
Analysis 3.26
Comparison 3 Higher PUFA vs lower PUFA ‐ continuous secondary outcomes, Outcome 26 Adiposity ‐ % body fat.
Analysis 3.27
Analysis 3.27
Comparison 3 Higher PUFA vs lower PUFA ‐ continuous secondary outcomes, Outcome 27 Adiposity ‐ body fat, kg.
Analysis 3.28
Analysis 3.28
Comparison 3 Higher PUFA vs lower PUFA ‐ continuous secondary outcomes, Outcome 28 Serum TOTAL CHOLESTEROL (TC, mmoL/L).
Analysis 3.29
Analysis 3.29
Comparison 3 Higher PUFA vs lower PUFA ‐ continuous secondary outcomes, Outcome 29 TC, mmoL/L ‐ SA.
Analysis 3.30
Analysis 3.30
Comparison 3 Higher PUFA vs lower PUFA ‐ continuous secondary outcomes, Outcome 30 TC, mmoL/L ‐ SA fixed‐effect.
Analysis 3.31
Analysis 3.31
Comparison 3 Higher PUFA vs lower PUFA ‐ continuous secondary outcomes, Outcome 31 TC, mmoL/L ‐ subgroup by PUFA dose.
Analysis 3.32
Analysis 3.32
Comparison 3 Higher PUFA vs lower PUFA ‐ continuous secondary outcomes, Outcome 32 TC, mmoL/L ‐ subgroup by duration.
Analysis 3.33
Analysis 3.33
Comparison 3 Higher PUFA vs lower PUFA ‐ continuous secondary outcomes, Outcome 33 TC, mmoL/L ‐ subgroup by primary or secondary prevention.
Analysis 3.34
Analysis 3.34
Comparison 3 Higher PUFA vs lower PUFA ‐ continuous secondary outcomes, Outcome 34 TC, mmoL/L ‐ subgroup by baseline PUFA dose.
Analysis 3.35
Analysis 3.35
Comparison 3 Higher PUFA vs lower PUFA ‐ continuous secondary outcomes, Outcome 35 TC, mmoL/L ‐ subgroup by replacement.
Analysis 3.36
Analysis 3.36
Comparison 3 Higher PUFA vs lower PUFA ‐ continuous secondary outcomes, Outcome 36 TC, mmoL/L ‐ subgroup by sex.
Analysis 3.37
Analysis 3.37
Comparison 3 Higher PUFA vs lower PUFA ‐ continuous secondary outcomes, Outcome 37 TC, mmoL/L ‐ subgroup by age.
Analysis 3.38
Analysis 3.38
Comparison 3 Higher PUFA vs lower PUFA ‐ continuous secondary outcomes, Outcome 38 TC, mmoL/L ‐ subgroup by statin use.
Analysis 3.39
Analysis 3.39
Comparison 3 Higher PUFA vs lower PUFA ‐ continuous secondary outcomes, Outcome 39 TC, mmoL/L ‐ subgroup by intervention type.
Analysis 3.40
Analysis 3.40
Comparison 3 Higher PUFA vs lower PUFA ‐ continuous secondary outcomes, Outcome 40 Serum fasting TRIGLYCERIDE (TG, mmoL/L).
Analysis 3.41
Analysis 3.41
Comparison 3 Higher PUFA vs lower PUFA ‐ continuous secondary outcomes, Outcome 41 TG, mmoL/L ‐ SA.
Analysis 3.42
Analysis 3.42
Comparison 3 Higher PUFA vs lower PUFA ‐ continuous secondary outcomes, Outcome 42 TG, mmoL/L ‐ SA fixed‐effect.
Analysis 3.43
Analysis 3.43
Comparison 3 Higher PUFA vs lower PUFA ‐ continuous secondary outcomes, Outcome 43 TG, mmoL/L ‐ subgroup by PUFA dose.
Analysis 3.44
Analysis 3.44
Comparison 3 Higher PUFA vs lower PUFA ‐ continuous secondary outcomes, Outcome 44 TG, mmoL/L ‐ subgroup by duration.
Analysis 3.45
Analysis 3.45
Comparison 3 Higher PUFA vs lower PUFA ‐ continuous secondary outcomes, Outcome 45 TG, mmoL/L ‐ subgroup by primary or secondary prevention.
Analysis 3.46
Analysis 3.46
Comparison 3 Higher PUFA vs lower PUFA ‐ continuous secondary outcomes, Outcome 46 TG, mmoL/L ‐ subgroup by baseline PUFA dose.
Analysis 3.47
Analysis 3.47
Comparison 3 Higher PUFA vs lower PUFA ‐ continuous secondary outcomes, Outcome 47 TG, mmoL/L ‐ subgroup by replacement.
Analysis 3.48
Analysis 3.48
Comparison 3 Higher PUFA vs lower PUFA ‐ continuous secondary outcomes, Outcome 48 TG, mmoL/L ‐ subgroup by sex.
Analysis 3.49
Analysis 3.49
Comparison 3 Higher PUFA vs lower PUFA ‐ continuous secondary outcomes, Outcome 49 TG, mmoL/L ‐ subgroup by age.
Analysis 3.50
Analysis 3.50
Comparison 3 Higher PUFA vs lower PUFA ‐ continuous secondary outcomes, Outcome 50 TG, mmoL/L ‐ subgroup by statin use.
Analysis 3.51
Analysis 3.51
Comparison 3 Higher PUFA vs lower PUFA ‐ continuous secondary outcomes, Outcome 51 TG, mmoL/L ‐ subgroup by intervention type.
Analysis 3.52
Analysis 3.52
Comparison 3 Higher PUFA vs lower PUFA ‐ continuous secondary outcomes, Outcome 52 Serum HIGH DENSITY LIPOPROTEIN (HDL, mmoL/L).
Analysis 3.53
Analysis 3.53
Comparison 3 Higher PUFA vs lower PUFA ‐ continuous secondary outcomes, Outcome 53 HDL, mmoL/L ‐ SA.
Analysis 3.54
Analysis 3.54
Comparison 3 Higher PUFA vs lower PUFA ‐ continuous secondary outcomes, Outcome 54 HDL, mmoL/L ‐ SA fixed‐effect.
Analysis 3.55
Analysis 3.55
Comparison 3 Higher PUFA vs lower PUFA ‐ continuous secondary outcomes, Outcome 55 HDL, mmoL/L ‐ subgroup by PUFA dose.
Analysis 3.56
Analysis 3.56
Comparison 3 Higher PUFA vs lower PUFA ‐ continuous secondary outcomes, Outcome 56 HDL, mmoL/L ‐ subgroup by duration.
Analysis 3.57
Analysis 3.57
Comparison 3 Higher PUFA vs lower PUFA ‐ continuous secondary outcomes, Outcome 57 HDL, mmoL/L ‐ subgroup by primary or secondary prevention.
Analysis 3.58
Analysis 3.58
Comparison 3 Higher PUFA vs lower PUFA ‐ continuous secondary outcomes, Outcome 58 HDL, mmoL/L ‐ subgroup by baseline PUFA dose.
Analysis 3.59
Analysis 3.59
Comparison 3 Higher PUFA vs lower PUFA ‐ continuous secondary outcomes, Outcome 59 HDL, mmoL/L ‐ subgroup by replacement.
Analysis 3.60
Analysis 3.60
Comparison 3 Higher PUFA vs lower PUFA ‐ continuous secondary outcomes, Outcome 60 HDL, mmoL/L ‐ subgroup by sex.
Analysis 3.61
Analysis 3.61
Comparison 3 Higher PUFA vs lower PUFA ‐ continuous secondary outcomes, Outcome 61 HDL, mmoL/L ‐ subgroup by age.
Analysis 3.62
Analysis 3.62
Comparison 3 Higher PUFA vs lower PUFA ‐ continuous secondary outcomes, Outcome 62 HDL, mmoL/L ‐ subgroup by statin use.
Analysis 3.63
Analysis 3.63
Comparison 3 Higher PUFA vs lower PUFA ‐ continuous secondary outcomes, Outcome 63 HDL, mmoL/L ‐ subgroup by intervention type.
Analysis 3.64
Analysis 3.64
Comparison 3 Higher PUFA vs lower PUFA ‐ continuous secondary outcomes, Outcome 64 Serum LOW DENSITY LIPOPROTEIN (LDL, mmoL/L).
Analysis 3.65
Analysis 3.65
Comparison 3 Higher PUFA vs lower PUFA ‐ continuous secondary outcomes, Outcome 65 LDL, mmoL/L ‐ SA.
Analysis 3.66
Analysis 3.66
Comparison 3 Higher PUFA vs lower PUFA ‐ continuous secondary outcomes, Outcome 66 LDL, mmoL/L ‐ SA fixed‐effect.
Analysis 3.67
Analysis 3.67
Comparison 3 Higher PUFA vs lower PUFA ‐ continuous secondary outcomes, Outcome 67 LDL, mmoL/L ‐ subgroup by PUFA dose.
Analysis 3.68
Analysis 3.68
Comparison 3 Higher PUFA vs lower PUFA ‐ continuous secondary outcomes, Outcome 68 LDL, mmoL/L ‐ subgroup by duration.
Analysis 3.69
Analysis 3.69
Comparison 3 Higher PUFA vs lower PUFA ‐ continuous secondary outcomes, Outcome 69 LDL, mmoL/L ‐ subgroup by primary or secondary prevention.
Analysis 3.70
Analysis 3.70
Comparison 3 Higher PUFA vs lower PUFA ‐ continuous secondary outcomes, Outcome 70 LDL, mmoL/L ‐ subgroup by baseline PUFA dose.
Analysis 3.71
Analysis 3.71
Comparison 3 Higher PUFA vs lower PUFA ‐ continuous secondary outcomes, Outcome 71 LDL, mmoL/L ‐ subgroup by replacement.
Analysis 3.72
Analysis 3.72
Comparison 3 Higher PUFA vs lower PUFA ‐ continuous secondary outcomes, Outcome 72 LDL, mmoL/L ‐ subgroup by sex.
Analysis 3.73
Analysis 3.73
Comparison 3 Higher PUFA vs lower PUFA ‐ continuous secondary outcomes, Outcome 73 LDL, mmoL/L ‐ subgroup by age.
Analysis 3.74
Analysis 3.74
Comparison 3 Higher PUFA vs lower PUFA ‐ continuous secondary outcomes, Outcome 74 LDL, mmoL/L ‐ subgroup by statin use.
Analysis 3.75
Analysis 3.75
Comparison 3 Higher PUFA vs lower PUFA ‐ continuous secondary outcomes, Outcome 75 LDL, mmoL/L ‐ subgroup by intervention type.
Analysis 4.1
Analysis 4.1
Comparison 4 Higher PUFA vs lower PUFA intake ‐ tertiary outcomes, Outcome 1 SYSTOLIC BLOOD PRESSURE (sBP, mmHg).
Analysis 4.2
Analysis 4.2
Comparison 4 Higher PUFA vs lower PUFA intake ‐ tertiary outcomes, Outcome 2 DIASTOLIC BLOOD PRESSURE (dBP, mmHg).
Analysis 4.3
Analysis 4.3
Comparison 4 Higher PUFA vs lower PUFA intake ‐ tertiary outcomes, Outcome 3 SERIOUS ADVERSE EVENTS (SAEs).
Analysis 4.4
Analysis 4.4
Comparison 4 Higher PUFA vs lower PUFA intake ‐ tertiary outcomes, Outcome 4 DROPOUTS.

References

References to studies included in this review

    1. Ahn J, Park SK, Park TS, Kim JH, Yun E, Kim SP, et al. Effect of n‐3 polyunsaturated fatty acids on regression of coronary atherosclerosis in statin treated patients undergoing percutaneous coronary intervention. Korean Circulation Journal 2016;46(4):481‐9. [PUBMED: 27482256] - PMC - PubMed
    1. Brouwer IA, Geleijnse JM, Klaasen VM, Smit LA, Giltay EJ, Goede J, et al. Effect of alpha linolenic acid supplementation on serum prostate specific antigen (PSA): results from the Alpha Omega Trial. PloS One 2013;8(12):e81519. - PMC - PubMed
    2. Eussen SR, Geleijnse JM, Giltay EJ, Rompelberg CJ, Klungel OH, Kromhout D. Effects of n‐3 fatty acids on major cardiovascular events in statin users and non‐users with a history of myocardial infarction. European Heart Journal 2012;33(13):1582‐8. - PMC - PubMed
    3. Geleijnse J, Giltay E, Kromhout D. Effects of n‐3 fatty acids on cognitive decline: a randomized double‐blind, placebo‐controlled trial in stable myocardial infarction patients. Alzheimer's & Dementia 2011;1:S512. - PubMed
    4. Geleijnse JM, Giltay EJ, Kromhout D. Effects of n‐3 fatty acids on cognitive decline: a randomized, double‐blind, placebo‐controlled trial in stable myocardial infarction patients. Alzheimer's & Dementia 2012;8(4):278‐87. - PubMed
    5. Geleijnse JM, Giltay EJ, Schouten EG, Goede J, Oude Griep LM, Teitsma‐Jansen AM, et al. Effect of low doses of n‐3 fatty acids on cardiovascular diseases in 4,837 post‐myocardial infarction patients: design and baseline characteristics of the Alpha Omega Trial. American Heart Journal 2010;159(4):539‐46. [DOI: 10/1016/j.ahj.2009.12.033] - PubMed
    6. Giltay EJ, Geleijnse JM, Heijboer AC, Goede J, Oude Griep LM, Blankenstein MA, et al. No effects of n‐3 fatty acid supplementation on serum total testosterone levels in older men: the Alpha Omega Trial. International Journal of Andrology 2012;35(5):680‐7. - PMC - PubMed
    7. Giltay EJ, Geleijnse JM, Kromhout D. Effects of n‐3 fatty acids on depressive symptoms and dispositional optimism after myocardial infarction. American Journal of Clinical Nutrition 2011;94(6):1442‐50. - PMC - PubMed
    8. Hoogeveen E, Gemen E, Geleijnse M, Kusters R, Kromhout D, Giltay E. Effects of n‐3 fatty acids on decline of kidney function after myocardial infarction: Alpha Omega Trial. Nephrology, Dialysis, Transplantation 2012;27:ii64.
    9. Hoogeveen EK, Geleijnse JM, Kromhout D, Giltay EJ. No effect of n‐3 fatty acids on high‐sensitivity C‐reactive protein after myocardial infarction: the Alpha Omega Trial. European Journal of Preventive Cardiology 2014;21(11):1429‐36. - PubMed
    10. Hoogeveen EK, Geleijnse JM, Kromhout D, Stijnen T, Gemen EF, Kusters R, et al. Effect of omega‐3 fatty acids on kidney function after myocardial infarction: the Alpha Omega Trial. Clinical Journal of The American Society of Nephrology: CJASN 2014;9(10):1676‐83. - PMC - PubMed
    11. Kromhout D, Geleijnse JM, Goede J, Oude Griep LM, Mulder BJ, Boer MJ, et al. N‐3 fatty acids, ventricular arrhythmia‐related events, and fatal myocardial infarction in postmyocardial infarction patients with diabetes. Diabetes Care 2011;34(12):2515‐20. - PMC - PubMed
    12. Kromhout D, Giltay EJ, Geleijnse JM. N‐3 fatty acids and cardiovascular events after myocardial infarction. New England Journal of Medicine 2010;363(18):2015‐26. - PubMed
    13. NCT00127452. Alpha Omega Trial: study of omega‐3 fatty acids and coronary mortality. clinicaltrials.gov/ct2/show/NCT00127452 (first posted 5 August 2005).
    1. Bassey EJ, Littlewood JJ, Rothwell MC, Pye DW. Lack of effect of supplementation with essential fatty acids on bone mineral density in healthy pre‐ and postmenopausal women: two randomized controlled trials of Efacal v. calcium alone. British Journal of Nutrition 2000;83(6):629‐35. [PUBMED: 10911771] - PubMed
    1. Bassey EJ, Littlewood JJ, Rothwell MC, Pye DW. Lack of effect of supplementation with essential fatty acids on bone mineral density in healthy pre‐ and postmenopausal women: two randomized controlled trials of Efacal v. calcium alone. British Journal of Nutrition 2000;83(6):629‐35. [PUBMED: 10911771] - PubMed
    1. Bates D, Fawcett PR, Shaw DA, Weightman D. Trial of polyunsaturated fatty acids in non‐relapsing multiple sclerosis. British Medical Journal 1977;2(6092):932‐3. - PMC - PubMed
    2. Dworkin RH, Bates D, Millar JH, Paty DW. Linoleic acid and multiple sclerosis: a reanalysis of three double‐blind trials. Neurology 1984;34(11):1441‐5. - PubMed

References to studies excluded from this review

    1. Quinn JF, Raman R, Thomas RG, Yurko‐Mauro K, Nelson EB, Dyck C, et al. Docosahexaenoic acid supplementation and cognitive decline in Alzheimer disease: a randomized trial. JAMA 2010;304(17):1903‐11. - PMC - PubMed
    1. Nigam A, Talajic M, Roy D, Nattel S, Lambert J, Nozza A, et al. Fish oil for the reduction of atrial fibrillation recurrence, inflammation, and oxidative stress. Journal of the American College of Cardiology 2014;64(14):1441‐8. - PubMed
    2. Nigam A, Talajic M, Roy D, Nattel S, Lambert J, Nozza A, et al. Multicentre trial of fish oil for the reduction of atrial fibrillation recurrence, inflammation and oxidative stress: the Atrial Fibrillation Fish Oil Research Study. Canadian Journal of Cardiology 2013;1:S383. - PubMed
    1. Brouwer IA, Geleijnse JM, Klaasen VM, Smit LA, Giltay EJ, Goede J, et al. Effect of alpha linolenic acid supplementation on serum prostate specific antigen (PSA): results from the alpha omega trial. PLoS One 2013;8(12):e81519. - PMC - PubMed
    2. Eussen SR, Geleijnse JM, Giltay EJ, Rompelberg CJ, Klungel OH, Kromhout D. Effects of n‐3 fatty acids on major cardiovascular events in statin users and non‐users with a history of myocardial infarction. European Heart Journal 2012;33(13):1582‐8. - PMC - PubMed
    3. Geleijnse J, Giltay E, Kromhout D. Effects of n‐3 fatty acids on cognitive decline: a randomized double‐blind, placebo‐controlled trial in stable myocardial infarction patients. Alzheimer's & Dementia 2011;1:S512. - PubMed
    4. Geleijnse JM, Giltay EJ, Kromhout D. Effects of n‐3 fatty acids on cognitive decline: a randomized, double‐blind, placebo‐controlled trial in stable myocardial infarction patients. Alzheimer's & Dementia 2012;8(4):278‐87. - PubMed
    5. Geleijnse JM, Giltay EJ, Schouten EG, Goede J, Oude Griep LM, Teitsma‐Jansen AM, et al. Effect of low doses of n‐3 fatty acids on cardiovascular diseases in 4,837 post‐myocardial infarction patients: design and baseline characteristics of the Alpha Omega Trial. American Heart Journal 2010;159(4):539‐46. [DOI: 10/1016/j.ahj.2009.12.033] - PubMed
    6. Giltay EJ, Geleijnse JM, Heijboer AC, Goede J, Oude Griep LM, Blankenstein MA, et al. No effects of n‐3 fatty acid supplementation on serum total testosterone levels in older men: the Alpha Omega Trial. International Journal of Andrology 2012;35(5):680‐7. - PMC - PubMed
    7. Giltay EJ, Geleijnse JM, Kromhout D. Effects of n‐3 fatty acids on depressive symptoms and dispositional optimism after myocardial infarction. American Journal of Clinical Nutrition 2011;94(6):1442‐50. - PMC - PubMed
    8. Hoogeveen E, Gemen E, Geleijnse M, Kusters R, Kromhout D, Giltay E. Effects of n‐3 fatty acids on decline of kidney function after myocardial infarction: Alpha Omega trial. Nephrology Dialysis Transplantation 2012;27:ii64. - PMC - PubMed
    9. Hoogeveen EK, Geleijnse JM, Kromhout D, Giltay EJ. No effect of n‐3 fatty acids on high‐sensitivity C‐reactive protein after myocardial infarction: the Alpha Omega trial. European Journal of Preventive Cardiology 2014;21(11):1429‐36. - PubMed
    10. Hoogeveen EK, Geleijnse JM, Kromhout D, Stijnen T, Gemen EF, Kusters R, et al. Effect of omega‐3 fatty acids on kidney function after myocardial infarction: the Alpha Omega trial. Clinical Journal of The American Society of Nephrology: CJASN 2014;9(10):1676‐83. - PMC - PubMed
    11. Kromhout D, Geleijnse JM, Goede J, Oude Griep LM, Mulder BJ, Boer MJ, et al. N‐3 fatty acids, ventricular arrhythmia‐related events, and fatal myocardial infarction in postmyocardial infarction patients with diabetes. Diabetes Care 2011;34(12):2515‐20. - PMC - PubMed
    12. Kromhout D, Giltay EJ, Geleijnse JM. N‐3 fatty acids and cardiovascular events after myocardial infarction. New England Journal of Medicine 2010;363(18):2015‐26. - PubMed
    1. Bonds DE, Harrington M, Worrall BB, Bertoni AG, Eaton CB, Hsia J, et al. Effect of long‐chain omega‐3 fatty acids and lutein + zeaxanthin supplements on cardiovascular outcomes: results of the Age‐Related Eye Disease Study 2 (AREDS2) randomized clinical trial. JAMA Internal Medicine 2014;174(5):763‐71. - PubMed
    2. Chew EY, Clemons T, SanGiovanni JP, Danis R, Domalpally A, McBee W, et al. The Age‐Related Eye Disease Study 2 (AREDS2): study design and baseline characteristics (AREDS2 report number 1). Ophthalmology 2012;119(11):2282‐9. - PMC - PubMed
    3. Chew EY, Clemons TE. In reply: making sense of the evidence from the age‐related eye disease study 2 randomized clinical trial. JAMA Ophthalmology 2014;132(8):1031‐2. - PubMed
    4. Chew EY, Clemons TE, Agron E, Launer LJ, Grodstein F, Bernstein PS, et al. Effect of omega‐3 fatty acids, lutein/zeaxanthin, or other nutrient supplementation on cognitive function: the AREDS2 randomized clinical trial. JAMA 2015;314(8):791‐801. - PMC - PubMed
    5. Chew EY, Clemons TE, SanGiovanni JP, Danis RP, Ferris FL III, Elman MJ, et al. Secondary analyses of the effects of lutein/zeaxanthin on age‐related macular degeneration progression: AREDS2 report No. 3. JAMA Ophthalmology 2014;132(2):142‐9. - PMC - PubMed
    6. Chew EY, SanGiovanni JP, Ferris FL, Wong WT, Agron E, Clemons TE, et al. Lutein/zeaxanthin for the treatment of age‐related cataract: AREDS2 randomized trial report no. 4. JAMA Ophthalmology 2013;131(7):843‐50. - PMC - PubMed
    7. Huynh N, Nicholson BP, Agron E, Clemons TE, Bressler SB, Rosenfeld PJ, et al. Visual acuity after cataract surgery in patients with age‐related macular degeneration: age‐related eye disease study 2 report number 5. Ophthalmology 2014;121(6):1229‐36. - PMC - PubMed
    1. Bowman L, Aung T, Haynes R, Armitage J. ASCEND: design and baseline characteristics of a large randomised trial in diabetes. Diabetes 2012;61:A556‐7.

References to ongoing studies

    1. ACTRN12614000732684. The Aboriginal cardiovascular omega‐3 randomised controlled trial [The effect of omega‐3 supplementation on adverse cardiovascular (CV) events among Indigenous Australians with stable coronary artery disease: a randomized controlled trial]. www.anzctr.org.au/Trial/Registration/TrialReview.aspx?id=366337 (date registered 10 July 2014).
    1. ACTRN12610000594022. Fish oil as adjunct therapy for periodontitis [Clinical efficacy of fish oil as adjunct therapy for patients with chronic periodontitis]. www.anzctr.org.au/Trial/Registration/TrialReview.aspx?id=335470 (date registered 23 July 2010).
    1. ACTRN12613000034730. Intervention of testosterone & fish oil as a possible strategy for the prevention of Alzheimer’s Disease [A 56 week, double‐blind, randomised, placebo‐controlled trial to determine the efficacy of testosterone, with and without DHA supplementation in PiB positive men with subjective memory complaints as a strategy to prevent the development of Alzheimer’s disease]. www.anzctr.org.au/Trial/Registration/TrialReview.aspx?id=363372 (date registered 14 January 2013).
    1. Holman RR, Paul S, Farmer A, Tucker L, Stratton IM, Neil HA, et al. Atorvastatin in factorial with omega‐3 EE90 risk reduction in diabetes (AFORRD): a randomised controlled trial. Diabetologia 2009;52(1):50‐9. - PubMed
    2. Neil HA, Ceglarek U, Thiery J, Paul S, Farmer A, Holman RR. Impact of atorvastatin and omega‐3 ethyl esters 90 on plasma plant sterol concentrations and cholesterol synthesis in type 2 diabetes: a randomised placebo controlled factorial trial. Atherosclerosis 2010;213(2):512‐7. - PubMed
    1. Cockayne NL, Duffy SL, Bonomally R, English A, Amminger PG, Mackinnon A, et al. The Beyond Ageing Project Phase 2‐‐a double‐blind, selective prevention, randomised, placebo‐controlled trial of omega‐3 fatty acids and sertraline in an older age cohort at risk for depression: study protocol for a randomized controlled trial. Trials 2015;16:247. - PMC - PubMed

Additional references

    1. 4S trial authors. Randomised trial of cholesterol lowering in 4444 patients with coronary heart disease: the Scandinavian Simvastatin Survival Study (4S). Lancet 1994;344(8934):1383‐9. - PubMed
    1. Abdelhamid A, Hooper L, Welch A. Polyunsaturated fatty acids for musculoskeletal health and functional status in older adults. PROSPERO2017; Vol. www.crd.york.ac.uk/prospero/display_record.php?RecordID=79211:CRD4201707....
    1. Abdelhamid AS, Brown TJ, Brainard JS, Biswas P, Thorpe GC, Moore HJ, et al. Omega‐3 fatty acids for the primary and secondary prevention of cardiovascular disease. Cochrane Database of Systematic Reviews 2018, Issue 6. [DOI: 10.1002/14651858.CD003177.pub3] - DOI - PMC - PubMed
    1. Berkley CS, Hoaglin DC, Mosteller F, Colditz GA. A random‐effects regression model for meta‐analysis. Statistics in Medicine 1995;14(4):395‐411. - PubMed
    1. Bhatnagar P, Wickramasinghe K, Wilkins E, Townsend N. Trends in the epidemiology of cardiovascular disease in the UK. Heart 2016;102:1945‐1952. [DOI: 10.1136/heartjnl-2016-309573] - DOI - PMC - PubMed

References to other published versions of this review

    1. Abdelhamid A, Martin N, Bridges C, Song F, Deane KHO, Hooper L. Polyunsaturated fat intake for prevention of cardiovascular disease. Cochrane Database of Systematic Reviews 2016, Issue 9. [DOI: 10.1002/14651858.CD012345] - DOI

Publication types

LinkOut - more resources