

Sirt1 protects from K-Ras-driven lung carcinogenesis
- PMID: 30021836
- PMCID: PMC6123659
- DOI: 10.15252/embr.201643879
Sirt1 protects from K-Ras-driven lung carcinogenesis
Abstract
The NAD+-dependent deacetylase SIRT1 can be oncogenic or tumor suppressive depending on the tissue. Little is known about the role of SIRT1 in non-small cell lung carcinoma (NSCLC), one of the deadliest cancers, that is frequently associated with mutated K-RAS Therefore, we investigated the effect of SIRT1 on K-RAS-driven lung carcinogenesis. We report that SIRT1 protein levels are downregulated by oncogenic K-RAS in a MEK and PI3K-dependent manner in mouse embryo fibroblasts (MEFs), and in human lung adenocarcinoma cell lines. Furthermore, Sirt1 overexpression in mice delays the appearance of K-RasG12V-driven lung adenocarcinomas, reducing the number and size of carcinomas at the time of death and extending survival. Consistently, lower levels of SIRT1 are associated with worse prognosis in human NSCLCs. Mechanistically, analysis of mouse Sirt1-Tg pneumocytes, isolated shortly after K-RasG12V activation, reveals that Sirt1 overexpression alters pathways involved in tumor development: proliferation, apoptosis, or extracellular matrix organization. Our work demonstrates a tumor suppressive role of SIRT1 in the development of K-RAS-driven lung adenocarcinomas in mice and humans, suggesting that the SIRT1-K-RAS axis could be a therapeutic target for NSCLCs.
Keywords: K‐RAS; SIRT1; non‐small cell lung carcinoma.
© 2018 The Authors.
Figures
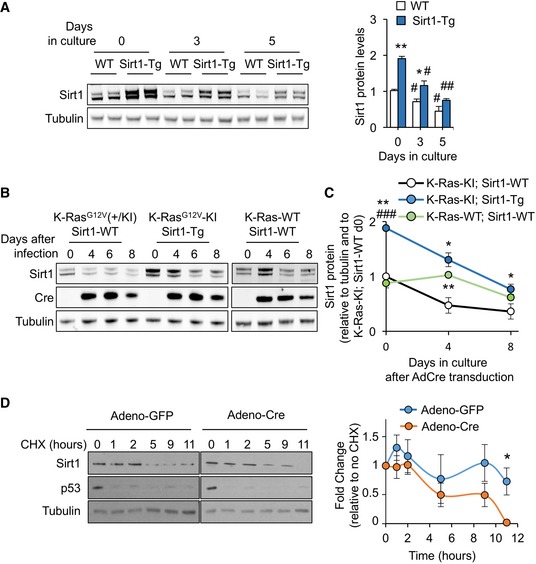
Western blot against the indicated proteins on samples from WT or Sirt1‐Tg MEFs at 0, 3, and 5 days of culture with 10% FBS. A quantification of the blots (n = 2) is presented in the right panel. Statistical significance of the comparisons between WT and Sirt1‐Tg are represented with *. Statistical significance of the comparisons between the same genotype at day 0 and subsequent days of culture are represented with #.
Western blot of the indicated proteins at the indicated times after adeno‐Cre infection.
Quantification of the protein levels of Sirt1 after adeno‐Cre infection. Dots represent the average of at least two independent blots. Statistical significance of the comparisons with K‐Ras‐KI; Sirt1‐WT is represented with *. Statistical significance of the comparisons with K‐Ras‐WT; Sirt1‐WT is represented with #.
K‐Ras‐KI MEFs infected with the indicated adenoviruses were treated with cycloheximide (CHX) for the indicated times, and the indicated proteins were detected by Western blot. Left panel shows a representative example of n = 5 (GFP) or n = 4 (Cre) different individual clones. Right panel shows the average quantification of Sirt1 protein levels in the four clones.

mRNA expression of Sirt1 from WT or Sirt1‐Tg MEFs cultured in 10% FBS for the indicated times. Bars represent the average of at least three independent clones.
Sirt1 protein expression in four different clones of immortalized MEFs, after culturing them during the indicated time. Quantification of the band intensity is shown in the right panel.
X‐Gal staining of MEFs of the indicated genotypes infected with adeno‐Cre (AdCre) at the indicated times after infection, to detect the LacZ reporter placed in the same polycistronic mRNA with the oncogene K‐RasG12V.
Growth curve with MEFs of the indicated genotypes after Adeno‐Cre infection.
mRNA expression of Sirt1 from three independent replicates of K‐Ras‐KI; Sirt1‐WT or K‐Ras‐KI; Sirt1‐Tg MEFs 4 days after infection with the indicated adenoviruses.
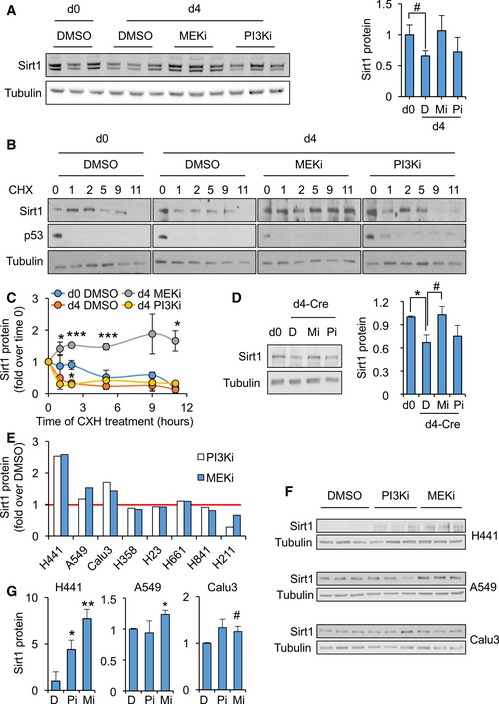
Left panel: Western blots of the indicated proteins in WT MEFs treated for 16 h with vehicle (DMSO) or the indicated inhibitors. Right panel: quantification of the indicated blots shown in left panel (n = 3).
Representative Western blots of the indicated proteins in WT MEFs at day 0 or day 4 of culture, treated with vehicle (DMSO) or the indicated inhibitors for 16 h and with cycloheximide for the indicated times.
Quantification of Sirt1 protein levels from n = 3 (DMSO d0, DMSO d4 and MEKi d4) or n = 2 (PI3Ki d4) independent replicates.
K‐Ras‐KI MEFs were infected with Adeno‐Cre and treated with MEK inhibitors (Mi) or with PI3K inhibitors (Pi) for 16 h, and the indicated proteins were detected by WB (left panels). Right panel shows a quantification of four independent replicates.
Levels of Sirt1 after treatment with the indicated inhibitors for 16 h, relative to the control treatment with DMSO, in the indicated cell lines.
Western blot of the indicated proteins from the cell lines where SIRT1 protein levels were shown to respond to MEK and/or PI3K inhibition in (E).
Quantification of the three replicates in the Western blots shown in (F).
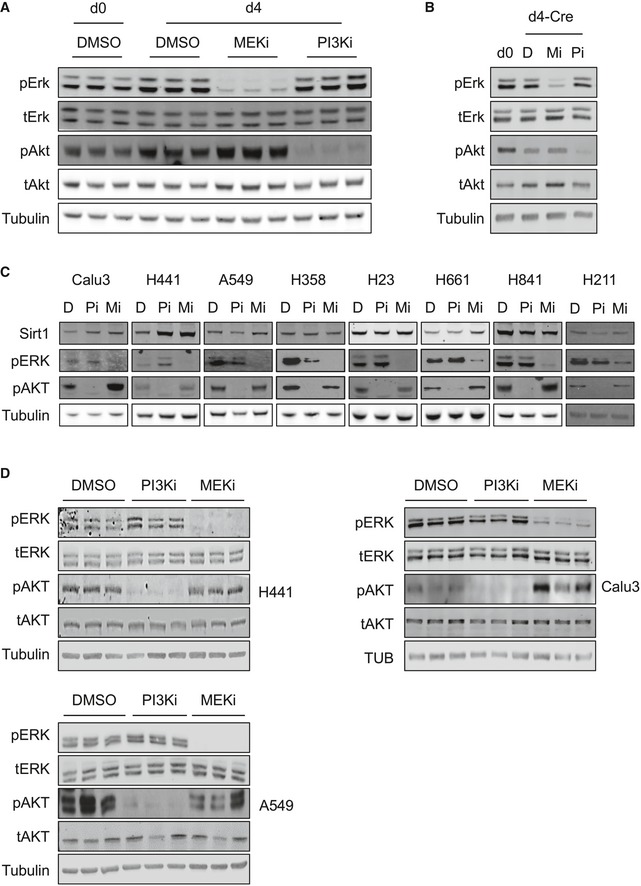
Western blots of the indicated proteins in WT MEFs treated for 16 h with vehicle (DMSO) or the indicated inhibitors.
K‐Ras‐KI MEFs were infected with Adeno‐Cre and treated with DMSO (D), MEK inhibitors (Mi) or PI3K inhibitors (Pi) for 16 h, and the indicated proteins were detected by WB.
Western bots of the indicated proteins from the indicated cell lines, treated with vehicle (DMSO, D), MEK inhibitor (Mi), or PI3K inhibitor (Pi) for 16 h.
Western blots of the indicated proteins from the cell lines where SIRT1 protein levels were shown to respond to MEK and/or PI3K inhibition in Fig 2E.
- A
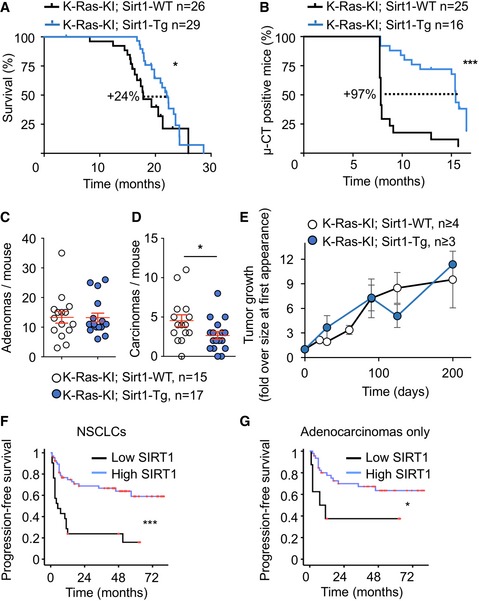
Kaplan–Meier survival curve of mice of the indicated genotypes injected with 4‐OH tamoxifen at 2‐3 months of age.
- B
Kaplan–Meier survival curve of mice from (A) censoring for tumor appearance by μCT scanner.
- C, D
Quantification of the number of adenomas (C) and carcinomas (D) per mouse at the time of death by histopathological analysis.
- E
Follow‐up of tumor sizes by periodical μCT scanner, starting from the time point when the tumor was first detected.
- F, G
(F) Kaplan–Meier curve indicating that lung tumors (including all tumors in the TMA, n = 105) displaying high expression of cytoplasmic SIRT1 (at least 20% of their neoplastic cells positive for SIRT1) show longer progression‐free survival time (***P < 0.0005). (G) Kaplan–Meier curve indicating that lung tumors (including only the adenocarcinomas from the TMA, n = 69) displaying high expression of cytoplasmic SIRT1 show longer progression‐free survival time (*P = 0.029).

Quantification of the maximum carcinoma diameter per mouse at the time of death by histopathological analysis. Red lines represent the means and the standard errors of the mean.
Kaplan–Meier curve with 105 human lung tumor patients indicating that high expression of cytoplasmic SIRT1 is associated with longer overall survival (**P = 0.003).
- A
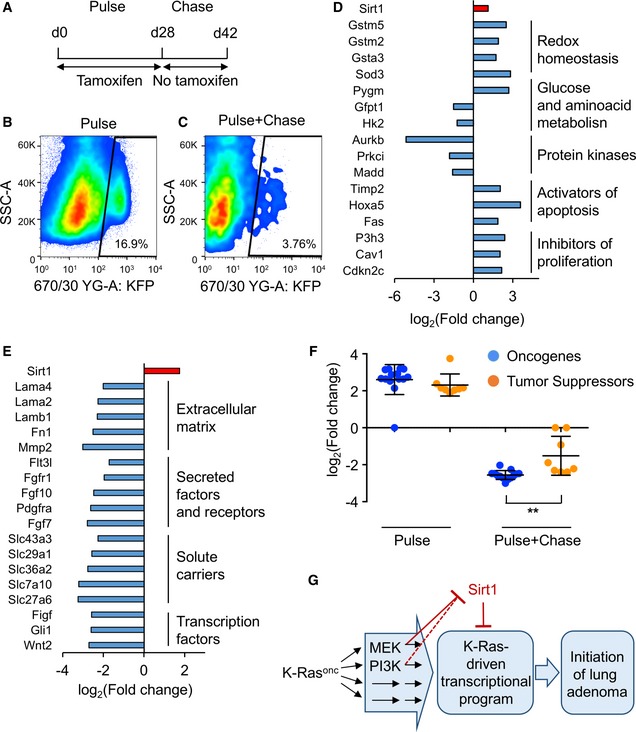
Treatment schedule for the isolation of K‐Ras‐KI‐activated pneumocytes. A first phase of 4 weeks of pulse (K‐Ras‐KI activation) by tamoxifen treatment was followed by a chase phase of 2 weeks without tamoxifen for the selection of the remaining K‐Ras‐KI‐activated pneumocytes.
- B, C
Representative cytometry heat maps detecting Katushka‐positive cells after only 4 weeks of 4‐OH tamoxifen activation (B), or 4 weeks of 4‐OH tamoxifen pulse + 2 weeks with no tamoxifen treatment chase (C).
- D, E
Lists of cancer‐related genes differentially expressed in Sirt1‐Tg pneumocytes compared with Sirt1‐WT pneumocytes in the pulse (D) or in the pulse + chase (E) experiments.
- F
Expression in the indicated experiments of the 13 oncogenes (blue dots) and eight tumor suppressors (orange dots) differentially expressed between WT and Sirt1‐Tg pneumocytes and identified by the KEGG platform as belonging to cancer‐related pathways (red bars in Fig EV4D and E). Middle bars indicate the averages, and error bars represent the standard deviations. Statistical significance between oncogenes and tumor suppressors in each experiment was assessed using the unpaired, two‐tailed Student's t‐test. **P < 0.01.
- G
Diagram depicting our findings on the functional interaction between oncogenic K‐Ras (K‐Rasonc) and Sirt1 in lung tumorigenesis.
- A
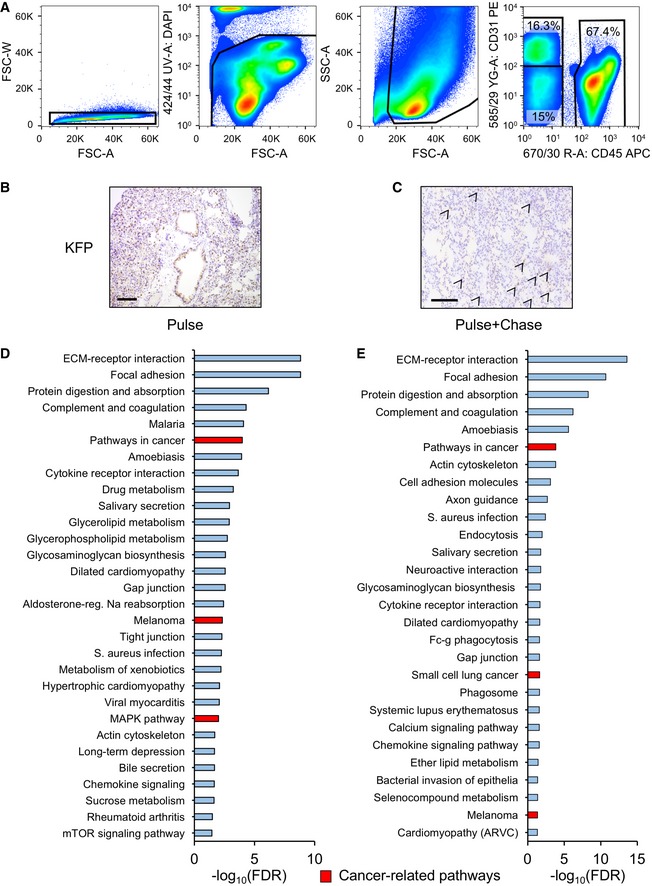
Strategy for pneumocyte isolation: dissociated lungs were analyzed by cytometry to discard aggregates (first panel); stained with DAPI to exclude dead cells (second panel); and further analyzed by size to discard debris (third panel). Finally, single, alive cells were analyzed for their expression of the lymphocytic marker CD45 or the endothelial marker CD31, and double negatives for CD31/CD45 were considered pneumocytes.
- B, C
Representative immunohistochemistry stainings detecting Katushka‐positive cells after only 4 weeks of 4‐OH tamoxifen activation (B) or 4 weeks of 4‐OH tamoxifen pulse + 2 weeks with no tamoxifen treatment chase (C). Size bars represent 200 μm. Arrows indicate Katushka‐positive cells.
- D, E
KEGG pathway clustering of differentially expressed genes between the K‐Ras‐KI; Sirt1‐WT and K‐Ras‐KI; Sirt1‐Tg pneumocytes isolated by FACS sorting in the pulse phase (D) or in the pulse + chase phase (E). Red columns represent cancer‐related pathways.
Similar articles
-
Metformin and tenovin-6 synergistically induces apoptosis through LKB1-independent SIRT1 down-regulation in non-small cell lung cancer cells.J Cell Mol Med. 2019 Apr;23(4):2872-2889. doi: 10.1111/jcmm.14194. Epub 2019 Feb 1. J Cell Mol Med. 2019. PMID: 30710424 Free PMC article.
-
JAK-STAT inhibition impairs K-RAS-driven lung adenocarcinoma progression.Int J Cancer. 2019 Dec 15;145(12):3376-3388. doi: 10.1002/ijc.32624. Epub 2019 Sep 10. Int J Cancer. 2019. PMID: 31407334 Free PMC article.
-
Oncogenic KRAS mutation confers chemoresistance by upregulating SIRT1 in non-small cell lung cancer.Exp Mol Med. 2023 Oct;55(10):2220-2237. doi: 10.1038/s12276-023-01091-0. Epub 2023 Oct 2. Exp Mol Med. 2023. PMID: 37779142 Free PMC article.
-
K-ras p21 expression and activity in lung and lung tumors.Exp Lung Res. 2000 Dec;26(8):659-71. doi: 10.1080/01902140150216747. Exp Lung Res. 2000. PMID: 11195463 Review.
-
The Key Role of Calmodulin in KRAS-Driven Adenocarcinomas.Mol Cancer Res. 2015 Sep;13(9):1265-73. doi: 10.1158/1541-7786.MCR-15-0165. Epub 2015 Jun 17. Mol Cancer Res. 2015. PMID: 26085527 Free PMC article. Review.
Cited by
-
The sirtuin family in cancer.Cell Cycle. 2019 Sep;18(18):2164-2196. doi: 10.1080/15384101.2019.1634953. Epub 2019 Jul 25. Cell Cycle. 2019. PMID: 31251117 Free PMC article.
-
SLC29A1 and SLC29A2 are human nicotinamide cell membrane transporters.Nat Commun. 2025 Jan 30;16(1):1181. doi: 10.1038/s41467-025-56402-y. Nat Commun. 2025. PMID: 39885119 Free PMC article.
-
Senotherapy for chronic lung disease.Pharmacol Rev. 2025 Jul;77(4):100069. doi: 10.1016/j.pharmr.2025.100069. Epub 2025 May 28. Pharmacol Rev. 2025. PMID: 40554265 Free PMC article. Review.
-
Subcellular compartmentalization of NAD+ and its role in cancer: A sereNADe of metabolic melodies.Pharmacol Ther. 2019 Aug;200:27-41. doi: 10.1016/j.pharmthera.2019.04.002. Epub 2019 Apr 8. Pharmacol Ther. 2019. PMID: 30974124 Free PMC article. Review.
-
Emerging role of sirtuins in non‑small cell lung cancer (Review).Oncol Rep. 2024 Oct;52(4):127. doi: 10.3892/or.2024.8786. Epub 2024 Aug 2. Oncol Rep. 2024. PMID: 39092574 Free PMC article. Review.
References
-
- Ferlay J, Soerjomataram I, Dikshit R, Eser S, Mathers C, Rebelo M, Parkin DM, Forman D, Bray F (2015) Cancer incidence and mortality worldwide: sources, methods and major patterns in GLOBOCAN 2012. Int J Cancer 136: E359–E386 - PubMed
-
- Linardou H, Dahabreh IJ, Kanaloupiti D, Siannis F, Bafaloukos D, Kosmidis P, Papadimitriou CA, Murray S (2008) Assessment of somatic k‐RAS mutations as a mechanism associated with resistance to EGFR‐targeted agents: a systematic review and meta‐analysis of studies in advanced non‐small‐cell lung cancer and metastatic colorectal cancer. Lancet Oncol 9: 962–972 - PubMed
Publication types
MeSH terms
Substances
Grants and funding
LinkOut - more resources
Full Text Sources
Other Literature Sources
Medical
Molecular Biology Databases
Miscellaneous
