. 2018 Oct;17(10):2018-2033.
doi: 10.1074/mcp.RA118.000924. Epub 2018 Jul 18.

Histone Interaction Landscapes Visualized by Crosslinking Mass Spectrometry in Intact Cell Nuclei

Affiliations

Histone Interaction Landscapes Visualized by Crosslinking Mass Spectrometry in Intact Cell Nuclei

Domenico Fasci et al. Mol Cell Proteomics. 2018 Oct.

Abstract

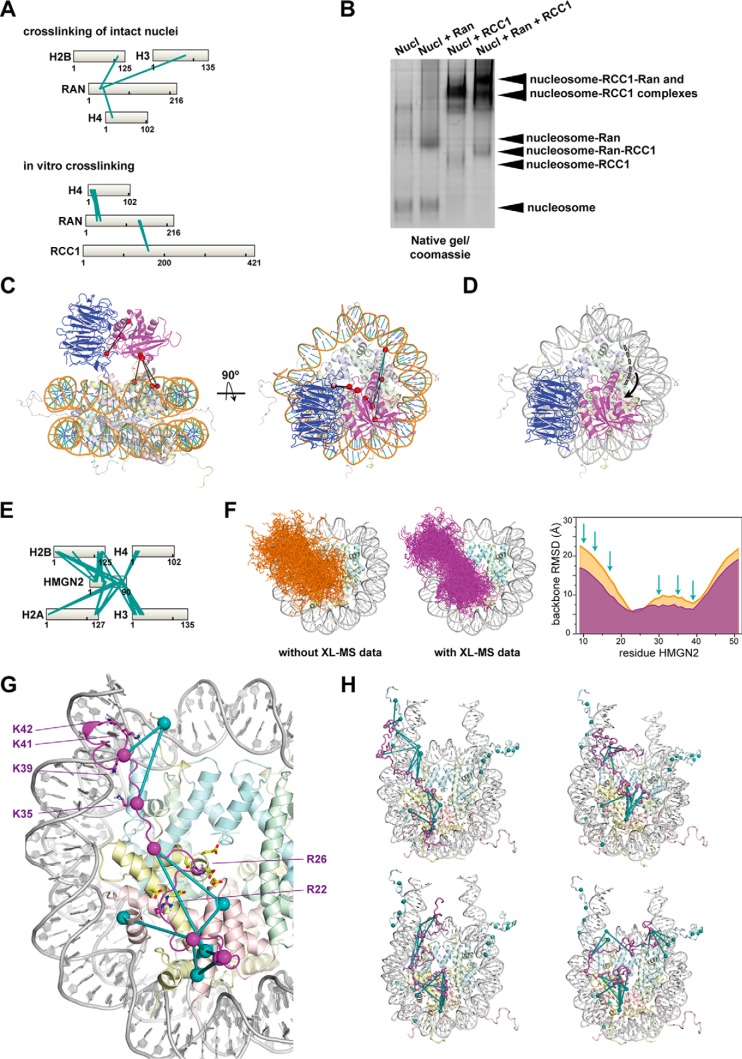
Cells organize their actions partly through tightly controlled protein-protein interactions-collectively termed the interactome. Here we use crosslinking mass spectrometry (XL-MS) to chart the protein-protein interactions in intact human nuclei. Overall, we identified ∼8,700 crosslinks, of which 2/3 represent links connecting distinct proteins. From these data, we gain insights on interactions involving histone proteins. We observed that core histones on the nucleosomes expose well-defined interaction hot spots. For several nucleosome-interacting proteins, such as USF3 and Ran GTPase, the data allowed us to build low-resolution models of their binding mode to the nucleosome. For HMGN2, the data guided the construction of a refined model of the interaction with the nucleosome, based on complementary NMR, XL-MS, and modeling. Excitingly, the analysis of crosslinks carrying posttranslational modifications allowed us to extract how specific modifications influence nucleosome interactions. Overall, our data depository will support future structural and functional analysis of cell nuclei, including the nucleoprotein assemblies they harbor.

Keywords: Chromatin function or biology; Histone interaction network – PTM interplay; Histone variant specific interactions; Histones; Mass Spectrometry; Nuclear interactome; Protein Cross-linking; Protein-Protein Interactions.


Conflict of interest statement

Conflict of interest: The authors declare that they have no conflict of interest.

Figures

Fig. 1.
Fig. 1.
Crosslinking mass spectrometry (XL-MS) based strategy to investigate assemblies and interactions of nuclear proteins. (A) The MS-cleavable crosslinker DSSO diffuses inside the cell nucleus, possibly through the nuclear pore complex, facilitating efficient crosslinking of the nuclear proteins. (B) U2OS nuclei were isolated and crosslinked. After detergent fractionation, the proteome is digested and the crosslinked peptides are enriched by using strong cation exchange chromatography. The crosslinked peptides are analyzed by LC MS/MS, and by making use of the cleavable crosslinker efficiently identified using the XlinkX PD nodes. (C) Pie chart indicating the total number of unique crosslinks at an FDR of 1%. Unique intralinks are unique crosslinks between peptides derived from the same protein/gene. Unique interlinks connect peptides from distinguishable proteins/genes. The bar charts indicate the nuclear crosslinks identified in the TX100 insoluble and soluble fraction. (D) The top panel displays a Venn diagram indicating the overlap between unique crosslinks identified in the independent biological replicates of the fractionated and unfractionated nuclei samples. The bar chart below indicates the PPIs reproducibly identified in both these XL-MS datasets. In dark brown are indicated the PPIs annotated in the IntAct (47) and/or in the CORUM (48) databases.
Fig. 2.
Fig. 2.
Validation of the identified crosslinks onto available high-resolution structures. Crosslinks satisfying the DSSO distance constraint (28 Å) were indicated in red (interlinks) and blue (intralinks), while crosslinks exceeding the maximum DSSO-imposed distance constraints are in cyan. (A) Crosslinks mapped onto the cryo-EM structure of the structurally homologue yeast pre-60S ribosome (PDB: 3JCT). In yellow are indicated the ribosomal proteins and light blue the ribosome maturation factors. (B) Cα-Cα distance distribution for the crosslinks mapped onto the pre-60S complex. A total of 97% crosslinks fall within the set constraint. (C) Crosslinks mapped on the X-ray structure of the homologue chicken histone octamer (PDB: 1EQZ). Histone H2A is indicated in yellow, H2B in pink, H3 in light blue, and H4 in green. The histone tails are indicated in purple. (D) Cα- Cα distance distribution for the crosslinks mapping on the nucleosome. The crosslinks violating the DSSO distance constraint map to the histone tails regions and can also be explained by higher order structures.
Fig. 3.
Fig. 3.
Defining interaction hot spots on the nucleosome. (A) Heat maps indicating the residues in each core histone engaged in interlinks with proteins other than the core histones. The red heat maps displays the frequency of interlinks normalized for the number of lysines present in the corresponding histone protein occurring between the specified lysine and proteins other than the core histones, including histone H1. The blue heat maps are generated calculating the median crosslink precursor intensity for the interlinks occurring between the specified lysine and proteins other than the core histones, including histone H1. The tails are indicated in red, and the α-helices indicated by the blue rods. (B) X-ray structure of the nucleosome (PDB: 1EQZ) highlighting the crosslinking hot spots. The red dots indicate the position of lysines engaged in a high number of interlinks. The purple dots indicate the position of lysines engaged in interlinks with high intensity. Histone H2A is indicated in yellow, H2B in pink, H3 in light blue, and H4 in green. (C) X-ray structure of the nucleosome (PDB: 1EQZ) indicating the region of the nucleosome involved in the establishment of interactions with protein partners. In yellow is highlighted the position of the nucleosome acidic patch, in light blue the region around the dyad, and in light green the lateral surface close to the H4 N-terminal tail. (D) Overlay of the model of the dimeric bHLH domain of USF3 (yellow), with the X-ray structure of the bHLH domain of USF1 (light blue) (PDB: 1AN4). (E) Crosslinking map defining the interaction between USF3 (amino acids 1–700) and the nucleosome. The blue box indicates the bHLH domain. (F) Visualization of the accessible interaction space of the bHLH domain of USF3, with the nucleosome (PDB: 1EQZ). The interaction space is defined by five interprotein crosslinks mapping between the structured regions of the nucleosome and the bHLH domain of USF3.
Fig. 4.
Fig. 4.
Characterization of PTM-regulated protein-protein interactions. (A) Overview of the proteins found crosslinked to histone H3 carrying acetylation at Lys23. (B) Crosslinking maps of hn-RNPK representing the interactions identified with and without ubiquitylation of Lys168. The interlinks (in red), the intralink (in blue), and the ubiquitylation site (in orange) are indicated. (C) Western blotting of the TX100 nuclear soluble or insoluble (chromatin) fraction obtained from nuclei purified in the presence of the cysteine alkylator iodoacetamide. The arrow indicates modified hn-RNPK. (D) Western blotting of the chromatin fraction obtained from U2OS nuclei purified with or without the cysteine alkylator iodoacetamide. The arrow indicates the band corresponding to modified hn-RNPK. (E) The left panel displays the model of the KH2 domain of hn-RNPK generated with I-Tasser indicating the ubiquitylated Lys168 (orange). The right panel displays the accessible interaction space of the KH2 domain of hn-RNPK with the nucleosome (PDB: 1EQZ) generated with the DisVis tool.
Fig. 5.
Fig. 5.
Defining structural models of nucleosome-interacting proteins using XL-MS complemented by other structural biology data and modeling. Binding mode of Ran and HMGN2 to the nucleosome. (A) Crosslinking maps of the identified unique interlinks between Ran and the core histone proteins from intact nuclei (top) and in vitro (bottom) crosslinking experiments. (B) Native electrophoresis analysis of mono-nucleosomes incubated with or without 4 molar excess of recombinant Ran E70A GDP and RCC1. The bands indicated by the arrow were excised and analyzed through bottom-up MS. (C) Crosslinks form panel A mapped onto the model of the Ran-RCC1-nucleosome complex. The model was generated superimposing the structure of the nucleosome (PDB: 1EQZ) and the structure of the Ran-RCC1 complex (PDB: 3GJ0 overlaid over PDB: 1I2M) onto the structure of the RCC1-nucleosome complex (PDB: 3MVD). In cyan are indicated the interlinks that map on the histone H4 N-terminal tail. RCC1 is in blue, and Ran is in magenta. (D) Model of the Ran-RCC1-nucleosome complex. The dotted green line indicates the histone H4 N-terminal tail. RCC1 is in blue, and Ran is in magenta. (E) Crosslinking map of the identified unique interlinks between HMGN2 and the core histone proteins from crosslinking of intact nuclei. (F) Ensembles of 200 models of the extended NBD of HMGN2 bound to the nucleosome without (left) and with (right) XL-MS obtained crosslinks imposed during docking. The heavy atom backbone RMSD over the ensemble of 200 solutions for each HMGN2 residue is plotted on the right. Position of crosslinked lysines indicated by the arrows. (G) Detailed view on the extended NBD on the nucleosome surface, taken from a structure close to the ensemble average. Important side chains for the acidic patch or DNA interaction are shown in sticks, spheres indicate the Cα positions of crosslinked lysines, crosslinks are indicated as teal lines. (H) Four models of the full-length HMGN2 bound to the nucleosome. Crosslinks with violations < 3 Å are indicated as in panel G. Crosslinks from HMGN2 K81 either place the this region close to H3 tail (top left), the proximal linker DNA (top right), the dyad (bottom left), or the distal linker DNA (bottom right).
Fig. 6.
Fig. 6.
Snapshot of the histone interaction network. (A) Interaction network of the proteins found crosslinked to the nucleosome and histone H1 variants. Different color of each edge connecting the nucleosome hub indicates which histone variant is found crosslinked to each protein: H2B (blue), H3 (orange), H2A (purple), H4, (green), more than one histone (red). (B) Bar chart representing the functional analysis of the proteins from panel A crosslinked to the core histones and to histone H1 variants. (C) Venn diagram displaying the limited overlap between histone H2B interactors (other than core histone proteins) identified through XL-MS with the interactors reported in studies applying AP-MS (76) and BioID (77). Clearly all three methods show very limited overlap, whereby the BioID and AP-MS studies were even done on the same cells and by the same group.

References

    1. Alberts B. (1998) The cell as a collection of protein machines: Preparing the next generation of molecular biologists. Cell 92, 291–294 - PubMed
    1. Robinson C. V., Sali A., and Baumeister W. (2007) The molecular sociology of the cell. Nature 450, 973–982 - PubMed
    1. Gavin A. C., Aloy P., Grandi P., Krause R., Boesche M., Marzioch M., Rau C., Jensen L. J., Bastuck S., Dümpelfeld B., Edelmann A., Heurtier M. A., Hoffman V., Hoefert C., Klein K., Hudak M., Michon A. M., Schelder M., Schirle M., Remor M., Rudi T., Hooper S., Bauer A., Bouwmeester T., Casari G., Drewes G., Neubauer G., Rick J. M., Kuster B., Bork P., Russell R. B., and Superti-Furga G. (2006) Proteome survey reveals modularity of the yeast cell machinery. Nature 440, 631–636 - PubMed
    1. Huttlin E. L., Ting L., Bruckner R. J., Gebreab F., Gygi M. P., Szpyt J., Tam S., Zarraga G., Colby G., Baltier K., Dong R., Guarani V., Vaites L. P., Ordureau A., Rad R., Erickson B. K., Wühr M., Chick J., Zhai B., Kolippakkam D., Mintseris J., Obar R. A., Harris T., Artavanis-Tsakonas S., Sowa M. E., De Camilli P., Paulo J. A., Harper J. W., and Gygi S. P. (2015) The BioPlex Network: A systematic exploration of the human interactome. Cell 162, 425–440 - PMC - PubMed
    1. Hein M. Y., Hubner N. C., Poser I., Cox J., Nagaraj N., Toyoda Y., Gak I. A., Weisswange I., Mansfeld J., Buchholz F., Hyman A. A., and Mann M. (2015) A human interactome in three quantitative dimensions organized by stoichiometries and abundances. Cell 163, 712–723 - PubMed

Publication types