. 2018 Jul 18;9(1):2807.
doi: 10.1038/s41467-018-04920-3.

Task-induced brain state manipulation improves prediction of individual traits

Affiliations

Task-induced brain state manipulation improves prediction of individual traits

Abigail S Greene et al. Nat Commun. .

Abstract

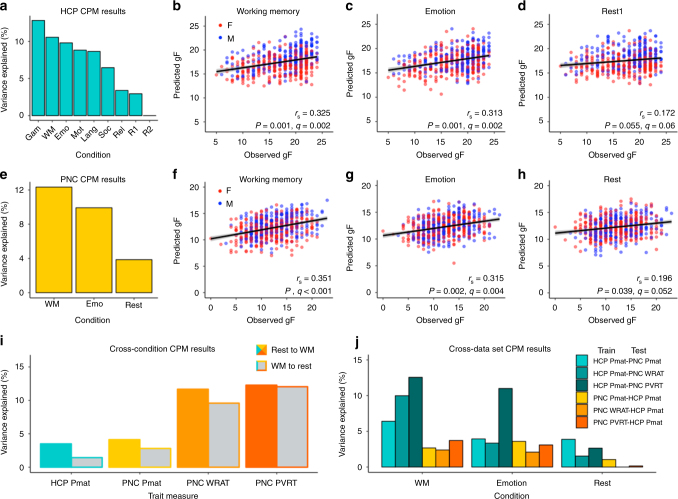
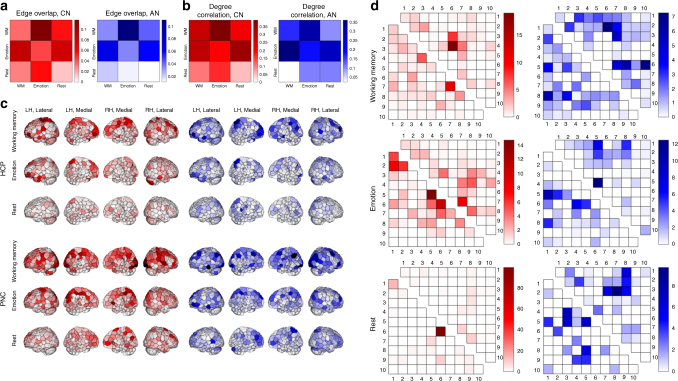
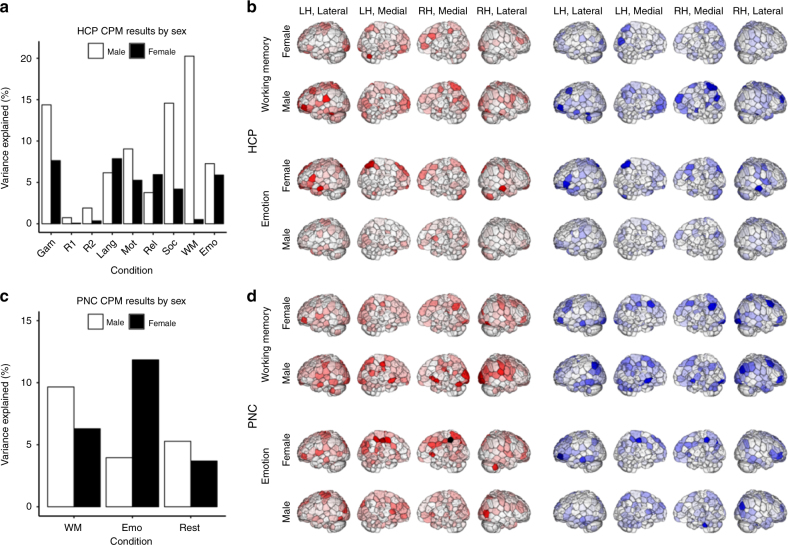
Recent work has begun to relate individual differences in brain functional organization to human behaviors and cognition, but the best brain state to reveal such relationships remains an open question. In two large, independent data sets, we here show that cognitive tasks amplify trait-relevant individual differences in patterns of functional connectivity, such that predictive models built from task fMRI data outperform models built from resting-state fMRI data. Further, certain tasks consistently yield better predictions of fluid intelligence than others, and the task that generates the best-performing models varies by sex. By considering task-induced brain state and sex, the best-performing model explains over 20% of the variance in fluid intelligence scores, as compared to <6% of variance explained by rest-based models. This suggests that identifying and inducing the right brain state in a given group can better reveal brain-behavior relationships, motivating a paradigm shift from rest- to task-based functional connectivity analyses.


Conflict of interest statement

The authors declare no competing interests.

Figures

Fig. 1
Fig. 1
Task-induced brain state is a key determinant of individual trait prediction accuracy. a Results from the cross-validated CPM pipeline in each of the 9 HCP conditions (n = 515) using an edge-selection threshold of P < 0.001, plotted as and ordered by percent of fluid intelligence (gF) variance explained. Gam, gambling task; WM, working memory task; Emo, emotion processing task; Mot, motor task; Lang, language task; Soc, social task; Rel, relational task; R1, rest1; R2, rest2. bd Expansion of results presented in a for the WM, emotion, and rest1 conditions; each point represents the relationship between predicted and observed gF for a single subject, colored by subject sex (F, female; M, male), plotted with the best-fit line and its 95% CI (gray area). rs, Spearman’s correlation coefficient; significance assessed via 1000 iterations of permutation testing. eh Results of CPM analyses in the PNC data set (n = 571), presented as in (ad). i Results of cross-condition prediction analyses; for each measure, networks built from rest data were applied to WM data (“Rest to WM”) and vice versa (“WM to rest”) to predict the corresponding measure, using an edge-selection threshold of P < 0.01. Pmat, matrix reasoning test of gF; WRAT, Wide Range Achievement Test; PVRT, Penn Verbal Reasoning Test. j Results of cross-data set validation analyses. Cool colors indicate HCP-based models; warm colors indicate PNC-based models; shade corresponds to predicted measure in the case of HCP to PNC, and to the measure used for model building in the case of PNC to HCP. In all cases, the same condition was used for model building and prediction, and an edge-selection threshold of P < 0.01 was used
Fig. 2
Fig. 2
Model connections are widely distributed throughout the brain and demonstrate substantial overlap between models. a Edge overlap (number of shared edges normalized by the total number of unique edges in the models) between each pair of models within (off-diagonal) and between (main diagonal) data sets. In these and all subsequent matrix visualizations, HCP data are presented in the bottom triangle and PNC data are presented in the upper triangle. CN, correlated network; AN, anti-correlated network. b Spearman’s correlation of node degree between each pair of models both within (off-diagonal) and between (main diagonal) data sets. c Visualization of node degree for each model in the HCP (top three rows) and PNC (bottom three rows) data. CN degree is displayed in warm colors; AN degree is displayed in cool colors; darker color indicates higher degree. LH, left hemisphere; RH, right hemisphere. d Canonical networks that contribute disproportionately (i.e., value > 1; see main text) to each model. As in a and b, HCP models are represented in the lower triangles and PNC models in the upper triangles. Each number corresponds to one canonical network (Methods): 1 = medial frontal, 2 = frontoparietal, 3 = default mode, 4 = motor cortex, 5 = visual A, 6 = visual B, 7 = visual association, 8 = salience, 9 = subcortical, 10 = cerebellum. Models in ac were generated with an edge-selection threshold of P < 0.01; models in d were generated with an edge-selection threshold of P < 0.001 for improved visualization and interpretability
Fig. 3
Fig. 3
Distinct networks, best perturbed by different tasks, underlie fluid intelligence in males and females. a Results from the CPM pipeline run separately for males (n = 241) and females (n = 274) on data from each of the 9 HCP conditions (edge-selection threshold of P < 0.01). Abbreviations as in Fig. 1. b Visualization of node degree for male and female HCP models. Abbreviations and conventions as in Fig. 2c. c Results from the CPM pipeline run separately for males (n = 251) and females (n = 320) on data from each of the 3 PNC conditions (edge-selection threshold of P < 0.01). Abbreviations as in Fig. 1. d Visualization of node degree for male and female PNC models. Abbreviations and conventions as in Fig. 2c

References

    1. Gabrieli JDE, Ghosh SS, Whitfield-Gabrieli S. Prediction as a humanitarian and pragmatic contribution from human cognitive neuroscience. Neuron. 2015;85:11–26. doi: 10.1016/j.neuron.2014.10.047. - DOI - PMC - PubMed
    1. Haynes JD, Rees G. Decoding mental states from brain activity in humans. Nat. Rev. Neurosci. 2006;7:523–534. doi: 10.1038/nrn1931. - DOI - PubMed
    1. Norman KA, Polyn SM, Detre GJ, Haxby JV. Beyond mind-reading: multi-voxel pattern analysis of fMRI data. Trends Cogn. Sci. 2006;10:424–430. doi: 10.1016/j.tics.2006.07.005. - DOI - PubMed
    1. Dubois J, Adolphs R. Building a science of individual differences from fMRI. Trends Cogn. Sci. 2016;20:425–443. doi: 10.1016/j.tics.2016.03.014. - DOI - PMC - PubMed
    1. Woo CW, Chang LJ, Lindquist MA, Wager TD. Building better biomarkers: brain models in translational neuroimaging. Nat. Neurosci. 2017;20:365–377. doi: 10.1038/nn.4478. - DOI - PMC - PubMed

Publication types