. 2018 Jul 18;9(1):2801.
doi: 10.1038/s41467-018-05078-8.

p38-mediated phosphorylation at T367 induces EZH2 cytoplasmic localization to promote breast cancer metastasis

Affiliations

p38-mediated phosphorylation at T367 induces EZH2 cytoplasmic localization to promote breast cancer metastasis

Talha Anwar et al. Nat Commun. .

Abstract

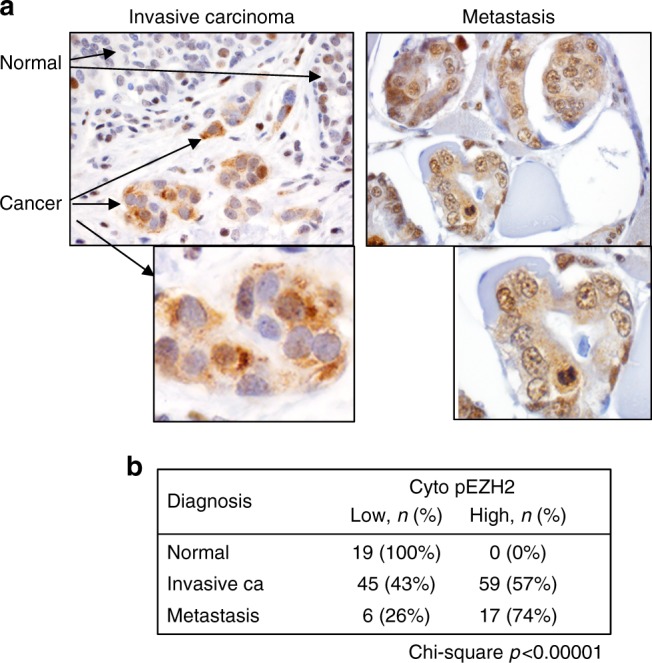
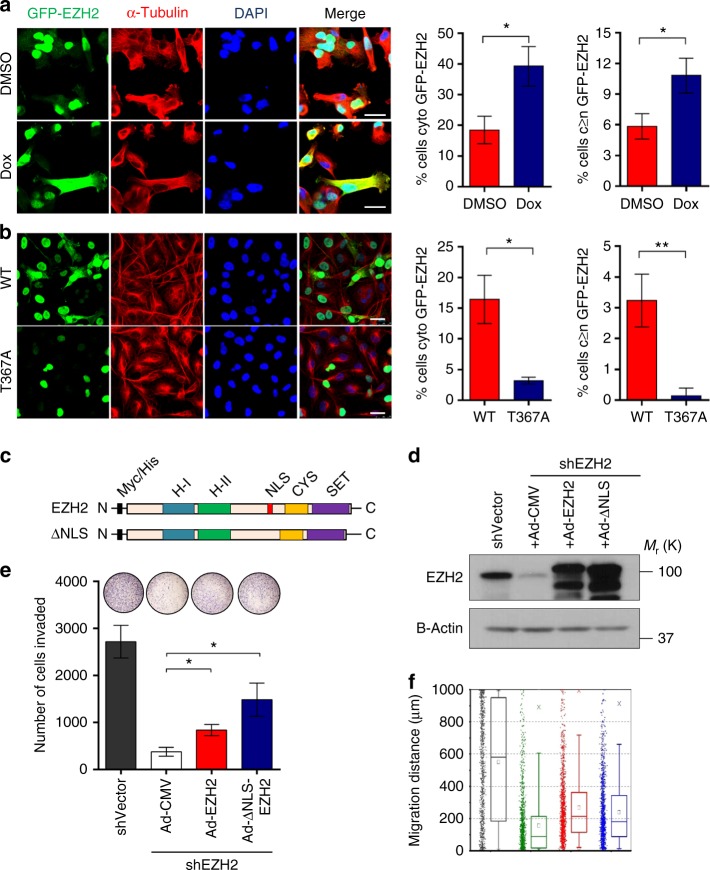
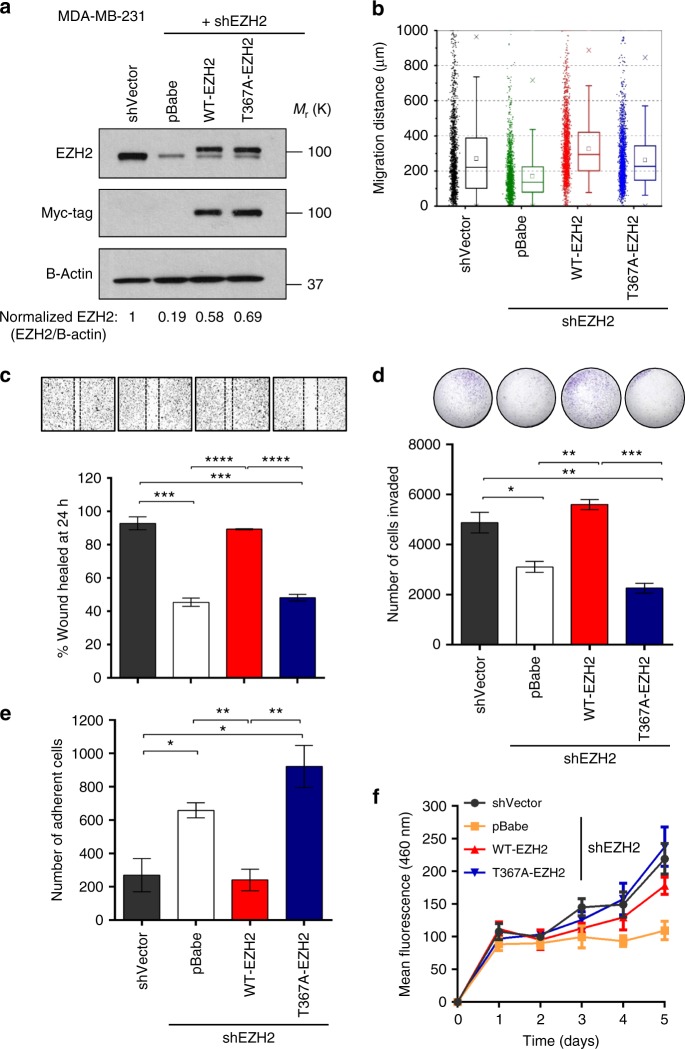
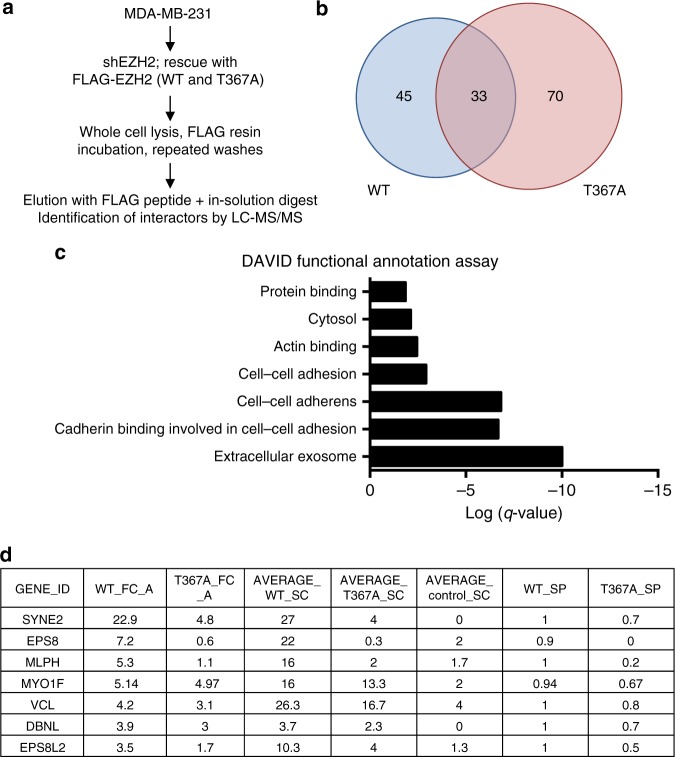
Overexpression of EZH2 in estrogen receptor negative (ER-) breast cancer promotes metastasis. EZH2 has been mainly studied as the catalytic component of the Polycomb Repressive Complex 2 (PRC2) that mediates gene repression by trimethylating histone H3 at lysine 27 (H3K27me3). However, how EZH2 drives metastasis despite the low H3K27me3 levels observed in ER- breast cancer is unknown. Here we show that in human invasive carcinomas and distant metastases, cytoplasmic EZH2 phosphorylated at T367 is significantly associated with ER- disease and low H3K27me3 levels. p38-mediated EZH2 phosphorylation at T367 promotes EZH2 cytoplasmic localization and potentiates EZH2 binding to vinculin and other cytoskeletal regulators of cell migration and invasion. Ectopic expression of a phospho-deficient T367A-EZH2 mutant is sufficient to inhibit EZH2 cytoplasmic expression, disrupt binding to cytoskeletal regulators, and reduce EZH2-mediated adhesion, migration, invasion, and development of spontaneous metastasis. These results point to a PRC2-independent non-canonical mechanism of EZH2 pro-metastatic function.


Conflict of interest statement

The authors declare no competing interests.

Figures

Fig. 1
Fig. 1
Phosphorylated EZH2 (T367) is expressed in the cytoplasm of invasive breast carcinoma and distant metastases. a Immunohistochemical analysis of pEZH2(T367) expression using a specific antibody in human tissue samples of 193 patients. Pictures show a representative invasive breast carcinoma with adjacent normal breast (left) and metastasis (right) (×400 magnification). Insets show expression of pEZH2(T367) in cancer cells (×600 magnification). b Results are tabulated. Cytoplasmic pEZH2 is significantly associated with invasive carcinoma and metastasis compared to normal and fibrocystic changes (Chi-square p < 0.00001)
Fig. 2
Fig. 2
p38 phosphorylates EZH2 in breast cancer. a Quantitative analysis of the direct interaction between recombinant EZH2 and p38α proteins using BioLayer Interferometry. EZH2 was immobilized on a sensor chip and a concentration series of p38α protein was added. Sensorgrams and corresponding fitting curves for kinetics constants and affinity determination (left) and corresponding plot of steady state response against concentration (right) for determination of binding affinity. b Western blot of MDA-MB-231 cells treated with 20 μM SB202190 for 48 hr (left panel) or with p38 shRNA (right panel) to pharmacologically and genetically inhibit p38 activity, respectively. c Western blot of MDA-MB-231 cells transduced with dox-inducible MKK6EE to activate p38α. d, e Immunohistochemical staining of 118 samples of human invasive breast carcinomas using anti-pEZH2(T367) and anti-H3K27me3 antibodies demonstrating a significant inverse association between these protein modifications (Chi-square, p < 0.00001) (×400 magnification)
Fig. 3
Fig. 3
p38-mediated phosphorylation at T367 promotes EZH2 cytoplasmic localization and is sufficient for migration and invasion of breast cancer cells. a Immunofluorescence images of MDA-MB-231 cells transduced with lentiviruses to express GFP-EZH2 and a dox-inducible, constitutively active MKK6 kinase (MKK6EE). The percentage of non-mitotic cells expressing cytoplasmic EZH2 and cytoplasmic GFP-EZH2≥nuclear expression was quantified for >50 cells from three fields. Scale bars: 25 μm. b Immunofluorescence images of MDA-MB-231 cells transduced with lentivirus to express GFP-EZH2 wild-type or T367A protein. The percentage of non-mitotic cells expressing cytoplasmic EZH2 was quantified for >50 cells from three fields. Statistical analyses were performed using student’s t-test. Scale bars: 25 μm. Data for a, b shown as mean±SD and are representative from an independent experiment that was repeated with three biological replicates, each with at least three technical replicates. Statistical analyses were performed using student’s t-test. c Schematic diagram of myc-tagged EZH2 and nuclear localization signal (NLS) mutant (top left). d Western blot analysis of MDA-MB-231 cells showing EZH2 knockdown after lentiviral transduction with control shRNA (shVector) or 3′ UTR EZH2-targeting shRNA (shEZH2) and rescue with myc-tagged Ad-EZH2 or Ad-ΔNLS mutant (top right). Ad-CMV, adenovirus control vector. e Cell invasion assay of cells in d using a reconstituted Boyden basement membrane invasion chamber assay. Data are from at least three independent experiments carried out in at least triplicate and are presented as mean±SD. f Cell migration assays were performed in cells described in d using a high-throughput microfluidic migration platform to measure migration distance after 24 h. Data were collected from four replicates (a total of 1200 channels) were performed. Box graphs were plotted using Origin 9.0. The bottom and top of the box are the first and third quartiles, and the band inside the box is always the second quartile (the median). The ends of the whiskers represent the 5th percentile and the 95th percentile. The square inside the box indicates the mean, and the x outside the box indicates the minimum and maximum of all of the data. *p ≤ 0.05; **p ≤ 0.01
Fig. 4
Fig. 4
pEZH2(T367) is promotes breast cancer cell migration, invasion, and adhesion without affecting cell proliferation. a Western blot analysis of MDA-MB-231 breast cancer cells showing EZH2 knockdown after lentiviral transduction with control shRNA (shVector) or 3′ UTR EZH2-targeting shRNA (shEZH2) and rescue with myc-tagged WT-EZH2 or T367A-EZH2. b Cells described in a employed in a high-throughput microfluidic migration platform. Data colleted from four independent biological replicates. Box graphs were plotted using Origin 9.0. The bottom and top of the box are the first and third quartiles, and the band inside the box is always the second quartile (the median). The ends of the whiskers represent the 5th percentile and the 95th percentile. The square inside the box indicates the mean, and the x outside the box indicates the minimum and maximum of all of the data. c Cells described in a were seeded in 12-well plates, grown to confluence, and subjected to wound healing assays. Representative images of the wound after 24 h shown above bars. d Reconstituted Boyden basement membrane invasive chamber assay of cells in a. Representative chambers after crystal violet staining shown above bars. e Cells described in a employed in a cell attachment assay. f Cells described in a subjected to time course proliferation assay using Hoescht 33258 to quantify dsDNA. Data for cf are from at least three independent experiments carried out in at least triplicate and are presented as mean±SD. *p ≤ 0.05; **p ≤ 0.01; ***p ≤ 0.005; ****p ≤ 0.0001
Fig. 5
Fig. 5
Inhibition of EZH2 T367 phosphorylation reduces breast cancer metastasis. a Representative bioluminescence images of primary tumors at one and nine weeks post tumor implantation. b Primary tumor growth curves of NOD/SCID mice orthotopically-implanted with MDA-MB-231 EZH2 knockdown rescue cells (n = 10 per condition) expressing GFP-Luciferase. Primary tumor growth as determined by caliper measurements, shown as mean ± SD. c Representative bioluminescence images of metastases (primary tumor shielded), imaged at four weeks post tumor implantation (left) with representative H&E staining of lung tissue from each of the four groups at nine weeks post implantation (right, ×600 magnification). d Metastatic lung burden assessed by measuring photon flux measured four weeks post tumor implantation using Live Image Pro after shielding primary tumors. Data are presented as means ± SEM. e Kaplan–Meier metastasis-free survival curve of mice as determined by presence of lung metastases with bioluminescence imaging showing difference between WT-EZH2 (red) and T367A-EZH2 (blue) knockdown-rescue groups. *p ≤ 0.05; **p ≤ 0.01
Fig. 6
Fig. 6
The interactome of pEZH2(T367) reveals new cytoplasmic binding proteins. a Schematic of mass spectrometry experiment to identify binding partners of EZH2 in MDA-MB-231 cells. Experiment was performed in triplicate. b Venn diagram displaying interactors overlap in proteins co-immunoprecipitating with WT- or T367A-EZH2 from the three biological replicates analyzed. c DAVID functional annotation analysis of processes enriched in WT-EZH2 over T367A-EZH2. d List of differential interactors identified from actin-binding set with fold-change (FC) scores and normalized FC scores based on total EZH2 pulldown. Average WT and T367A spectral counts (SC) and SAINT probabilities (SP) are also tabulated
Fig. 7
Fig. 7
EZH2 and vinculin interact in a phosphorylation-dependent manner. a Proximity ligation images depicting co-localization with the indicated proteins by red fluorescent dots in MDA-MB-231 cells. Scale bars=10 μm. b Quantitative analysis of the direct interaction between recombinant EZH2 and vinculin proteins using BLI. EZH2 was immobilized on a sensor chip, and a concentration series of vinculin protein was added. Sensorgrams and corresponding fitting curves for kinetics constants and affinity determination (left) and corresponding plot of steady state response against concentration (right) for determination of binding affinity. c Co-immunoprecipitation experiment from whole cell extracts demonstrating interaction between endogenous EZH2 and vinculin after treatment with doxycycline to induce p38 activation. d Western blot of MDA-MB-231 cells transduced with dox-inducible MKK6EE to activate p38α activity. e Western blot analysis comparing phospho-vinculin(Y100) in MDA-MB-231 knockdown-rescue WT-EZH2 and T367A-EZH2 cells. f Our working model of pEZH2(T367) function in breast tumorigenesis

References

    1. Howlader N, et al. (eds). SEER Cancer Statistics Review, 1975–2013 (National Cancer Institute, Bethesda, MD, 2016).
    1. Kleer CG, et al. EZH2 is a marker of aggressive breast cancer and promotes neoplastic transformation of breast epithelial cells. Proc. Natl Acad. Sci. USA. 2003;100:11606–11611. doi: 10.1073/pnas.1933744100. - DOI - PMC - PubMed
    1. Varambally S, et al. The polycomb group protein EZH2 is involved in progression of prostate cancer. Nature. 2002;419:624–629. doi: 10.1038/nature01075. - DOI - PubMed
    1. Morin RD, et al. Somatic mutations altering EZH2 (Tyr641) in follicular and diffuse large B-cell lymphomas of germinal-center origin. Nat. Genet. 2010;42:181–185. doi: 10.1038/ng.518. - DOI - PMC - PubMed
    1. Kim KH, Roberts CWM. Targeting EZH2 in cancer. Nat. Med. 2016;22:128–134. doi: 10.1038/nm.4036. - DOI - PMC - PubMed

Publication types

MeSH terms