. 2018 Jul 18;9(1):2802.
doi: 10.1038/s41467-018-05249-7.

Bilophila wadsworthia aggravates high fat diet induced metabolic dysfunctions in mice

Affiliations

Bilophila wadsworthia aggravates high fat diet induced metabolic dysfunctions in mice

Jane M Natividad et al. Nat Commun. .

Abstract

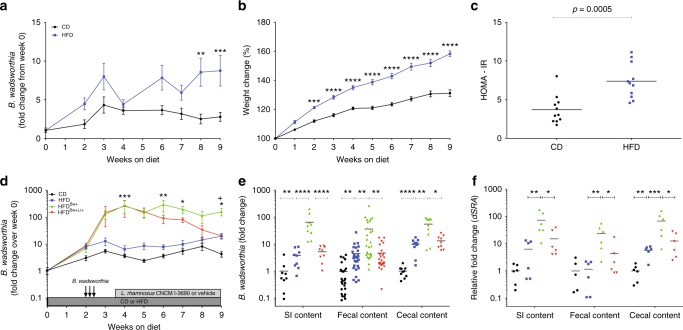
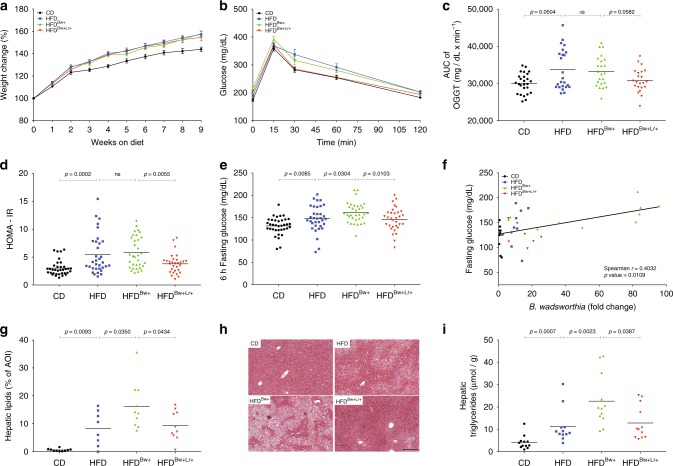
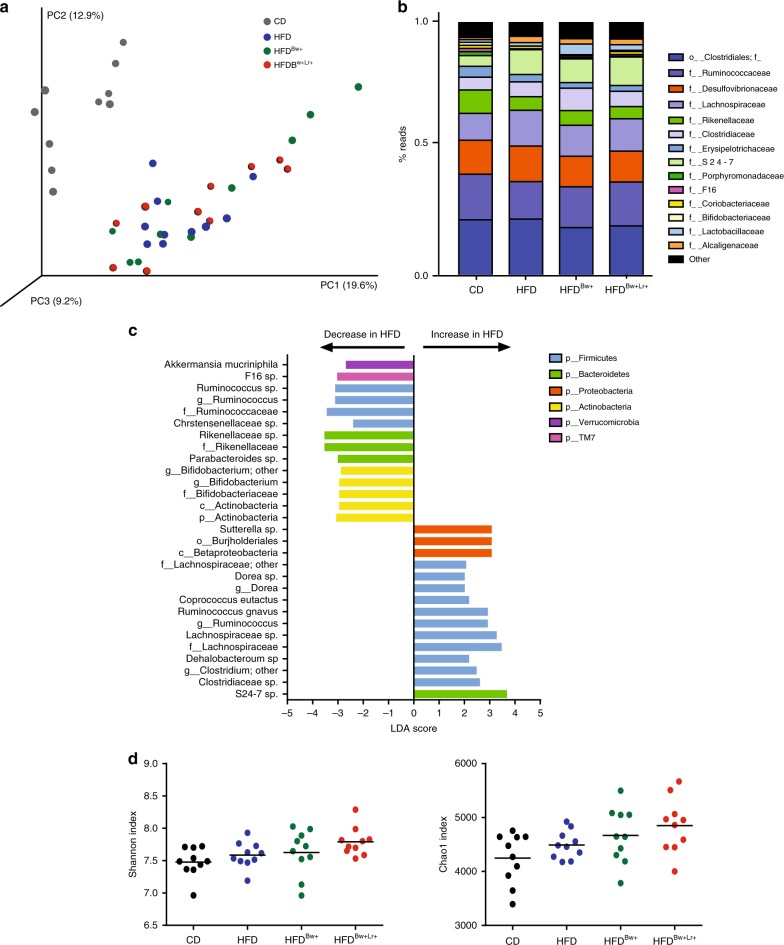
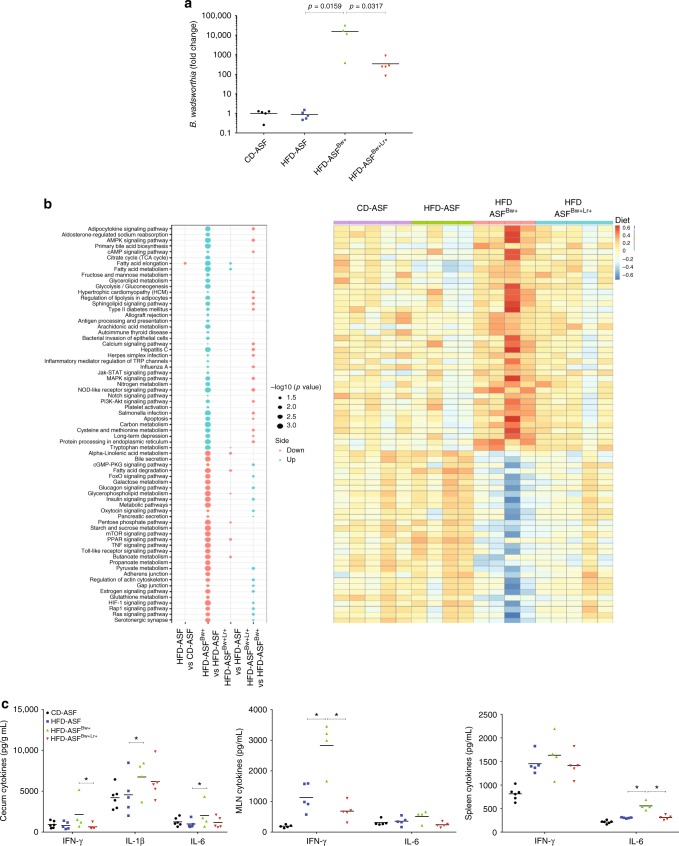
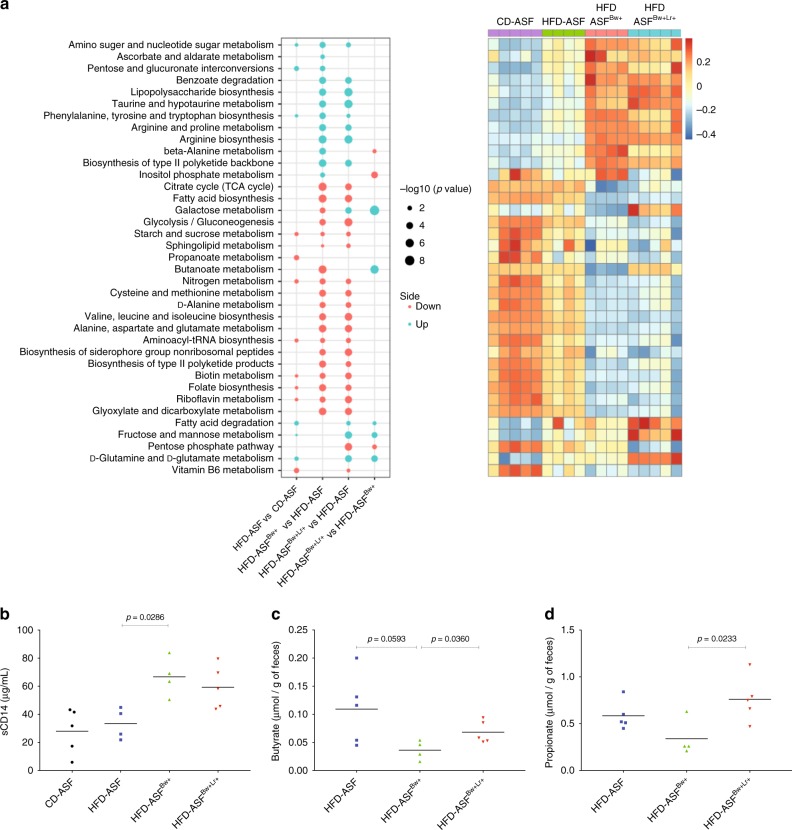
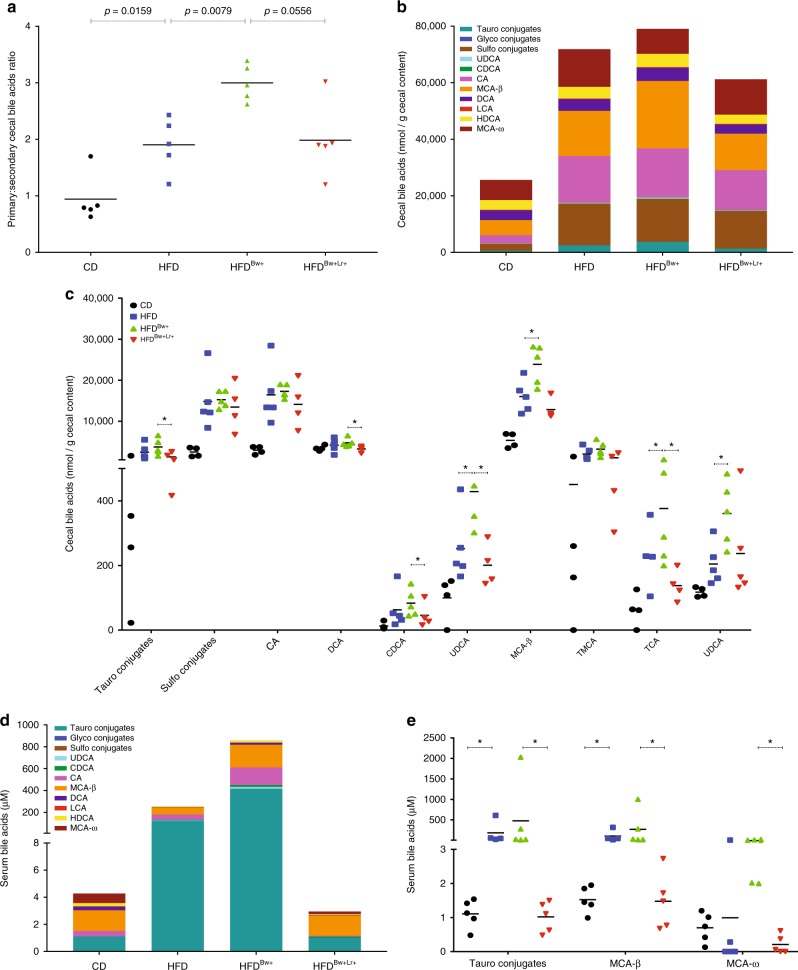
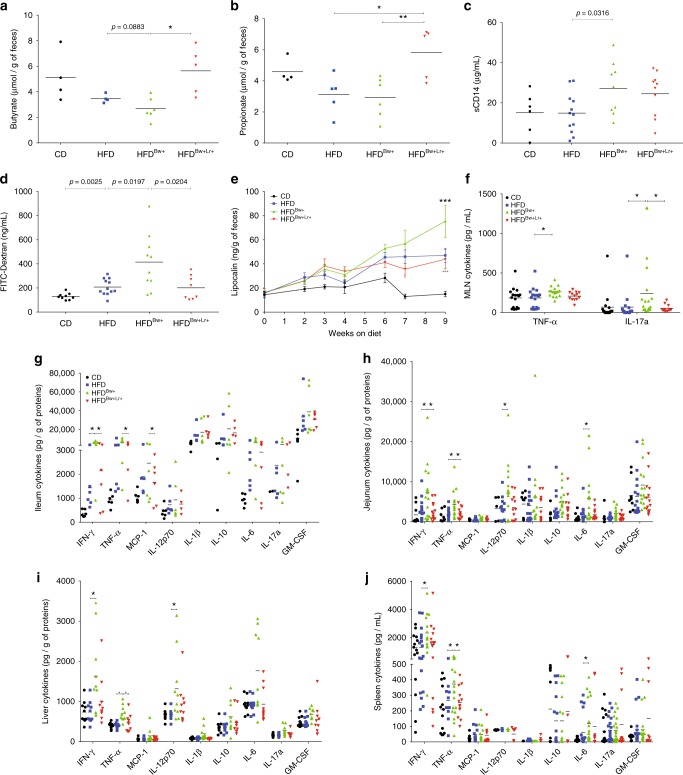
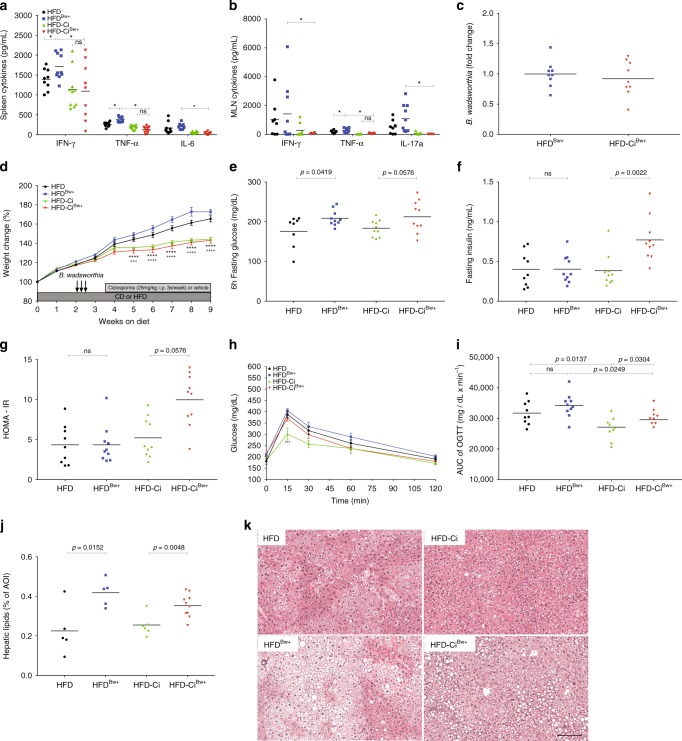
Dietary lipids favor the growth of the pathobiont Bilophila wadsworthia, but the relevance of this expansion in metabolic syndrome pathogenesis is poorly understood. Here, we showed that B. wadsworthia synergizes with high fat diet (HFD) to promote higher inflammation, intestinal barrier dysfunction and bile acid dysmetabolism, leading to higher glucose dysmetabolism and hepatic steatosis. Host-microbiota transcriptomics analysis reveal pathways, particularly butanoate metabolism, which may underlie the metabolic effects mediated by B. wadsworthia. Pharmacological suppression of B. wadsworthia-associated inflammation demonstrate the bacterium's intrinsic capacity to induce a negative impact on glycemic control and hepatic function. Administration of the probiotic Lactobacillus rhamnosus CNCM I-3690 limits B. wadsworthia-induced immune and metabolic impairment by limiting its expansion, reducing inflammation and reinforcing intestinal barrier. Our results suggest a new avenue for interventions against western diet-driven inflammatory and metabolic diseases.


Conflict of interest statement

P.V. is a Danone Employee. The remaining authors declare no competing interests.

Figures

Fig. 1
Fig. 1
B. wadsworthia expands in HFD environment. a Fold change of B. wadsworthia in mice fed with control diet (CD) or high-fat diet (HFD) relative from day 0 (**p < 0.01, ***p < 0.001; n = 11/group). b Body weight gain (***p < 0.001, ****p < 0.0001; n = 11/group), c Homeostatic model assessment-insulin resistance (HOMA-IR) after 6 h of fasting (n = 10/group). d Fold change of B. wadsworthia relative from day 0 in mice fed with control diet (CD) or high-fat diet (HFD) and inoculated with B. wadsworthia (Bw+) and treated with L. rhamnosus CNCM I-3690 (Lr+) (*p < 0.05, **p < 0.01, ***p < 0.001 vs HFD; +p < 0.05 vs HFDBw+Lr+; n = 16–28/group). e B. wadsworthia load in small intestinal (SI), fecal and cecal contents after 9 weeks of CD or HFD. f Expression of the dsra gene in the small intestinal (SI), fecal and cecal contents after 9 weeks of CD or HFD (*p < 0.05, **p < 0.01, ***p < 0.001, ****p < 0.0001). Statistical comparison was performed by first testing normality using Kolmogorov–Smirnov test, then t-test with Welch correction or Mann–Whitney non-parametric test for two groups, or ANOVA or Kruskal–Wallis test with Bonferroni or Dunn’s post hoc test for more than three groups. Error bars represents SEM
Fig. 2
Fig. 2
B. wadsworthia synergizes with HFD to trigger a stronger metabolic impairments. a Body weight gain (n = 37–40/group). b Blood glucose level before and after oral glucose tolerance challenge (OGTT; 2 g/kg mouse; n = 27–40/group). c Area under the curve (AUC) of OGTT. d homeostatic model assessment-insulin resistance (HOMA-IR) after 6 h of fasting. e Blood glucose after 6 h of fasting. f Spearman correlation of fasting glucose and B. wadsworthia load in the cecal content. g Lipid area, calculated as % area of interest (AOI), in liver cross-sections stained with H&E. h Representative pictures of liver stained with H&E. Scale bar = 100 µm. i Liver triglycerides after 6 h of food deprivation. Statistical comparison was performed by first testing normality using Kolmogorov–Smirnov test and then ANOVA or Kruskal–Wallis test with Bonferroni or Dunn’s post hoc test. Error bars represents SEM
Fig. 3
Fig. 3
HFD induces significant impact on microbiota composition. a PCoA plot (Bray Curtis distance) of fecal microbiota of CD-fed or HFD-fed mice inoculated with or without B. wadsworthia (Bw) and/or L. rhamnosus CNCM I-3690 (Lr) on Bray Curtis distance. b Bar graph of bacterial abundance in family level. c Bacterial taxa differentially enriched in HFD- compared to CD-fed mice determined using Linear discriminant analysis (LDA) effect size (LEfSe) algorithm. d Fecal microbiota alpha diversity. Statistical comparison was performed by first testing normality using Kolmogorov–Smirnov test and then ANOVA or Kruskal–Wallis test with Bonferroni or Dunn’s post hoc test. For each group, two cages of five animals were used and analyzed
Fig. 4
Fig. 4
B. wadsworthia regulates expression of inflammatory and metabolic-related host genes under HFD setting. a Fold change of B. wadsworthia (Bw) relative from altered Schaedler flora (ASF)-colonized mice fed with control diet (CD). b Left: Bubble plot of -log10(BH p-values) of a selection of significant pathway activities between indicated groups (Blue: up regulated in first compared to second group. Red: down regulated in first compared to second group); right: Heatmap of corresponding pathway activity. c Cytokine production in caecum, mesenteric lymph node and spleen (*p < 0.05 vs. HFD-ASF, +p < 0.05 vs. HFD-ASFBw+; n = 4–5/group). Statistical comparison was performed by first testing normality using Kolmogorov–Smirnov test and then ANOVA or Kruskal–Wallis test with Bonferroni or Dunn’s post hoc test. Error bars represents SEM
Fig. 5
Fig. 5
The presence of B. wadsworthia and L. rhamnosus CNCM I-3690 induces changes in microbiota metatranscriptomics. a Left: Bubble plot of -log10(BH p-values) of a selection of significant pathway activities between indicated groups (Blue: up regulated in first compared to second group. Red: down regulated in first compared to second group); right: Heatmap of corresponding pathway activity. b Concentration of soluble CD14 in serum. c Butyrate and d propionate concentrations in the feces. Statistical comparison was performed by first testing normality using Kolmogorov–Smirnov test and then ANOVA or Kruskal–Wallis test with Bonferroni or Dunn’s post hoc test. Error bars represents SEM
Fig. 6
Fig. 6
B. wadsworthia worsens HFD-induced bile acid dysmetabolism. a Ratio of primary to secondary bile acids in caecum. b Stacked bar showing the bile acids concentration in the caecum. c Concentration of difference bile acids in the caecum. (*p < 0.05 vs. HFD, +p < 0.05 vs. HFDBw+; n = 5–6/group). d Stacked bar showing the bile acids concentration in the serum. e Concentration of difference bile acids in the serum (*p < 0.05, **p < 0.05; n = 5–6/group). Statistical comparison was performed by first testing normality using Kolmogorov–Smirnov test and then ANOVA or Kruskal–Wallis test with Bonferroni or Dunn’s post hoc test. Error bars represents SEM
Fig. 7
Fig. 7
B. wadsworthia potentiates HFD-induced intestinal barrier dysfunction and inflammation. a Butyrate and b propionate concentrations in caecum. c Soluble CD14 (sCD14) in the serum. d Concentration of FITC-dextran in the serum 3 h post-gavage. e Concentration of lipocalin-2 in the feces. f Cytokine production of mesenteric lymph node (MLN) cells after 48 h stimulation with PMA-ionomycin (*p-value vs. HFD, +p-value vs. HFDBw+; n = 6–16/group). Cytokines level in g ileal, h jejunal, and i liver homogenates (*p-value vs. HFD, +p-value vs. HFDBw+; n = 6–16/group). j Cytokine production of splenic cells after 48 h stimulation with PMA-ionomycin (*p-value vs. HFD, +p-value vs. HFDBw+; n = 6–16/group). Statistical comparison was performed by first testing normality using Kolmogorov–Smirnov test and then ANOVA or Kruskal–Wallis test with Bonferroni or Dunn’s post hoc test. Error bars represents SEM
Fig. 8
Fig. 8
Suppression of inflammation unmasks intrinsic effects of B. wadworthia on glucose homeostasis. Cytokine production in a spleen and b MLN of HFD fed mice receiving ciclosporine (Ci) and/or B. wadsworthia (Bw+) (*p < 0.05, n = 8–10/group). c B. wadsworthia load in the caecum (*p < 0.05, n = 8–10/group). d Weight gain after 9 weeks of HFD (****p< 0.0001 HFD vs. HFD-Ci; +++p< 0.001, ++++p< 0.0001 HFDBw+ vs. HFD-CiBw+, n = 8–10/group). e Blood glucose, f insulin, g homeostatic model assessment-insulin resistance (HOMA-IR) after 5–6 h of fasting. h Blood glucose level before and after oral glucose tolerance challenge (OGTT; 2 g/kg mouse; ***p< 0.001, *p< 0.05 HFD-Ci vs. HFD-CiBw+; n = 8–10/group). i Area under the curve (AUC) of OGTT. j Lipid area, calculated as % area of interest (AOI), in liver cross-sections stained with H&E. k Representative pictures of liver stained with H&E. Scale bar = 100 µm. Statistical comparison was performed by first testing normality using Kolmogorov–Smirnov test and then ANOVA or Kruskal–Wallis test with Bonferroni or Dunn’s post hoc test. Error bars represents SEM

References

    1. Sonnenburg JL, Backhed F. Diet-microbiota interactions as moderators of human metabolism. Nature. 2016;535:56–64. doi: 10.1038/nature18846. - DOI - PMC - PubMed
    1. David LA, et al. Diet rapidly and reproducibly alters the human gut microbiome. Nature. 2014;505:559–563. doi: 10.1038/nature12820. - DOI - PMC - PubMed
    1. Bernard D, Verschraegen G, Claeys G, Lauwers S, Rosseel P. Bilophila wadsworthia bacteremia in a patient with gangrenous appendicitis. Clin. Infect. Dis. 1994;18:1023–1024. doi: 10.1093/clinids/18.6.1023. - DOI - PubMed
    1. Kasten MJ, Rosenblatt JE, Gustafson DR. Bilophila wadsworthia bacteremia in two patients with hepatic abscesses. J. Clin. Microbiol. 1992;30:2502–2503. - PMC - PubMed
    1. Devkota S, et al. Dietary-fat-induced taurocholic acid promotes pathobiont expansion and colitis in Il10-/- mice. Nature. 2012;487:104–108. doi: 10.1038/nature11225. - DOI - PMC - PubMed

Publication types

MeSH terms

LinkOut - more resources