. 2018 Aug;20(8):954-965.
doi: 10.1038/s41556-018-0140-1. Epub 2018 Jul 18.

Shieldin complex promotes DNA end-joining and counters homologous recombination in BRCA1-null cells

Affiliations

Shieldin complex promotes DNA end-joining and counters homologous recombination in BRCA1-null cells

Harveer Dev et al. Nat Cell Biol. 2018 Aug.

Abstract

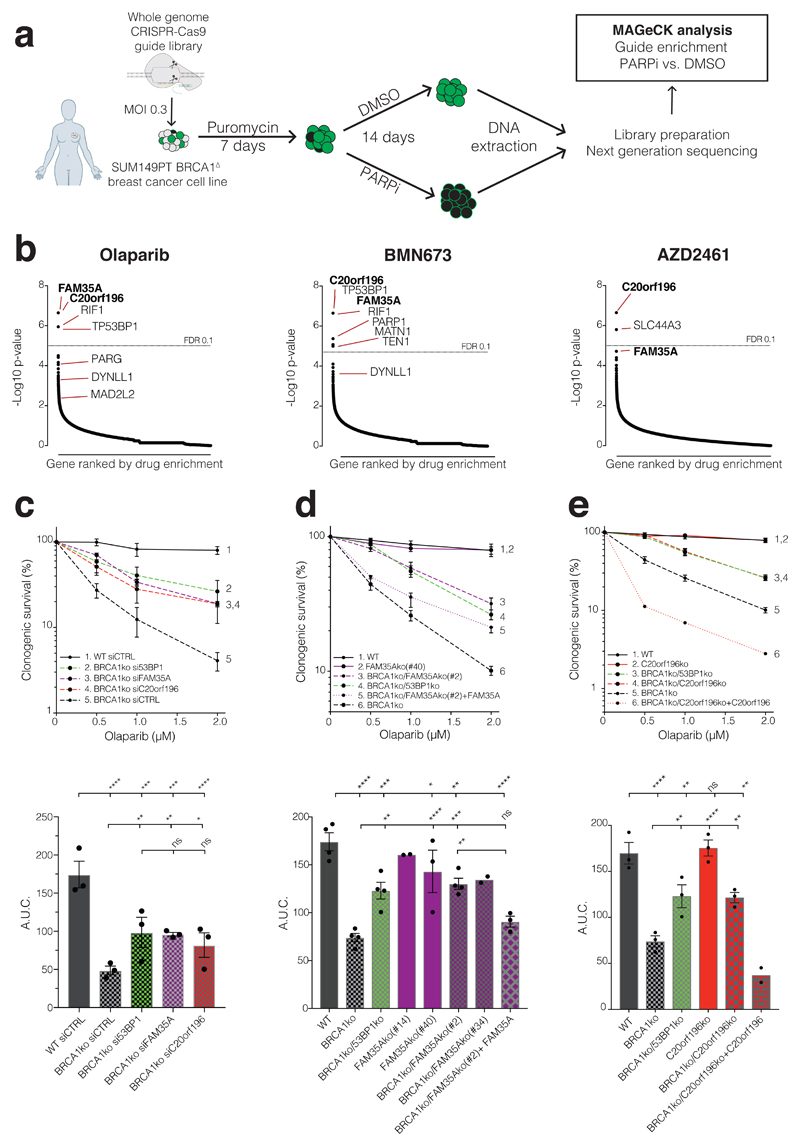
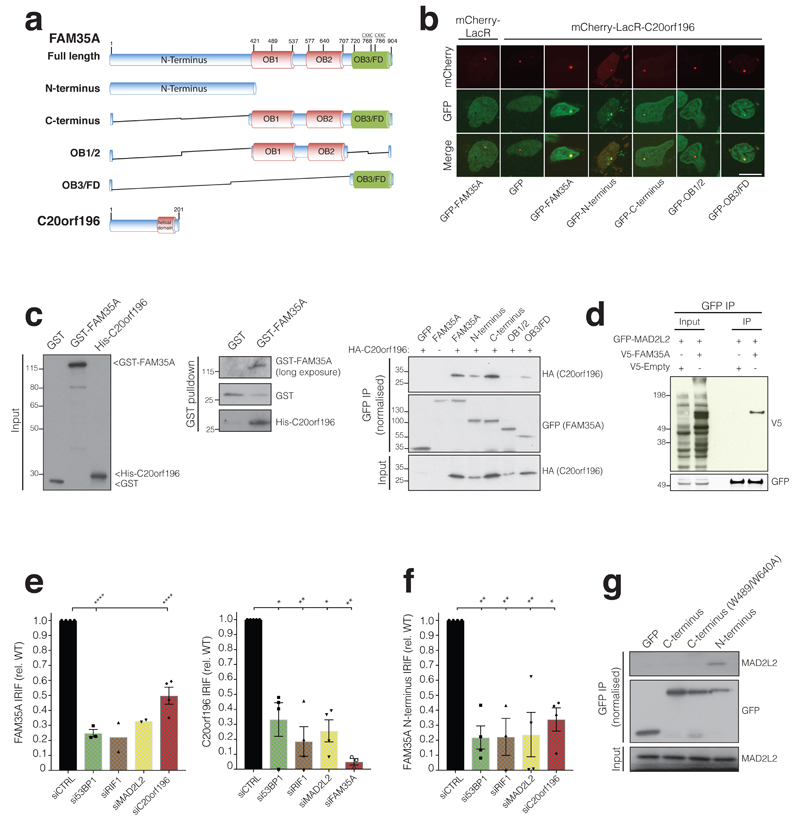
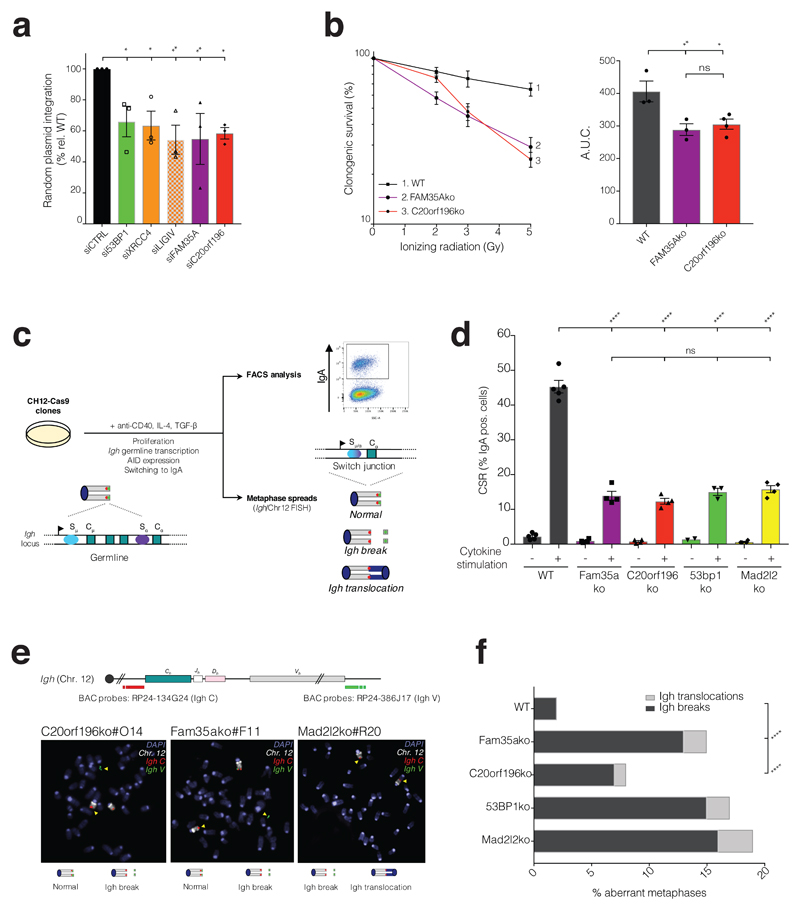
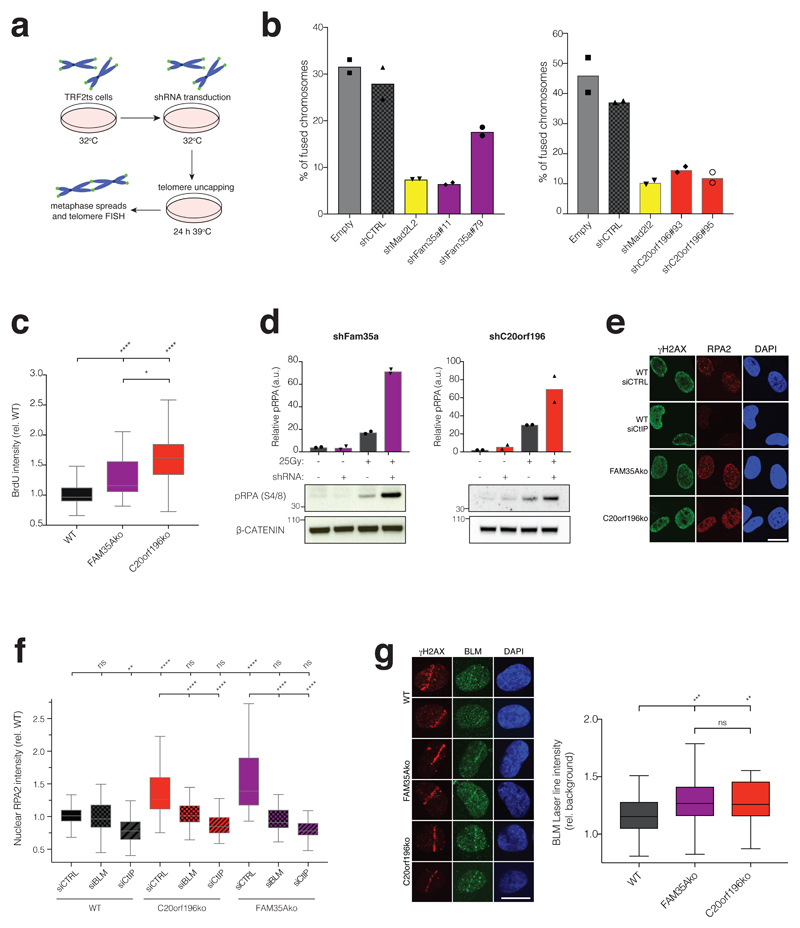
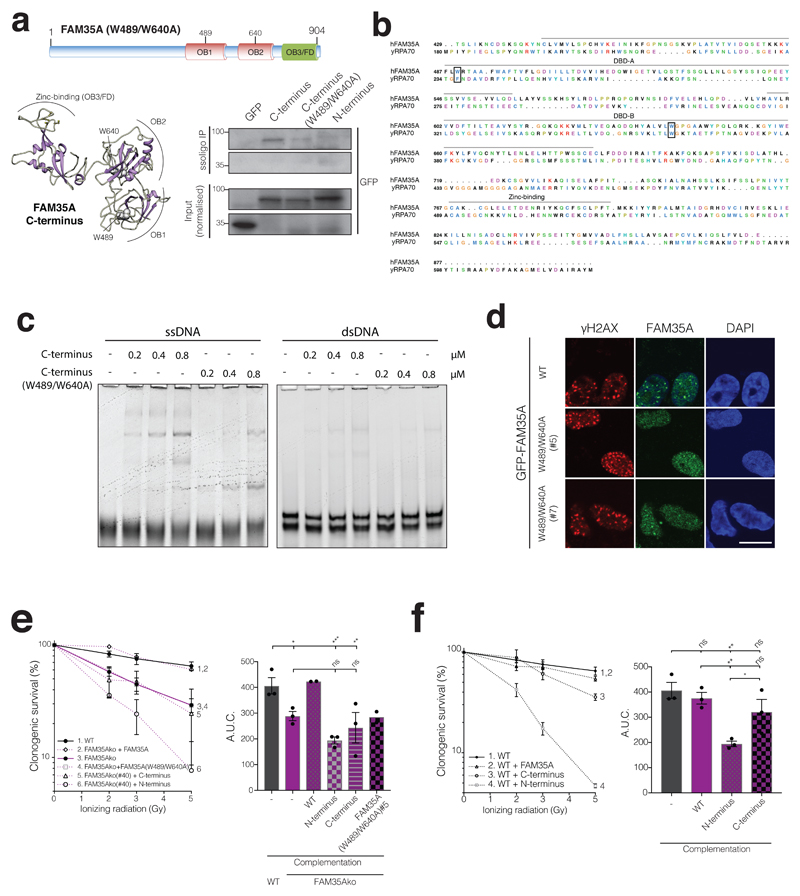
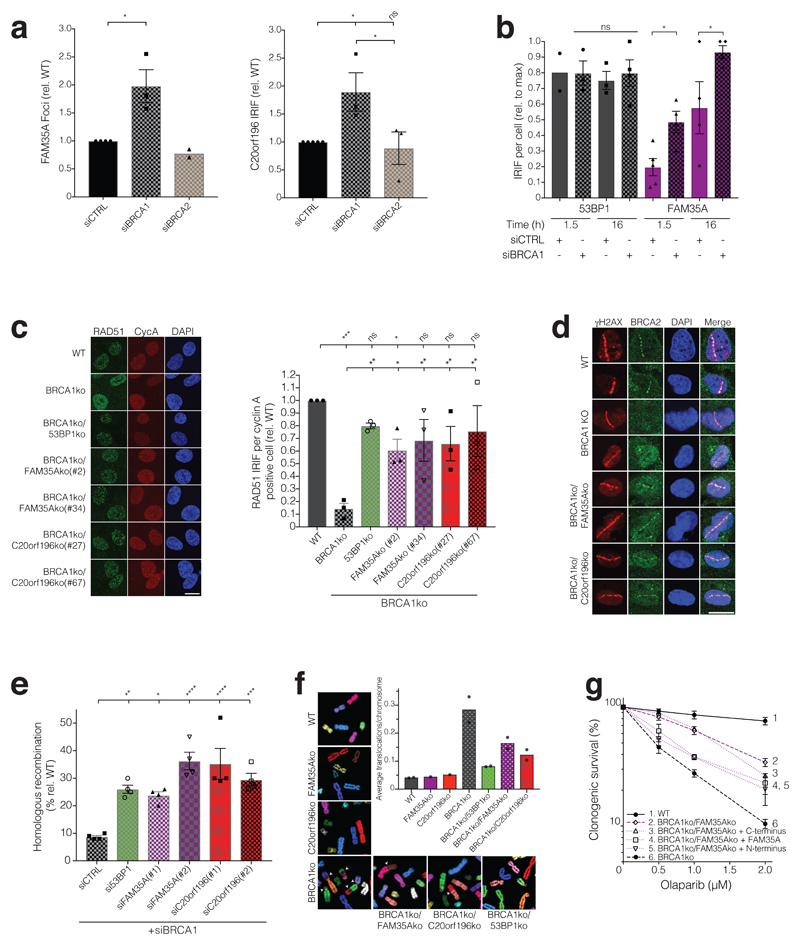
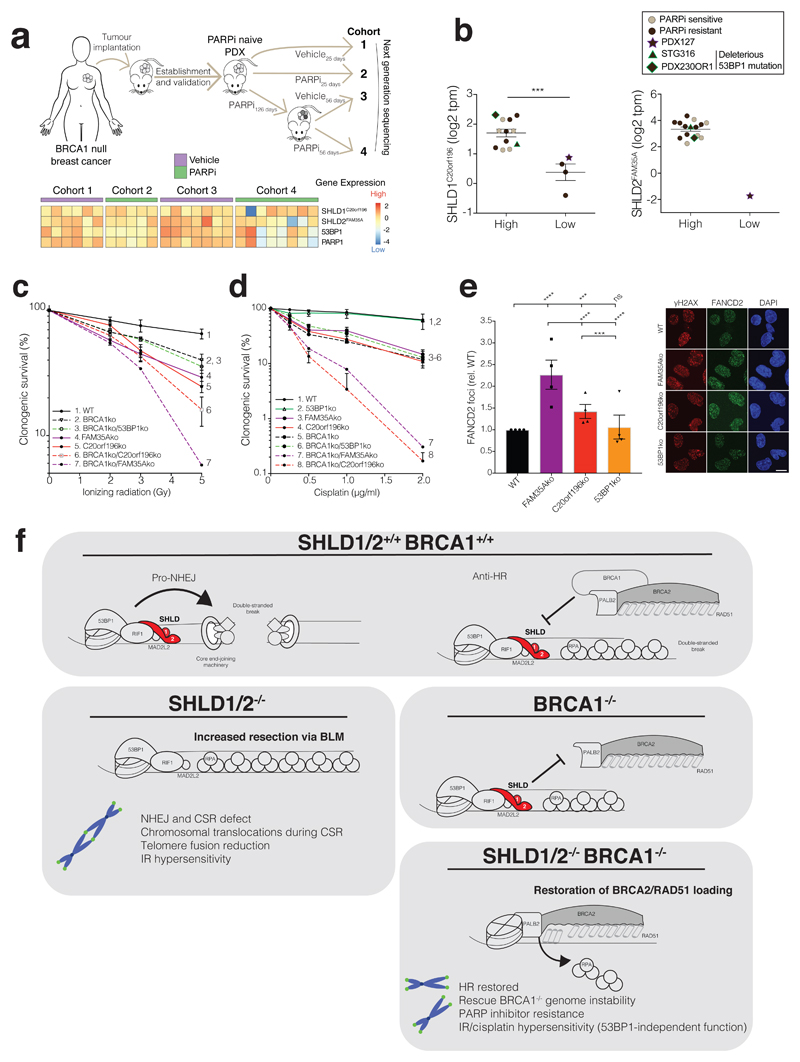
BRCA1 deficiencies cause breast, ovarian, prostate and other cancers, and render tumours hypersensitive to poly(ADP-ribose) polymerase (PARP) inhibitors. To understand the resistance mechanisms, we conducted whole-genome CRISPR-Cas9 synthetic-viability/resistance screens in BRCA1-deficient breast cancer cells treated with PARP inhibitors. We identified two previously uncharacterized proteins, C20orf196 and FAM35A, whose inactivation confers strong PARP-inhibitor resistance. Mechanistically, we show that C20orf196 and FAM35A form a complex, 'Shieldin' (SHLD1/2), with FAM35A interacting with single-stranded DNA through its C-terminal oligonucleotide/oligosaccharide-binding fold region. We establish that Shieldin acts as the downstream effector of 53BP1/RIF1/MAD2L2 to promote DNA double-strand break (DSB) end-joining by restricting DSB resection and to counteract homologous recombination by antagonizing BRCA2/RAD51 loading in BRCA1-deficient cells. Notably, Shieldin inactivation further sensitizes BRCA1-deficient cells to cisplatin, suggesting how defining the SHLD1/2 status of BRCA1-deficient tumours might aid patient stratification and yield new treatment opportunities. Highlighting this potential, we document reduced SHLD1/2 expression in human breast cancers displaying intrinsic or acquired PARP-inhibitor resistance.


Conflict of interest statement

Competing financial interests

SPJ receives some research funding from AstraZeneca and is a named inventor on patents describing the use of PARP inhibitors in cancer therapy. VS’s laboratory receives research funding support from AstraZeneca. MJO and ZL, are employees and shareholders of AstraZeneca. The other authors declare no competing financial interests.

Figures

Figure 1
Figure 1. CRISPR-Cas9 screens identify suppressors of PARP-inhibitor sensitivity in BRCA1-mutant cells.
a, Schematic of screen procedure. b, MAGeCK analysis of guide enrichments following specified drug treatments; false discovery rate (FDR) of 0.1 indicated by dotted line; n=3 technical replicates per drug treatment. c, siRNA mediated verification of hits in clonogenic survival assays; lower panels show area under the curve (AUC); n=3 independent experiments d, De novo Cas9 mediated knockout (ko) verification and complementation for FAM35A in clonogenic survival assays (multiple ko clones are shown in AUC); n=4 independent experiments except FAM35Ako(#14) (n=2), FAM35Ako(#40) (n=3), BRCA1ko/FAM35Ako(#34) (n=2), and BRCA1ko/FAM35Ako(#2) +FAM35A (n=3). e, As (d) but for C20orf196; n=3 independent experiments except BRCA1ko/C20orf196ko + C20orf196 (n=2). c-e Bars represent mean ± SEM, one-way Anova; *p<0.05, **p<0.01, ***p<0.001, ****p<0.0001, ns=not significant (p≥0.05). Individual data points are plotted over bars, and statistical source data including the precise p values can be found in Supplementary Table 5.
Figure 2
Figure 2. FAM35A and C20orf196 domains, interactions and IRIF formation.
a, FAM35A and C20orf196 predicted domains and variants used, OB fold (OB), FAM domain (OB3/FD). b, Recruitment of FAM35A/derivatives GFP-fusions to a chromosomal Lac-operator array via mCherry-LacR-C20orf196. Data shown represent 3 experiments with quantifications shown in Supplementary Fig 2a. Scale bar 10µm. c, (left and middle panel) Purified recombinant GST-FAM35A directly interacts with recombinant His-C20orf196. c, (right panel) Cell extracts expressing GFP-FAM35A/derivatives and HA-C20orf196 analysed by co-immunoprecipitation and immunoblotting. d, V5-FAM35A co-immunoprecipitates with GFP-MAD2L2; interaction with C20orf196 shown in Supplementary Fig 2c. e, Quantification of inducible GFP-FAM35A (left panel) and GFP-C20orf196 (right panel) IRIF in γH2AX positive cells 5 h after IR (5Gy) treated with indicated siRNAs. N=4 independent experiments except (left panel) si53BP1 (n=3), siRIF1 and siMAD2L2 (n=2); and (right panel) siCTRL(n=5), siRIF1(n=3), siFAM35A(n=3). f, As in (e) but for inducible GFP-FAM35A N-terminus; n=4 independent experiments except siRIF1 (n=3). g, Endogenous MAD2L2 co-immunoprecipitates with GFP-FAM35A N-terminus. e-f, Bars represent mean ± SEM, one-way Anova; *p<0.05, **p<0.01, ***p<0.001, ****p<0.0001, ns=not significant (p≥0.05); individual data points plotted over bars. Statistical source data including the precise p values are shown in Supplementary Table 5. All immunoblots are representative of two independent experiments; unprocessed scans of immunoblots are shown in Supplementary Fig 8.
Figure 3
Figure 3. FAM35A and C20orf196 promote NHEJ and immunoglobulin class-switch recombination.
a, Random plasmid integration assay. b, FAM35Ako and C20orf196ko cells were treated with IR and analysed for clonogenic survival, right panel shows AUC. a-b, Bars represent mean ± SEM, one-way Anova; n=3 independent experiments, except C20orf196ko in b (n=4), with individual data points plotted over bars; statistical source data can be found in Supplementary Table 5. c, Schematic representation of class-switch recombination and chromosomal instability in murine IgM+ B cells (germline configuration with Cμ transcription) induced to express AID and undergo CSR to IgA (switch configuration with Cα transcription) upon addition of anti-CD40, IL4 and TGF-β. CSR levels are measured as the % of IgA positive cells after 72 h cytokine stimulation, and DNA fluorescence in situ hybridization (FISH) is performed using a chromosome 12-specific paint (grey chromosome) and Igh locus specific probes (red and green spots) for the measurement of chromosomal instability at the Igh locus upon induction of CSR. d, CSR levels in Fam35Ako and C20orf196ko CH12-Cas9 cells are reduced compared with wild-type (WT) CH12-Cas9 cells. Bars represent mean ± SEM, one-way Anova. N=4 independent experiments of 3 clones except 53BP1ko +cytokine where n=3 of 2 clones, and 53BP1ko -cytokine where n=2 of 2 clones; with individual data points plotted over bars. e, Representative images of Igh translocation and breaks in aberrant metaphases, quantified in f. f, Quantification of Igh breaks and translocations in metaphases of the indicated CH12-Cas9 cells. Horizontal bars represent means, Fisher’s Exact test; n=2 independent experiments except Fam35ako and C20orf196ko where n=3. For a, b, d and f, *p<0.05, **p<0.01, ***p<0.001, ****p<0.0001, ns=not significant (p≥0.05); statistical source data including the precise p values for these panels can be found in Supplementary Table 5.
Figure 4
Figure 4. FAM35A and C20orf196 promote telomere-mediated fusions and limit DNA-end resection.
a, Schematic of TRF2ts experimental setup. b, shRNA depletion of FAM35A (left panel) or C20orf196 (right panel) reduces un-capped telomere-mediated chromosome fusions. Bars represent means. The experiments were performed twice with ≥1300 chromosomes counted per condition, and individual data points plotted over bars; source data can be found in Supplementary Table 5. c, FAM35Ako and C20orf196ko RPE1 cells labelled with BrdU (10μM) for 48 h then treated with 1µM camptothecin (CPT) for 1 h, pre-extracted, fixed and stained for BrdU under non-denaturing conditions to visualise ssDNA. Box and whisker plot with centre line at median, box limits at 25th/75th centiles and whiskers ±1.5xIQR; one-way Anova; n=3 independent experiments. d, IR-induced pRPA(S4/8) is enhanced in MEFs due to Fam35a or C20orf196 silencing. Bars represent means. The experiments were performed twice with individual data points plotted over bars; source data can be found in Supplementary Table 5. e, RPE1-FAM35Ako or -C20orf196ko cells display hyper DNA-end resection (cells treated with 1μM camptothecin for 1h). Representative images from 3 independent experiments. Scale bar 10µm. f, RPE1-FAM35Ako or -C20orf196ko cells display BLM and CtIP dependent markers of excessive DNA-end resection. Box and whisker plot with centre line at median, box limits at 25th/75th centiles and whiskers ±1.5xIQR; one-way Anova; n=3 independent experiments. g, Enhanced BLM accrual in FAM35Ako and C20orf196ko compared with wild-type (WT) RPE1 cells fixed and stained 2 h after laser micro-irradiation. Representative images shown in left panel and quantification in right panel. Scale bar 10µm. Box and whisker plot with centre line at median, box limits at 25th/75th centiles and whiskers ±1.5xIQR; one-way Anova; n=3 independent experiments. For c, f and g, *p<0.05, **p<0.01, ***p<0.001, ****p<0.0001, ns=not significant (p≥0.05); statistical source data including the precise p values can be found in Supplementary Table 5.
Figure 5
Figure 5. FAM35A OB folds mediate ssDNA interaction and is required for IR resistance.
a, Schematic of FAM35A with residues W489/W640 mutated to A (top panel). Predicted 3D structure of wild-type FAM35A with W489 and W640 positions (lower left panel). FAM35A W489/W640 promote efficient ssDNA binding in cellular extracts (lower right panel). b, Alignment of yRPA1 with FAM35A C-terminus; amino acids critical for yRPA1 ssDNA binding and the corresponding amino acid residues in FAM35A are boxed. c, EMSAs on native (non-denaturing) gels with 10nM ssDNA or dsDNA, and the indicated purified, bacterially expressed FAM35A C-terminus or W489/W640A mutant in µM. d, Inducible GFP-FAM35A W489/W640A fails to efficiently form IRIF (12 h after 5Gy of IR). Scale bar 10µm. Representative images from 3 independent experiments. e, FAM35Ako RPE1 cells complemented with FAM35A derivatives in clonogenic survival assays; right panel shows AUC. f, Overexpression of FAM35A N-terminus but not C-terminus or full-length FAM35A sensitises wild-type cells to IR in clonogenic assays; right panel shows AUC. e-f, Bars represent mean ± SEM, one-way Anova; *p<0.05, **p<0.01, ***p<0.001, ****p<0.0001, ns=not significant (p≥0.05); n=3 independent experiments except group 2 and 4 in e (n=2), with individual data points plotted over bars; statistical source data including the precise p values can be found in Supplementary Table 5. All immunoblots are representative of two independent experiments; unprocessed scans of immunoblots are shown in Supplementary Fig 8.
Figure 6
Figure 6. FAM35A or C20orf196 loss restores HR in BRCA1-deficient cells.
a, Quantification of GFP-FAM35A (left panel) and GFP-C20orf196 (right panel) IRIF in U2OS cells after BRCA1 or BRCA2 depletion (5 h after 5Gy). Bars represent mean ± SEM, one-way Anova; n=3 independent experiments, except FAM35A siCTRL (n=4), FAM35A siBRCA2 (n=2), and C20orf196 siCTRL (n=5); with individual data points plotted over bars. b, Quantification of 53BP1 and inducible GFP-FAM35A IRIF in U2OS cells with or without BRCA1 depletion (5Gy, indicated time points). Bars represent mean ± SEM, one-way Anova; n=4 independent experiments, except 53BP1 1.5h siCTRL (n=2), 53BP1 1.5h siBRCA1 and 53BP1 16h siCTRL (n=3), FAM35A 1.5h siCTRL (n=5); with individual data points plotted over bars. c, Representative images (left panel) and quantification (right panel) of RAD51 IRIF (5.5 h after 5Gy) in Cyclin A (CycA) positive RPE1ko cell lines as indicated. Bars represent mean ± SEM, one-way Anova; n=3 independent experiments, with individual data points plotted over bars. Scale bar 10µm. d, FAM35A/C20orf196 loss restore BRCA2 recruitment 2 h after laser-induced DNA-damage sites in BRCA1-null cells (for quantification see Supplementary Fig 6e). Scale bar 10µm. e, HR assay in U2OS-TLR cells treated with indicated siRNAs (for gating strategy see Supplementary Fig 6f). Bars represent mean ± SEM, one-way Anova; n=4 independent experiments, with individual data points plotted over bars. f, Formation of spontaneous chromosomal aberrations in BRCA1ko cells is alleviated by FAM35A/C20orf196 inactivation. Representative images of metaphase spreads shown, and quantified in graph; bars represent means, n=2 independent experiments except FAM35Ako and C20orf196ko (n=1), with individual data points plotted over bars. g, Olaparib clonogenic survival assay with indicated RPE1ko and complemented cell lines. Bars represent mean ± SEM, one-way Anova; n=4 independent experiments, except group 4 and 5 (n=3) and group 3 (n=2); AUC is shown in Supplementary Fig 6g. For a-c and e, *p<0.05, **p<0.01, ***p<0.001, ****p<0.0001, ns=not significant (p≥0.05); statistical source data including the precise p values can be found in Supplementary Table 5.
Figure 7
Figure 7. FAM35A or C20orf196 loss correlates with PARP inhibitor resistance in cancers.
a, Schematic of in vivo PDX study (top panel). Heat map generated from mRNA-sequencing showing scaled expression levels of indicted genes from corresponding PDX samples (lower panel); n=6, 5, 7, 8 mice for cohorts 1-4 respectively. b, Expression of C20orf196/FAM35A in breast and ovarian cancer PDXs derived from BRCA1-deficient tumours. y-axis: log2 transcript per million. Lines represent mean ± SEM; n=12, 4, 15, 1 for SHLD1-high, SHLD1-low, SHLD2-high, SHLD2-low groups respectively; two-tailed unpaired student t-test; ***p=0.0003. Statistical source data for PDXs can be found in Supplementary Table 5 and methods. c-d, Clonogenic survival assay after IR (c) or cisplatin treatment (d) in the indicated RPE1ko cell lines with AUC shown in Supplementary Fig 7b and 7c, respectively. Data shown represent mean ± SEM (n = 3 independent experiments except for group 7 in c and group 7 in d where n = 2) e, Loss of FAM35A/C20orf196 leads to increased cisplatin-induced FANCD2 foci. Bars represent mean ± SEM, one-way Anova; *p<0.05, **p<0.01, ***p<0.001, ****p<0.0001, ns=not significant (p≥0.05); n=4 independent experiments, with individual data points plotted over bars; statistical source data can be found in Supplementary Table 5. Scale bar 10µm. f, Proposed model for the action of SHLD1/2 in DSB repair in the presence or absence of functional BRCA1.

Comment in

  • Assembling a protective shield.
    Greenberg RA. Greenberg RA. Nat Cell Biol. 2018 Aug;20(8):862-863. doi: 10.1038/s41556-018-0152-x. Nat Cell Biol. 2018. PMID: 30050117 Free PMC article. No abstract available.

References

    1. Goldstein M, Kastan MB. The DNA damage response: implications for tumor responses to radiation and chemotherapy. Annu Rev Med. 2015;66:129–143. - PubMed
    1. Jackson SP, Bartek J. The DNA-damage response in human biology and disease. Nature. 2009;461:1071–1078. - PMC - PubMed
    1. Schwertman P, Bekker-Jensen S, Mailand N. Regulation of DNA double-strand break repair by ubiquitin and ubiquitin-like modifiers. Nat Rev Mol Cell Biol. 2016;17:379–394. - PubMed
    1. Blackford AN, Jackson SP. ATM, ATR, and DNA-PK: The Trinity at the Heart of the DNA Damage Response. Mol Cell. 2017;66:801–817. - PubMed
    1. Bekker-Jensen S, Mailand N. Assembly and function of DNA double-strand break repair foci in mammalian cells. DNA Repair (Amst) 2010;9:1219–1228. - PubMed

Publication types

MeSH terms