. 2018 Jul;559(7715):617-621.
doi: 10.1038/s41586-018-0344-3. Epub 2018 Jul 18.

The outer membrane is an essential load-bearing element in Gram-negative bacteria

Affiliations

The outer membrane is an essential load-bearing element in Gram-negative bacteria

Enrique R Rojas et al. Nature. 2018 Jul.

Abstract

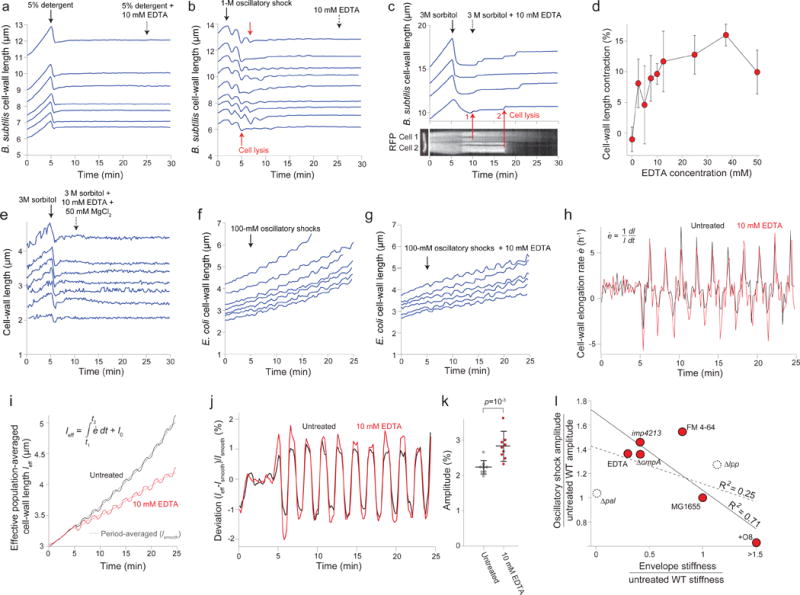
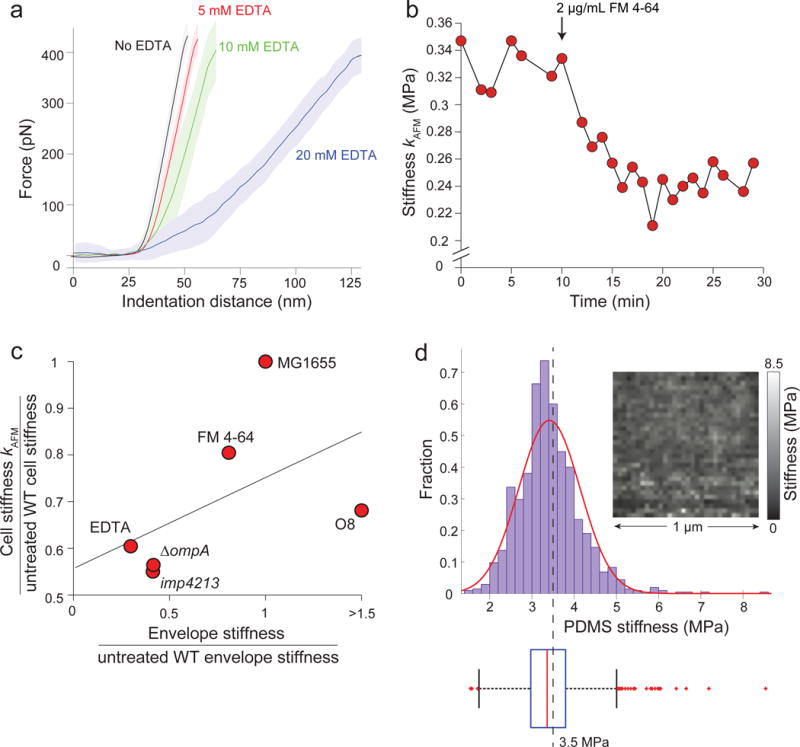
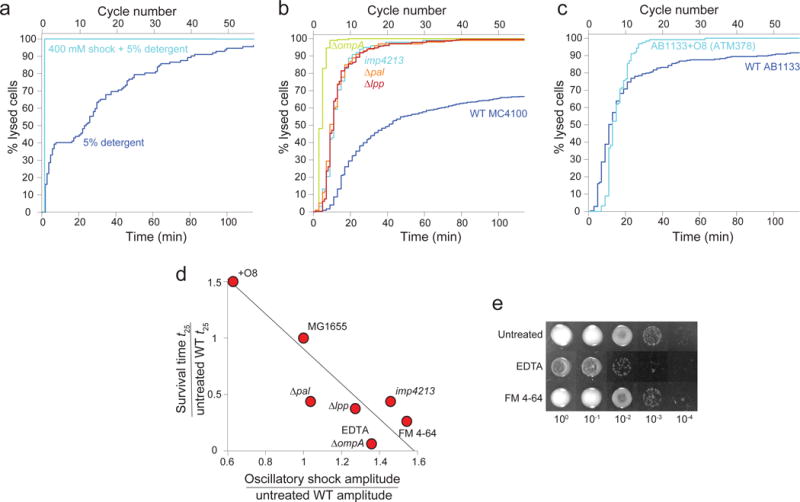
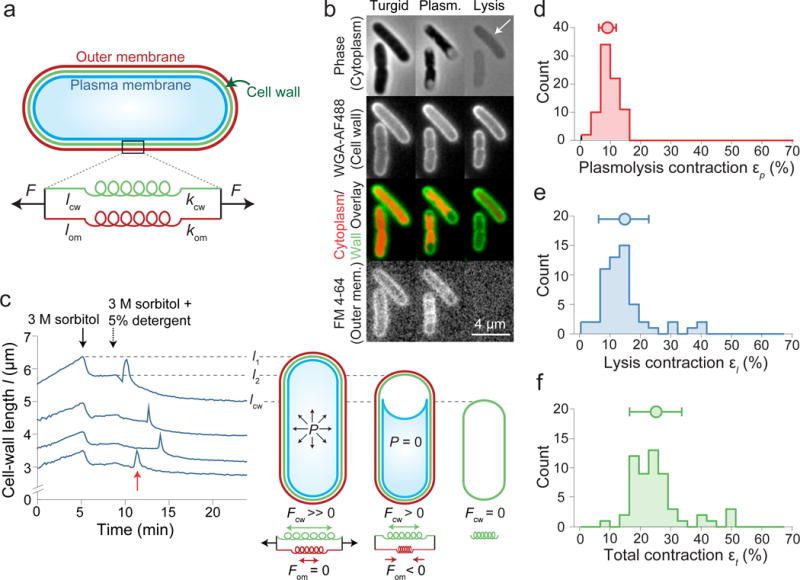
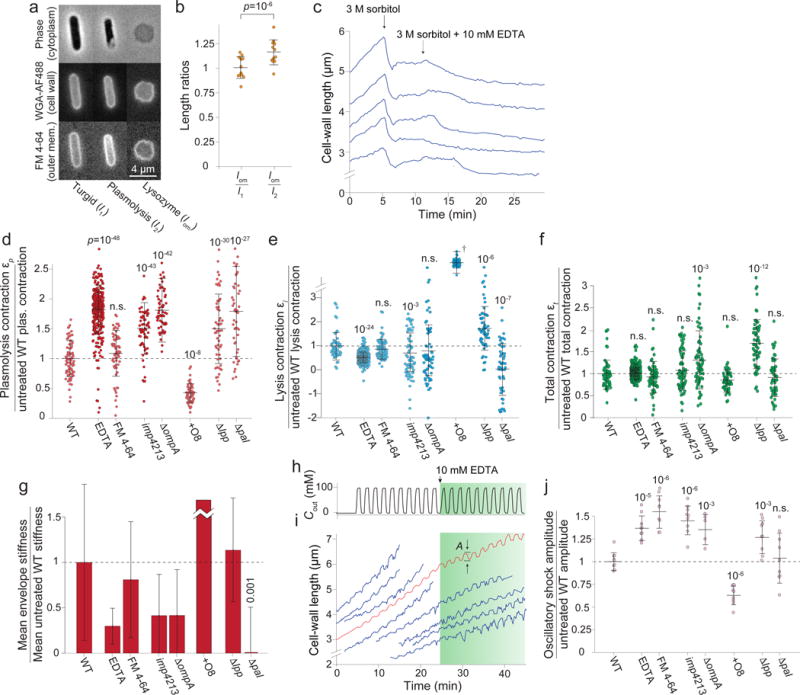
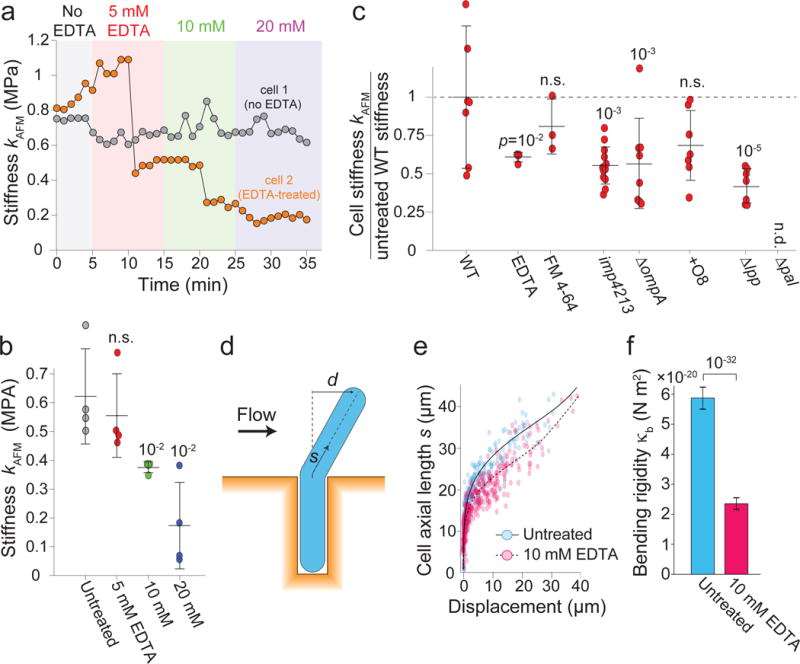
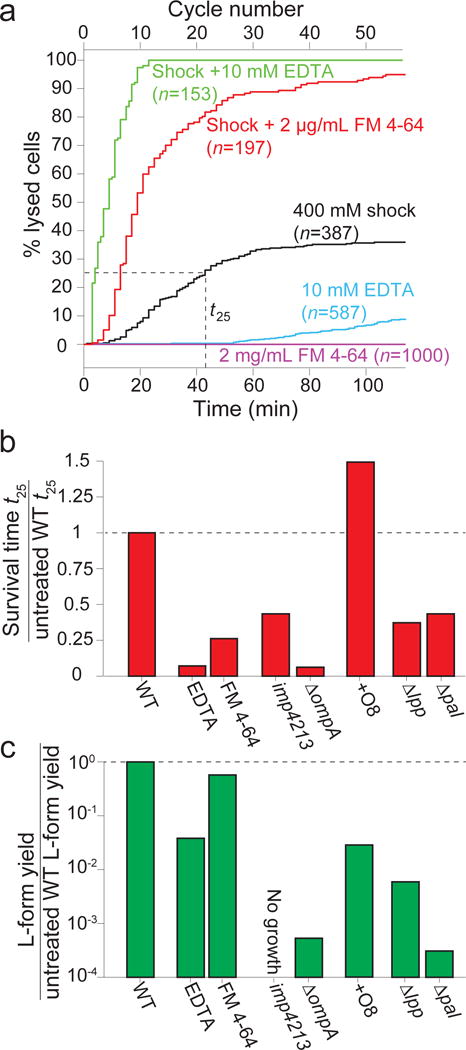
Gram-negative bacteria possess a complex cell envelope that consists of a plasma membrane, a peptidoglycan cell wall and an outer membrane. The envelope is a selective chemical barrier1 that defines cell shape2 and allows the cell to sustain large mechanical loads such as turgor pressure3. It is widely believed that the covalently cross-linked cell wall underpins the mechanical properties of the envelope4,5. Here we show that the stiffness and strength of Escherichia coli cells are largely due to the outer membrane. Compromising the outer membrane, either chemically or genetically, greatly increased deformation of the cell envelope in response to stretching, bending and indentation forces, and induced increased levels of cell lysis upon mechanical perturbation and during L-form proliferation. Both lipopolysaccharides and proteins contributed to the stiffness of the outer membrane. These findings overturn the prevailing dogma that the cell wall is the dominant mechanical element within Gram-negative bacteria, instead demonstrating that the outer membrane can be stiffer than the cell wall, and that mechanical loads are often balanced between these structures.


Conflict of interest statement

Author Information

The authors have no competing financial interests.

Figures

Extended Data Figure 1
Extended Data Figure 1. Cell-wall deformation is approximately linear with respect to hyperosmotic shock over a large range
Population-averaged contraction of cell wall lengths versus hyperosmotic shock magnitude (n = 92, 73, 53, 71, 58, 11, 31, 47 cells). Error bars indicate ±1 s.d. The dotted line is the linear best fit for experimental data for shocks with magnitude ≤ 800 mM. The plateau after 800 mM demonstrates that the cell envelope has reached its minimum length upon large, 3 M hyperosmotic shocks.
Extended Data Figure 2
Extended Data Figure 2. Detergent or EDTA treatment causes dissolution of the outer membrane
a) Description of the outer-membrane release assay used to measure the effect of detergent and EDTA on the outer membrane. See Online Methods for a more detailed description. b) Absorbance of 410 nm light (left axis) in the supernatant from detergent-treated cell suspensions after performing the LAL LPS detection assay (Methods). Absorbance is correlated with the amount of LPS in the sample, and is linear below 1000 EU/mL (right axis). This experiment was performed once. c) Immunoblot with an antibody cross-reactive with several outer-membrane proteins (e.g. LamB and OmpA) of the supernatant of cells treated with various concentrations of N-lauroyl sarcosine (detergent). This experiment was performed once. d) Absorbance of 410 nm light (left axis) in the supernatant from EDTA-treated cell suspensions after performing the LAL LPS detection assay. Absorbance is correlated with the amount of LPS in the sample, and is linear below 1000 EU/mL (right axis). This experiment was performed once. e) Montage of a representative plasmolyzed cell expressing cytosolic GFP lysing upon detergent treatment. Cell expansion corresponds to the time of GFP disappearance (n = 32 cells, 1 experiment). Error bars, ±1 s.d. f) Duration of swelling (left), of release of cytosolic GFP (center), and of release of ribosomes upon lysis of plasmolyzed cells (n = 22, 32, 12 cells, respectively. 1 experiment each). Error bars, ±1 s.d. The duration of swelling is approximately equal to the duration of the release of cytoplasmic contents. g) Ultra performance liquid chromatography of peptidoglycan composition of cell walls purified from untreated (red), sorbitol-treated (yellow), detergent-treated (green), and EDTA-treated (blue) cells. Mean glycan strain lengths (i) and percentage of various peptidoglycan subunit eluents (ii) are the same across all treatments. Dap-Dap: Dimers formed with double diaminopimelic acid bonds as opposed to diaminopimelic acid/D-alanine bonds; lipoprotein: subunits bound to Lpp. n = 4, 2, 2, 1 sacculi preparations for untreated, sorbitol-treated, detergent-treated, and EDTA-treated cells, respectively.
Extended Data Figure 3
Extended Data Figure 3. Detergent treatment causes contraction of the cell wall across a range of conditions and organisms
a) Length of the cell wall versus time during hyperosmotic shock (3 M sorbitol, solid arrow) and subsequent treatment with detergent (5% N-lauroyl sarcosine, dotted arrow), and washout of the detergent (switching back to 3 M sorbitol, dashed arrow) for four representative cells (n = 260 cells). The cells briefly swelled upon washout, then relaxed to the pre-washout rest length. We speculate that the brief swelling is caused by a hypoosmotic shock during washout (lowering the concentration of detergent). That is, we propose that the detergent has a slow diffusion constant through the cell wall, and therefore washing it out imposes a transient hypoosmotic shock, before detergent within the cell diffuses out of it. When it does, the cell wall relaxes again to its rest state, demonstrating that cell-wall contraction upon detergent treatment is not due to compaction by the detergent. b) Lengths of the cell wall versus time during hyperosmotic shock (3 M sorbitol, solid arrow) and subsequent addition of detergent (5% N-lauroyl sarcosine, dotted arrow) for four representative B. subtilis cell chains (n = 112 cell chains). Rather than contract upon detergent treatment, the cell walls re-extend. We hypothesize that the cell wall is in a highly compressed state after 3-M hyperosmotic shock because the cytoplasm is exerting an inward force via connections between the plasma membrane and cell wall. When the plasma membrane is dissolved with detergent, this force is relieved and the cell wall extends to its rest length. c) Lengths of the cell wall of B. subtilis cell chains versus time during a 1-M oscillatory osmotic shock, which caused cell lysis (e.g., red arrows), followed by treatment with detergent (5% N-lauroyl sarcosine, dotted arrow; n = 93 cell chains). The cell walls expanded only slightly upon detergent addition, indicating that it is lysis rather than detergent treatment that causes the re-extension in (b). d) Contraction upon plasmolysis, subsequent lysis, and total contraction for three environmental conditions: i) LB (n = 79, 56, 56 cells, respectively), ii) M9 (n = 46, 52, 38 cells, respectively), and iii) cultured in LB and transferred to PBS before plasmolysis (n = 95, 86, 94 cells, respectively). Error bars indicate ±1 s.d. e) Contraction upon plasmolysis, subsequent lysis, and total contraction for three wild-type E. coli strains: i) MG1655 (n = 79, 56, 56 cells, respectively), ii) MC4100 (n = 48, 48, 48, respectively), and iii) AB1133 (n = 56, 56, 56 cells, respectively). Error bars indicate ±1 s.d. f) Contraction upon plasmolysis, subsequent lysis, and total contraction for i) Pseudomonas aeruginosa (n = 12, 12, 12 cells, respectively), and ii) Vibrio cholerae (n = 36, 36, 36 cells, respectively). Error bars indicate ±1 s.d. g) The mean ratio between the rest length of the outer membrane, lom, and the length of the cell envelope in the fully turgid state, l1, for three wild-type E. coli strains (n = 12, 10, 10 cells for MG155, MC4100, and AB1133, respectively). The rest length of the outer membrane is approximately equal to length of the fully turgid cell for all three strains. Error bars indicate ±1 s.d. The p-value was calculated using a Student’s two-sided t-test. h) Mean contraction upon plasmolysis, subsequent lysis, and total contraction for wild-type AB1133 (n = 56 cells) and an isogenic strain expressing the O8-antigen (n = 55 cels). The ratio for cells expressing the O8 antigen is very large because the contraction upon lysis for the parental wild-type strain (AB1133) was close to zero, and adding the antigen markedly increased contraction. Error bars indicate ±1 s.d. p-values were calculated using a Student’s two-sided t-test.
Extended Data Figure 4
Extended Data Figure 4. Impermeable molecules within the cell wall after lysis cause residual turgor pressure
a) Increasing detergent concentration caused an approximately proportional increase in the mean cell wall contraction upon lysis and the mean total contraction in E. coli MG1655 cells. Each point represents one experiment. Number of cells for each experiment are given in Table S2. b) Representative DAPI-stained E. coli cells before (left) and after (right) lysis shown in phase contrast and epifluorescence, demonstrating that DNA is not retained in the lysed cells. The experiment was performed once. c) Representative E. coli cells expressing a fluorescent protein fusion to the S2 ribosomal protein before (left) and after (right) lysis shown in phase contrast and epifluorescence, demonstrating that ribosomes are not retained in lysed cells. The experiment was performed once. d) Representative E. coli cells expressing cytosolic GFP before (left) and after (right) lysis shown in phase contrast and epifluorescence, demonstrating that GFP is not retained in lysed cells. The experiment was performed once. e) Representative E. coli cells expressing a fluorescently tagged version of MreB after lysis shown in phase contrast (left), epifluorescence (center), and in overlay (right), demonstrating that MreB is retained within most lysed cells, but that cells with weak phase density after lysis retain low levels of MreB (arrows). f) Cumulative fluorescence intensity of MreB-sfGFP versus the average phase-contrast intensity within the cell after lysis (n = 162 cells). Cells with higher phase density have lower intensity. g) Cell wall contraction upon lysis versus average phase-contrast intensity within the cell after lysis (n = 46 cells). h) Total contraction during plasmolysis and lysis versus average phase-contrast intensity within the cell after lysis (n = 46 cells).
Extended Data Figure 5
Extended Data Figure 5. EDTA weakens the E. coli cell envelope
a) Length of the cell wall versus time for seven representative Bacillus subtilis cell chains during treatment with detergent followed by treatment with detergent + 10 mM EDTA (n = 68 cell chains). While detergent caused lysis, subsequent addition of EDTA did not affect cell-wall rest length. b) Lengths of the cell wall of B. subtilis cell chains versus time during 1-M oscillatory osmotic shocks, which caused cell lysis (e.g., red arrows), followed by treatment with 10 mM EDTA (dashed arrow; n = 127 cell chains). EDTA did not affect the rest length of the cell walls. c) (top) Length of the B. subtilis cell wall versus time through a hyperosmotic shock (3 M sorbitol, solid arrow) and subsequent treatment with 10 mM EDTA (dotted arrow) for 4 representative cell chains (n = 61 cell chains). Cell-wall length did not decrease after detergent, as for E. coli. (bottom) micrograph of a two-cell chain expressing cytosolic (strain HA405, left) and a kymograph showing fluorescence intensity along the dotted red line during the experiment in the top graph. The cell chain in the kymograph corresponds to the bottom-most length trace in the top graph. Red arrows demonstrate that the discrete increases in length observed after EDTA treatment correspond to cell lysis events, when fluorescence within the cells begin to decrease. d) Population-averaged E. coli cell-wall length contraction upon EDTA application after plasmolysis increased with increasing concentration of EDTA (n = 131, 193, 225, 138, 81, 94, 36, 28, 72 cells, respectively). Error bars indicate ±1 s.d. e) Length of the cell wall versus time during hyperosmotic shock (3 M sorbitol, solid arrow) and subsequent treatment with 10 mM EDTA + 50 mM MgCl2 (dotted arrow) for representative E. coli cells (n = 91 cells). f) Length of the cell walls of representative E. coli cells during 100-mM oscillatory shocks with 2-min period (n = 243 cells). g) Length of the cell walls of representative E. coli cells during a 100-mM oscillatory shock with 2-min period and 10 mM EDTA (n = 284 cells). h) Population-averaged elongation rate of the E. coli cell wall during 100-mM oscillatory shocks with 2-min period for untreated (black line) and 10 mM EDTA-treated cells (n = 284 cells). i) Effective population-averaged cell length (leff), calculated by integrating the population averaged elongation rate in (h) during 100-mM oscillatory shocks with 2-min period for untreated (black line) and 10 mM EDTA-treated cells (n = 284 cells). Dotted lines are the respective time-averaged leff using a rolling-window averaging filter with a 2-min window (equal to the period of oscillations). j) Deviation of the effective population-averaged length in (i) from the respective time-averaged trace. k) The mean amplitude of oscillation was found by averaging the peak-to-peak amplitude in (j) over cycles (n = 10 cycles). Error bars indicate ±1 s.d. The p-value was calculated using a Student’s two-sided t-test. l) Amplitude of cell-wall length oscillations (ratio with respect to untreated wild-type; Fig. 2j) versus cell-wall stiffness calculated from plasmolysis-lysis experiments (ratio with respect to untreated wild-type; Fig. 2g). Solid line, linear best fit for only perturbations to the outer membrane (red circles; linear regression: R2 = 0.71, F = 9.7, p = 0.0356). Dashed line, best fit when additionally considering perturbations to protein linkages between the outer membrane and cell wall (dashed circles; linear regression: R2 = 0.25, F = 1.4, not significantly different from horizontal). For the O8-expressing strain, we conservatively used a stiffness ratio of 1.5 for the fits.
Extended Data Figure 6
Extended Data Figure 6. FM 4-64 softens E. coli cells
a) Cantilever force versus indentation distance during successively increasing EDTA concentrations, as in Fig. 3a. Lines indicate the average force-distance curves taken during the period in which the cell was treated with the given concentration of EDTA. Shaded areas indicate ±1 s.d (n = 4 cells). Stiffness was measured every minute during the 5-10 min periods when the cell was treated with each EDTA concentration. Average force curves were registered with respect to the onset of force increase as the cantilever was lowered. b) Stiffness of a representative cell versus time, as measured with AFM. At t = 10 min the cell was treated with 2 μg/mL FM 4-64 (n = 3 cells). c) The ratio of the cell stiffness computed with AFM (Fig. 3c) versus the ratio of envelope stiffness computed from plasmolysis-lysis experiments (Fig. 2g) across chemical and genetic perturbations. The solid line is the linear best fit (linear regression: R2 = 0.27, F = 1.4, not significantly different from horizontal). The numbers of cells used for each measurement are the same as given for Fig. 3c (AFM measurements of cell stiffness) and Fig. 2d-f (envelope stiffness). For the O8-expressing strain, we conservatively used a stiffness ratio of 1.5 for the fit. d) Calibration of AFM measurements using a polydimethylsiloxane sample with known Young’s modulus of 3.5 MPa. (top) Distribution of measurements of Young’s modulus across the calibration sample. Red curve is Gaussian fit to the data. Dashed line is the mean. (top, inset) Young’s modulus measurements were spatially uniform. (bottom) Box plot of the distribution of Young’s modulus measurements showing the median stiffness (red line), 25% and 75% percentiles (edges of box), extreme bounds (whiskers), and outliers (red points).
Extended Data Figure 7
Extended Data Figure 7. Genetic perturbations to the outer membrane render cells vulnerable to mechanical perturbation
a) Cell lysis versus time and cycle number during application of 5% detergent (N-lauroyl sarcosine, n = 112 cells) and 5% detergent + 400 mM oscillatory osmotic shock (n = 100 cells). Cell-lysis rate increased dramatically during 400-mM oscillatory osmotic shocks. b) Cell lysis versus time and cycle number during 400-mM oscillatory osmotic shocks with 2-min period for mutant E. coli strains with the MC4100 wild-type background (n = 476, 98, 187, 99, 280 cells for wild-type, imp4213, ΔompA, Δlpp, and Δpal, respectively). c) Cell lysis versus time and cycle number during 400-mM oscillatory osmotic shock with 2-min period for E. coli wild-type AB1133 (n = 273 cells) and ATM378 (AB1133+O8, n = 123 cells). d) Time at which 25% of cells had lysed (ratio to untreated wildtype, Fig. 4b) versus the ratio of amplitudes during 100-mM oscillatory osmotic shocks (Fig. 2j). The line is the linear best fit (linear regression: R2 = 0.84, F = 19.4, p = 0.0045). e) Serial dilutions of overnight E. coli L-form cultures spotted onto solid media permissive for L-form growth. For chemical treatments, 10 mM EDTA and 2 μg/mL FM 4-64 were included in the liquid media used to culture L-forms overnight, but not in the solid media onto which L-forms were spotted. Mutants (ΔompA, +O8, Δlpp, Δpal) formed very small colonies, and were thus viewed using an inverted microscope to ensure accurate counting.
Figure 1
Figure 1. Detergent treatment after plasmolysis causes further contraction of the Gram-negative cell wall
a) Model of the cell wall/outer membrane complex as parallel linear springs with spring constants kcw, kom, and rest lengths lcw, lom. b) E. coli cells (turgid, plasmolyzed, lysed) stained with WGA-488 and FM 4-64. White arrow: residual phase signal after lysis (n = 84 cells, 3 experiments). c) Left: cell-wall length versus time during hyperosmotic shock and treatment with detergent for representative cells (n = 79 cells). Red arrow: sharp swelling upon lysis. Right: model of turgid/plasmolyzed/lysed cellular state. d-f) Histograms of length contraction upon (d) plasmolysis (n = 79 cells), (e) lysis (n = 56 cells), and (f) in total (n = 56 cells). Circle and error bars, mean ± 1 s.d.
Figure 2
Figure 2. Cellular mechanical properties depend on the composition and integrity of the outer membrane
a) E. coli cells (turgid/plasmolyzed/lysozyme) stained as in Fig. 1b (1 experiment, similar results for two other wild-type strains, Extended Data Fig. 3g). b) Left: mean ratio between the rest length of the outer membrane, lom, and the length of the turgid cell, l1. Right: mean ratio between lom and the length of the cell envelope during plasmolysis, l2 (n = 12 cells). Error bars: ± 1 s.d. p-value, paired two-sided t-test. c) Length of representative cell walls versus time during hyperosmotic shock and treatment with EDTA (n = 184 cells total). d-f) Cell wall length contractions upon (d) plasmolysis (e) lysis and (f) in total under chemical and genetic perturbations to outer membrane (ratio with respect to WT, n=79,309,65,70,65,55,59,50 cells). p-values: Student’s two-sided t-test, difference from untreated wild-type control. n.s.: not significant. g) Outer membrane stiffness under chemical or genetic perturbations (ratio with respect to wild-type). Error bars, ± 1 s.d. Uncertainty propagated from εl and εp measurements. h) Sorbitol concentration in growth medium during 100-mM oscillatory osmotic shocks with 2-min period. i) Representative cell-wall lengths during shocks in (h) (blue traces; n = 243 cells). Green shaded period, EDTA included. Red curve, effective population-averaged length. j) Mean amplitude of cell-wall length oscillations during 100-mM oscillatory shock with a 2-min period (n = 10 cycles for each measurement). Error bars, ± 1 s.d. p-values: Student’s two-sided t-test, difference from untreated wild-type control. n.s.: not significant.
Figure 3
Figure 3. The stiffness of turgid cells depends on outer-membrane integrity
a) AFM measurements of cell stiffness versus time. One cell was treated with increasing EDTA concentrations (similar data for 4 treated, 2 untreated cells). b) Mean cell stiffness versus EDTA concentration (n = 4 cells for each measurement). Error bars, ± 1 s.d. p-values: Student’s two-sided t-test, difference from untreated wild-type control. n.s.: not significant. c) AFM measurements of cell stiffness under chemical or genetic perturbations (relative to untreated wild-type, n=7,4,3,13,8,7,7 cells). Δpal cells lysed under AFM. Error bars, ± 1 s.d. p-values: Student’s two-sided t-test, difference from untreated wild-type control. n.s.: not significant. d) Microfluidic cell-bending assay. e) Displacement versus axial length for untreated (blue dots, n = 300) and EDTA-treated (pink dots, n = 367) cells. Solid and dashed black lines, best fits of mechanical model used to calculate the bending rigidities. f) Mean bending rigidities of untreated and EDTA-treated cells. Error bars, 95% confidence. p-value calculated from confidence intervals.
Figure 4
Figure 4. Undermining outer-membrane integrity reduces survival during mechanical perturbation and L-form proliferation
a) Cell lysis versus time under chemical perturbation to outer membrane. Shock: 400-mM oscillations with 2-min period. No cells died in the absence of both oscillatory shock and outer membrane perturbation (n=1000 cells). t25, time at which 25% of cells had lysed. b) Time at which 25% of cells had lysed under chemical or genetic perturbations (ratio to untreated wild-type). c) Concentration of viable L-forms in overnight cultures under chemical or genetic perturbations to outer membrane (ratio to untreated wild-type, 1 experiment).

Comment in

References

    1. Zgurskaya HI, Lopez CA, Gnanakaran S. Permeability Barrier of Gram-Negative Cell Envelopes and Approaches To Bypass It. ACS infectious diseases. 2015;1:512–522. doi: 10.1021/acsinfecdis.5b00097. - DOI - PMC - PubMed
    1. Martin H, Frank H. Quantitative Bausteinanalyse der Stützmembran in der Zellwand von Escherichia coli B. Zeitschrift für Naturforschung B. 1962;17:190–196.
    1. Deng Y, Sun M, Shaevitz JW. Direct measurement of cell wall stress stiffening and turgor pressure in live bacterial cells. Phys Rev Lett. 2011;107:158101. - PubMed
    1. Holtje JV. Growth of the stress-bearing and shape-maintaining murein sacculus of Escherichia coli. Microbiol Mol Biol Rev. 1998;62:181–203. - PMC - PubMed
    1. Koch AL. Biophysics of bacterial walls viewed as stress-bearing fabric. Microbiological reviews. 1988;52:337–353. - PMC - PubMed

Publication types

MeSH terms